***Last / Change / Volume data in this table is the closing quote data***
Symbol/Exchange
Company Name
Industry Group |
PRICE |
CHANGE
(%Change) |
Day High |
Volume
(% DAV)
(% 50 day avg vol) |
52 Wk Hi
% From Hi |
Featured
Date |
Price
Featured |
Pivot Featured |
|
Max Buy |
AMBA
-
NASDAQ
Ambarella Inc
ELECTRONICS - Semiconductor - Specialized
|
$15.95
|
-0.10
-0.62% |
$16.13
|
779,088
66.98% of 50 DAV
50 DAV is 1,163,200
|
$19.44
-17.95%
|
7/15/2013
|
$17.87
|
PP = $18.68
|
|
MB = $19.61
|
Most Recent Note - 8/6/2013 4:33:09 PM
G - Slumped further below its 50 DMA line which acted as resistance following the technical violation which triggered a sell signal last week. A rebound above that important short-term average would help its outlook improve.
>>> The latest Featured Stock Update with an annotated graph appeared on 7/17/2013. Click here.
View all notes |
Alert me of new notes |
CANSLIM.net Company Profile |
SEC |
Zacks Reports |
StockTalk |
News |
Chart |
Request a new note
C
A N
S L
I M


|
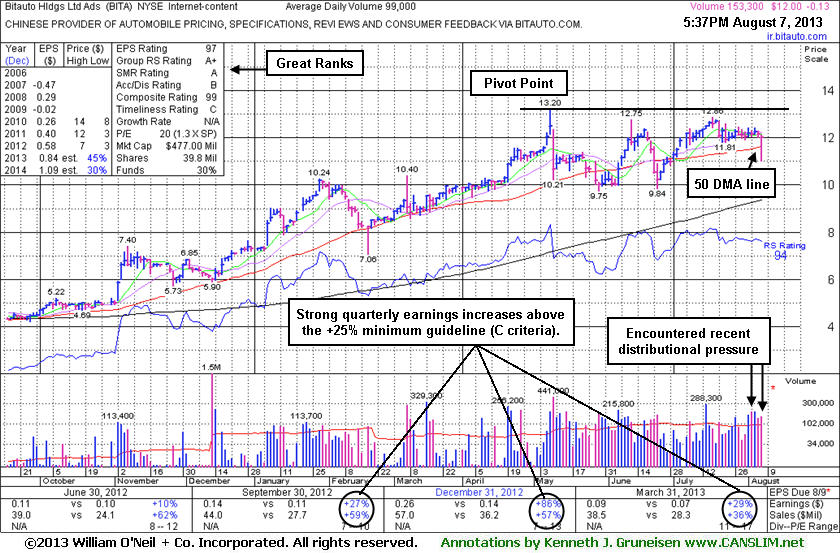
BITA
-
NYSE
Bitauto Hldgs Ltd Ads
INTERNET - Internet Information Providers
|
$12.00
|
-0.13
-1.07% |
$12.09
|
153,350
154.90% of 50 DAV
50 DAV is 99,000
|
$13.20
-9.09%
|
8/7/2013
|
$12.01
|
PP = $13.30
|
|
MB = $13.97
|
 Most Recent Note - 8/7/2013 6:08:37 PM
Y - Highlighted in yellow with pivot point based on its 5/08/13 high plus 10 cents in the earlier mid-day report (read here). This China-based Internet-Content firm is due to report Second Quarter 2013 financial results before the open on Thursday, August 8, 2013. Found prompt support after undercutting its 50 DMA line following today's gap down. Churned above average volume without making price progress on the right side of its choppy 13-week base pattern, a sign of distributional pressure. Quarterly and annual earnings (C and A criteria) history through Mar '13 has been strong. Its small supply (S criteria) of only 14.4 million shares in the public float can contribute to great volatility in the event of institutional buying or selling. Volume driven gains are needed to to trigger a technical buy signal. See the latest FSU analysis for more details and a new annotated graph.
>>> The latest Featured Stock Update with an annotated graph appeared on 8/7/2013. Click here.
View all notes |
Alert me of new notes |
CANSLIM.net Company Profile |
SEC |
Zacks Reports |
StockTalk |
News |
Chart |
Request a new note
C
A N
S L
I M
|
CELG
-
NASDAQ
Celgene Corp
DRUGS - Drug Manufacturers - Major
|
$142.65
|
+0.91
0.64% |
$144.11
|
2,812,122
97.82% of 50 DAV
50 DAV is 2,874,800
|
$149.92
-4.85%
|
7/11/2013
|
$133.25
|
PP = $131.92
|
|
MB = $138.52
|
Most Recent Note - 8/6/2013 4:14:26 PM
G - Retreated from its 52-week and all-time highs with near average but higher volume today. Extended from its prior base and support at old highs in the $131 area.
>>> The latest Featured Stock Update with an annotated graph appeared on 7/29/2013. Click here.
View all notes |
Alert me of new notes |
CANSLIM.net Company Profile |
SEC |
Zacks Reports |
StockTalk |
News |
Chart |
Request a new note
C
A N
S L
I M
|
FLT
-
NYSE
Fleetcor Technologies
DIVERSIFIED SERVICES - Business/Management Services
|
$97.94
|
-0.25
-0.25% |
$98.50
|
409,865
56.60% of 50 DAV
50 DAV is 724,200
|
$100.87
-2.90%
|
5/29/2013
|
$86.02
|
PP = $85.66
|
|
MB = $89.94
|
Most Recent Note - 8/2/2013 12:47:14 PM
G- Reported earnings +37% on +29% sales revenues for the Jun '13 quarter. Finally making meaningful progress after forming a new late-stage base, it finished strong on the prior session and gapped up today hitting new 52-week and all-time highs with a 3rd consecutive gain backed by above average volume. Found support near its 50 DMA during its latest consolidation.
>>> The latest Featured Stock Update with an annotated graph appeared on 7/18/2013. Click here.
View all notes |
Alert me of new notes |
CANSLIM.net Company Profile |
SEC |
Zacks Reports |
StockTalk |
News |
Chart |
Request a new note
C
A N
S L
I M
|
GNRC
-
NYSE
Generac Hldgs Inc
CONSUMER DURABLES - Electronic Equipment
|
$41.76
|
-0.45
-1.07% |
$42.15
|
734,963
60.69% of 50 DAV
50 DAV is 1,211,100
|
$44.30
-5.73%
|
7/30/2013
|
$42.60
|
PP = $42.10
|
|
MB = $44.21
|
Most Recent Note - 8/2/2013 12:49:56 PM
Y - Gapped down today after pricing a Secondary Offering. It recently rallied from an advanced "3-weeks tight" base. Disciplined investors always limit losses by selling if any stock falls more than -7% from its purchase price.
>>> The latest Featured Stock Update with an annotated graph appeared on 7/30/2013. Click here.
View all notes |
Alert me of new notes |
CANSLIM.net Company Profile |
SEC |
Zacks Reports |
StockTalk |
News |
Chart |
Request a new note
C
A N
S L
I M
|
Symbol/Exchange
Company Name
Industry Group |
PRICE |
CHANGE
(%Change) |
Day High |
Volume
(% DAV)
(% 50 day avg vol) |
52 Wk Hi
% From Hi |
Featured
Date |
Price
Featured |
Pivot Featured |
|
Max Buy |
KORS
-
NYSE
Michael Kors Hldgs Ltd
RETAIL - Apparel Stores
|
$69.53
|
-0.86
-1.22% |
$70.53
|
3,125,411
78.06% of 50 DAV
50 DAV is 4,004,100
|
$71.50
-2.76%
|
8/6/2013
|
$69.66
|
PP = $66.28
|
|
MB = $69.59
|
Most Recent Note - 8/6/2013 6:24:08 PM
Y - Hit new 52-week and all-time highs with today's considerable gain backed by 4 times average volume clinching a technical buy signal while quickly rallying to a finish above its "max buy" level. It was highlighted in yellow with pivot point based on its 5/30/13 high plus 10 cents in the earlier mid-day report (read here). Relative Strength rating is currently 78, slightly below the 80+ minimum guideline for buy candidates. It has maintained high ranks due to its strong earnings history (meeting C and A criteria) including earnings +79% on +54% sales for the Jun '13 quarter just reported. See the latest FSU analysis for more details and a new annotated graph.
>>> The latest Featured Stock Update with an annotated graph appeared on 8/6/2013. Click here.
View all notes |
Alert me of new notes |
CANSLIM.net Company Profile |
SEC |
Zacks Reports |
StockTalk |
News |
Chart |
Request a new note
C
A N
S L
I M
|
LOPE
-
NASDAQ
Grand Canyon Education
DIVERSIFIED SERVICES - Education and; Training Services
|
$35.50
|
-0.28
-0.78% |
$36.00
|
364,824
83.66% of 50 DAV
50 DAV is 436,100
|
$37.17
-4.49%
|
6/19/2013
|
$31.47
|
PP = $34.17
|
|
MB = $35.88
|
Most Recent Note - 7/30/2013 6:37:23 PM
Y - Reported its second quarter results following today's market close after enduring mild distributional pressure near its 52-week high. Finished still perched above its pivot point and below its "max buy" level. Prior highs in the $34 area define support along with its 50 DMA line.
>>> The latest Featured Stock Update with an annotated graph appeared on 7/19/2013. Click here.
View all notes |
Alert me of new notes |
CANSLIM.net Company Profile |
SEC |
Zacks Reports |
StockTalk |
News |
Chart |
Request a new note
C
A N
S L
I M
|
PCLN
-
NASDAQ
Priceline.Com Inc
INTERNET - Internet Software and Services
|
$927.58
|
-7.80
-0.83% |
$932.72
|
869,634
132.61% of 50 DAV
50 DAV is 655,800
|
$940.00
-1.32%
|
7/8/2013
|
$878.28
|
PP = $847.43
|
|
MB = $889.80
|
Most Recent Note - 8/7/2013 1:31:08 PM
G - Hovering near its 52-week high, extended from any sound base. Due to report earnings August 8th. Its 50 DMA line and prior highs in the $847 area define important support to watch on pullbacks.
>>> The latest Featured Stock Update with an annotated graph appeared on 7/25/2013. Click here.
View all notes |
Alert me of new notes |
CANSLIM.net Company Profile |
SEC |
Zacks Reports |
StockTalk |
News |
Chart |
Request a new note
C
A N
S L
I M
|
PRAA
-
NASDAQ
Portfolio Recovery Assoc
DIVERSIFIED SERVICES - Business/Management Services
|
$50.55
|
-1.20
-2.32% |
$51.75
|
573,388
142.35% of 50 DAV
50 DAV is 402,800
|
$54.62
-7.46%
|
7/31/2013
|
$51.43
|
PP = $54.72
|
|
MB = $57.46
|
Most Recent Note - 8/7/2013 5:45:00 PM
Y - Pulled back today with above average volume, slumping near its 50 DMA line. Recently rallied above its 50 DMA line with volume-driven gain but it has not triggered a proper technical buy signal since returning to the Featured Stocks list highlighted in yellow with new pivot point cited based on its 6/17/13 high plus 10 cents in the 7/31/13 mid-day report (read here) with caution - "It faces some resistance and needs additional volume-driven gains to trigger a proper new technical buy signal. Reported earnings +37% on +24% sales revenues for the Jun '13 quarter. Showing resilience since dropped from the Featured Stocks list on 7/10/13 due to technical weakness."
>>> The latest Featured Stock Update with an annotated graph appeared on 8/2/2013. Click here.
View all notes |
Alert me of new notes |
CANSLIM.net Company Profile |
SEC |
Zacks Reports |
StockTalk |
News |
Chart |
Request a new note
C
A N
S L
I M
|
PRLB
-
NYSE
Proto Labs Inc
MANUFACTURING - Small Tools and Accessories
|
$63.44
|
-2.59
-3.92% |
$65.86
|
748,164
157.54% of 50 DAV
50 DAV is 474,900
|
$72.08
-11.99%
|
7/29/2013
|
$64.86
|
PP = $67.50
|
|
MB = $70.88
|
Most Recent Note - 8/7/2013 5:40:31 PM
Y - Slumped on lighter but still above average volume today, testing support near its 50 DMA line and prior lows again after making only limited progress above prior highs and encountering recent distributional pressure. Disciplined investors always limit losses if any stock falls more than -7% from their purchase price. See the latest FSU analysis for more details and a new annotated graph.
>>> The latest Featured Stock Update with an annotated graph appeared on 8/5/2013. Click here.
View all notes |
Alert me of new notes |
CANSLIM.net Company Profile |
SEC |
Zacks Reports |
StockTalk |
News |
Chart |
Request a new note
C
A N
S L
I M
|
Symbol/Exchange
Company Name
Industry Group |
PRICE |
CHANGE
(%Change) |
Day High |
Volume
(% DAV)
(% 50 day avg vol) |
52 Wk Hi
% From Hi |
Featured
Date |
Price
Featured |
Pivot Featured |
|
Max Buy |
QCOR
-
NASDAQ
Questcor Pharmaceuticals
DRUGS - Biotechnology
|
$64.56
|
-1.51
-2.29% |
$66.85
|
1,197,232
56.19% of 50 DAV
50 DAV is 2,130,800
|
$70.55
-8.49%
|
7/31/2013
|
$66.46
|
PP = $59.01
|
|
MB = $61.96
|
Most Recent Note - 8/7/2013 5:41:53 PM
G - Pulling back with lighter volume totals after an impressive streak of volume-driven gains. Quickly got extended beyond its "max buy" level after highlighted in yellow in the 7/31/13 mid-day report (read here) with a weekly graph which illustrated its powerful long-term breakout to new highs.
>>> The latest Featured Stock Update with an annotated graph appeared on 8/1/2013. Click here.
View all notes |
Alert me of new notes |
CANSLIM.net Company Profile |
SEC |
Zacks Reports |
StockTalk |
News |
Chart |
Request a new note
C
A N
S L
I M
|
RRTS
-
NYSE
Roadrunner Trans Systems
TRANSPORTATION - Air Delivery and Freight Service
|
$29.81
|
-0.45
-1.49% |
$30.23
|
74,286
52.91% of 50 DAV
50 DAV is 140,400
|
$30.98
-3.79%
|
4/3/2013
|
$22.77
|
PP = $23.75
|
|
MB = $24.94
|
Most Recent Note - 8/6/2013 4:19:53 PM
G - Hovering near its 52-week high, technically extended from any sound base. Fundamentally, it reported earnings +19% on +26% in the Jun '13 quarter, raising more concerns with its 2nd consecutive quarterly comparison with earnings increasing below the +25% minimum guideline (C criteria).
>>> The latest Featured Stock Update with an annotated graph appeared on 7/22/2013. Click here.
View all notes |
Alert me of new notes |
CANSLIM.net Company Profile |
SEC |
Zacks Reports |
StockTalk |
News |
Chart |
Request a new note
C
A N
S L
I M
|
SFUN
-
NYSE
Soufun Hldgs Ltd Ads A
INTERNET - Internet Information Providers
|
$34.91
|
+0.06
0.17% |
$35.70
|
399,100
112.01% of 50 DAV
50 DAV is 356,300
|
$36.43
-4.17%
|
7/16/2013
|
$29.54
|
PP = $27.90
|
|
MB = $29.30
|
Most Recent Note - 8/1/2013 12:55:58 PM
G - Extended from its latest base following volume-driven gains. Prior highs in the $28-29 area define initial support to watch.
>>> The latest Featured Stock Update with an annotated graph appeared on 7/16/2013. Click here.
View all notes |
Alert me of new notes |
CANSLIM.net Company Profile |
SEC |
Zacks Reports |
StockTalk |
News |
Chart |
Request a new note
C
A N
S L
I M
|
SSNC
-
NASDAQ
S S & C Technologies
COMPUTER SOFTWARE and SERVICES - Application Software
|
$35.27
|
-0.37
-1.04% |
$35.59
|
831,665
207.19% of 50 DAV
50 DAV is 401,400
|
$38.80
-9.10%
|
7/11/2013
|
$35.80
|
PP = $34.54
|
|
MB = $36.27
|
Most Recent Note - 8/7/2013 1:36:10 PM
Y - Rebounded from earlier lows as it found prompt support after undercutting its 50 DMA line with today's loss on above average volume. Prior highs in the $34 area also help define important near-term support. Disciplined investors always limit losses if ever any stock falls more than -7% from their purchase price.
>>> The latest Featured Stock Update with an annotated graph appeared on 7/12/2013. Click here.
View all notes |
Alert me of new notes |
CANSLIM.net Company Profile |
SEC |
Zacks Reports |
StockTalk |
News |
Chart |
Request a new note
C
A N
S L
I M
|
SSYS
-
NASDAQ
Stratasys Ltd
COMPUTER HARDWARE - Computer Peripherals
|
$86.16
|
-0.86
-0.99% |
$87.12
|
1,045,933
143.32% of 50 DAV
50 DAV is 729,800
|
$96.44
-10.66%
|
7/8/2013
|
$91.44
|
PP = $95.00
|
|
MB = $99.75
|
Most Recent Note - 8/6/2013 4:22:04 PM
Y - Fell on higher but below average volume today, slumping near its 50 DMA line and a prior low ($85.95 on 7/24/13) defining important near-term support to watch. More damaging losses could raise greater concerns and trigger worrisome technical sell signals.
>>> The latest Featured Stock Update with an annotated graph appeared on 7/24/2013. Click here.
View all notes |
Alert me of new notes |
CANSLIM.net Company Profile |
SEC |
Zacks Reports |
StockTalk |
News |
Chart |
Request a new note
C
A N
S L
I M
|
Symbol/Exchange
Company Name
Industry Group |
PRICE |
CHANGE
(%Change) |
Day High |
Volume
(% DAV)
(% 50 day avg vol) |
52 Wk Hi
% From Hi |
Featured
Date |
Price
Featured |
Pivot Featured |
|
Max Buy |
STMP
-
NASDAQ
Stamps.Com Inc
INTERNET - Internet Software and Services
|
$39.65
|
-0.65
-1.61% |
$40.30
|
161,189
112.17% of 50 DAV
50 DAV is 143,700
|
$46.47
-14.68%
|
7/31/2013
|
$40.00
|
PP = $42.98
|
|
MB = $45.13
|
Most Recent Note - 8/6/2013 4:24:51 PM
Y - Encountered more distributional pressure with today's 3rd consecutive loss on higher above average volume while slumping toward its 50 DMA line. Disciplined investors limit losses if any stock falls more than -7% from their purchase price.
>>> The latest Featured Stock Update with an annotated graph appeared on 7/31/2013. Click here.
View all notes |
Alert me of new notes |
CANSLIM.net Company Profile |
SEC |
Zacks Reports |
StockTalk |
News |
Chart |
Request a new note
C
A N
S L
I M
|
VRX
-
NYSE
Valeant Pharmaceuticals
DRUGS - Drug Manufacturers - Other
|
$97.59
|
+1.87
1.95% |
$97.70
|
2,001,093
108.48% of 50 DAV
50 DAV is 1,844,700
|
$97.02
0.59%
|
4/30/2013
|
$60.24
|
PP = $76.66
|
|
MB = $80.49
|
Most Recent Note - 8/6/2013 4:30:21 PM
Y- Hovering near its 52-week high after wedging higher with recent gains lacking great volume conviction while rising from a 9-week cup-with-handle base. Due to report Q2 results before the open on August 7, 2013, and volume and volatility often increase near earnings news. No new pivot point has been cited while members were repeatedly cautioned - "Concerns were raised by its Mar '13 earnings report with only a +14% earnings increase, below the +25% minimum guideline (C criteria) for buy candidates."
>>> The latest Featured Stock Update with an annotated graph appeared on 7/23/2013. Click here.
View all notes |
Alert me of new notes |
CANSLIM.net Company Profile |
SEC |
Zacks Reports |
StockTalk |
News |
Chart |
Request a new note
C
A N
S L
I M
|
YNDX
-
NASDAQ
Yandex N V Class A
INTERNET - Internet Information Providers
|
$32.76
|
-0.59
-1.77% |
$32.94
|
1,564,588
62.86% of 50 DAV
50 DAV is 2,489,100
|
$34.27
-4.41%
|
7/10/2013
|
$29.29
|
PP = $29.59
|
|
MB = $31.07
|
Most Recent Note - 8/6/2013 4:31:29 PM
G - Holding its ground stubbornly near its 52-week high with small losses on light volume following volume-driven gains into new high territory. Prior highs in the $28-29 area define near-term support to watch.
>>> The latest Featured Stock Update with an annotated graph appeared on 7/26/2013. Click here.
View all notes |
Alert me of new notes |
CANSLIM.net Company Profile |
SEC |
Zacks Reports |
StockTalk |
News |
Chart |
Request a new note
C
A N
S L
I M
|