You are not logged in.
This means you
CAN ONLY VIEW reports that were published prior to Monday, April 14, 2025.
You
MUST UPGRADE YOUR MEMBERSHIP if you want to see any current reports.
AFTER MARKET UPDATE - MONDAY, AUGUST 4TH, 2014
Previous After Market Report Next After Market Report >>>
|
|
|
|
DOW |
+75.91 |
16,569.28 |
+0.46% |
|
Volume |
661,062,460 |
-15% |
|
Volume |
1,540,988,100 |
-19% |
|
NASDAQ |
+31.25 |
4,383.89 |
+0.72% |
|
Advancers |
1,891 |
60% |
|
Advancers |
1,763 |
61% |
|
S&P 500 |
+13.84 |
1,938.99 |
+0.72% |
|
Decliners |
1,175 |
37% |
|
Decliners |
1,027 |
36% |
|
Russell 2000 |
+9.96 |
1,124.82 |
+0.89% |
|
52 Wk Highs |
29 |
|
|
52 Wk Highs |
24 |
|
|
S&P 600 |
+5.59 |
648.88 |
+0.87% |
|
52 Wk Lows |
69 |
|
|
52 Wk Lows |
95 |
|
|
 |
Gains Came With Lighter Volume Totals on Exchanges
Kenneth J. Gruneisen - Passed the CAN SLIM® Master's Exam
Stocks finished higher in a volatile trading session on Monday. The volume totals were lighter than the prior session volume totals on the NYSE and on the Nasdaq exchange. Advancers led decliners by a 3-2 margin on the NYSE and on the Nasdaq exchange. There were 11 high-ranked companies from the CANSLIM.net Leaders List that made new 52-week highs and appeared on the CANSLIM.net BreakOuts Page, up from the prior session total of 6 stocks. A healthy level of leadership (stocks hitting new 52-week highs) is necessary for any sustained rally. New 52-week lows outnumbered new 52-week highs on the NYSE and on the Nasdaq exchange. There were gains from 8 of the 12 of the high-ranked companies currently included on the Featured Stocks Page. The market (M criteria) deterioration appeared to earn the label of a "correction" last week as the technical damage became significant to chart readers, however, the newspaper's experts have described it thus far as an "uptrend under pressure". Disciplined investors limit losses and reduce market exposure during rough market periods by selling any stocks which fall more than -7% from their purchase price.
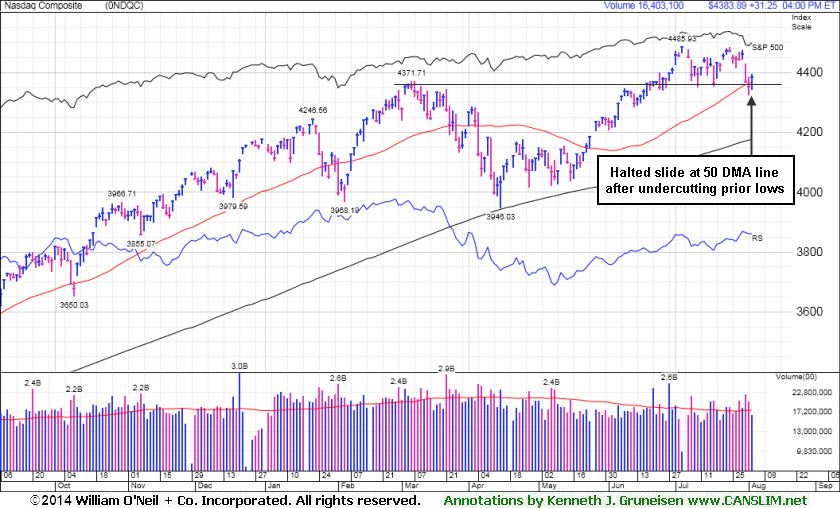
PICTURED: The NASDAQ was up 31 points to 4,383, halting its slide at its 50-day moving average (DMA) line after undercutting prior lows.
The major averages advanced following their worst week since 2012. Dow rose 75 points to 16,569. The S&P 500 increased 13 points to 1,938. Reduced fears of a debt crisis in Portugal helped stocks recover after the country handed its largest bank a $6.6 billion bailout. Nine of the 10 S&P 500 sectors gained ground. Energy and consumer discretionary were two of the best performing groups. Anadarko Petroleum (APC +4.84%) rallied on news of an agreement to remove anti-fracking initiates from a voting ballot in Colorado.
Among consumer stocks, Amazon (AMZN +2.15%) jumped while Disney (DIS +2.18%). Financials also helped lift the market. Berkshire Hathaway's class B shares (BRKB +3.09%) rose after the company posted a second-quarter profit that beat analyst estimates. Shares of AIG (AIG +1.17%) edged higher before the insurer reported earnings results after the closing bell. The more defensive utilities sector retreated. Duke Energy (DUK -1.01%) and American Electric Power (AEP -1.74%) declined.
Treasuries finished mixed. The 10-year note rose 1/32 to yield 2.49%. The 30-year bond declined 8/32 to yield 3.29%.
|
 Kenneth J. Gruneisen started out as a licensed stockbroker in August 1987, a couple of months prior to the historic stock market crash that took the Dow Jones Industrial Average down -22.6% in a single day. He has published daily fact-based fundamental and technical analysis on high-ranked stocks online for two decades. Through FACTBASEDINVESTING.COM, Kenneth provides educational articles, news, market commentary, and other information regarding proven investment systems that work in good times and bad.
Comments contained in the body of this report are technical opinions only and are not necessarily those of Gruneisen Growth Corp. The material herein has been obtained from sources believed to be reliable and accurate, however, its accuracy and completeness cannot be guaranteed. Our firm, employees, and customers may effect transactions, including transactions contrary to any recommendation herein, or have positions in the securities mentioned herein or options with respect thereto. Any recommendation contained in this report may not be suitable for all investors and it is not to be deemed an offer or solicitation on our part with respect to the purchase or sale of any securities. |
|
 |
Retail, Tech, Financial and Energy-Linked Groups Rose
Kenneth J. Gruneisen - Passed the CAN SLIM® Master's Exam
Energy-related shares had a positive bias as the Oil Services Index ($OSX +1.62%) and the Integrated Oil Index ($XOI +1.75%) were among the standout group gainers. The Gold & Silver Index ($XAU -1.19%) lost ground and was a clear laggard. The Retail Index ($RLX +1.30%) was a positive influence on the major averages and the financial groups had a slightly positive bias as the Bank Index ($BKX +0.32%) and the Broker/Dealer Index ($XBD +0.59%) both edged higher. The tech sector saw modest gains from the Semiconductor Index ($SOX +0.41%), Networking Index ($NWX +0.77%), and the Biotechnology Index ($BTK +0.95%).
Charts courtesy www.stockcharts.com
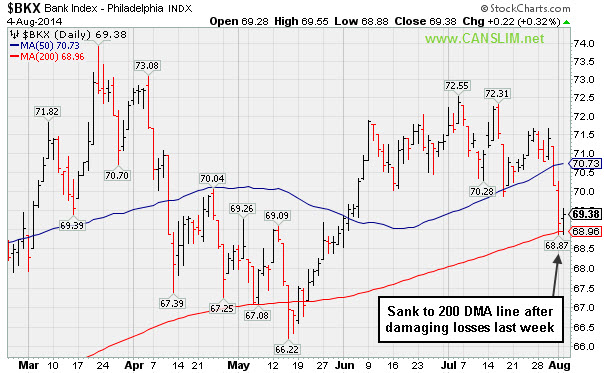
PICTURED: The Bank Index ($BKX +0.32%) sank to its 200-day moving average (DMA) line after damaging losses last week
| Oil Services |
$OSX |
291.68 |
+4.64 |
+1.62% |
+3.79% |
| Integrated Oil |
$XOI |
1,659.23 |
+28.60 |
+1.75% |
+10.38% |
| Semiconductor |
$SOX |
612.29 |
+2.53 |
+0.41% |
+14.44% |
| Networking |
$NWX |
323.07 |
+2.47 |
+0.77% |
-0.27% |
| Broker/Dealer |
$XBD |
161.90 |
+0.95 |
+0.59% |
+0.84% |
| Retail |
$RLX |
889.60 |
+11.40 |
+1.30% |
-5.34% |
| Gold & Silver |
$XAU |
98.31 |
-1.18 |
-1.19% |
+16.83% |
| Bank |
$BKX |
69.38 |
+0.22 |
+0.32% |
+0.17% |
| Biotech |
$BTK |
2,769.60 |
+26.10 |
+0.95% |
+18.84% |
|
|
|
 |
Damaging Gap Down Hurt Technical Stance
Kenneth J. Gruneisen - Passed the CAN SLIM® Master's Exam
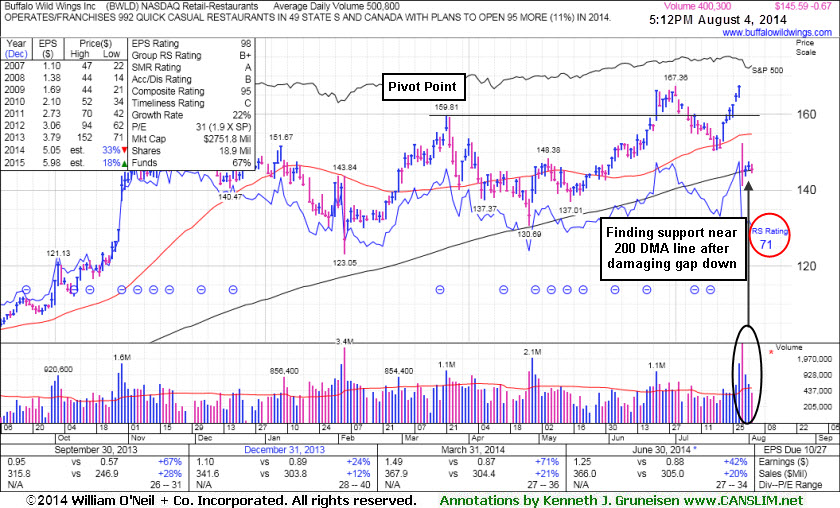
Buffalo Wild Wings Inc (BWLD -$0.67 or -0.46% to $145.59) recently gapped down for a damaging loss on heavy volume, violating its 50-day moving average (DMA) line and triggering a technical sell signal. It has been trading near its 200 DMA line which may act as support, but overhead supply is likely to hinder any upward price progress for the near term. It will be dropped from the Featured Stocks list tonight. It reported earnings +42% on +20% sales revenues for the Jun '14 quarter, satisfying the C criteria. Its Relative Strength rating has slumped to 71, well below the 80+ minimum guideline for buy candidates. It was last shown in this FSU section on 7/14/14 with annotated graphs under the headline, "Slump Into Prior Base Negated Recent Breakout", as it encountered distributional pressure.
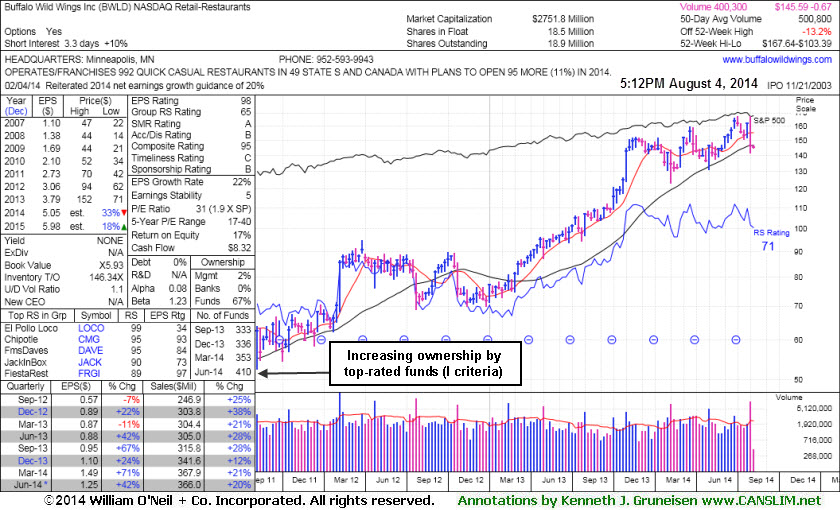
The number of top-rated funds owning its shares rose from 333 in Sep '13 to 410 in Jun '14, a reassuring sign concerning the I criteria. Prior reports cautioned members - "Its small supply of only 18.9 million shares (S criteria) outstanding can contribute to great price volatility in the event of institutional buying or selling."
|
|
|
Color Codes Explained :
Y - Better candidates highlighted by our
staff of experts.
G - Previously featured
in past reports as yellow but may no longer be buyable under the
guidelines.
***Last / Change / Volume data in this table is the closing quote data***
Symbol/Exchange
Company Name
Industry Group |
PRICE |
CHANGE
(%Change) |
Day High |
Volume
(% DAV)
(% 50 day avg vol) |
52 Wk Hi
% From Hi |
Featured
Date |
Price
Featured |
Pivot Featured |
|
Max Buy |
ACT
-
NYSE
Actavis plc
Medical-Generic Drugs
|
$215.77
|
-1.12
-0.52% |
$219.63
|
3,518,260
153.03% of 50 DAV
50 DAV is 2,299,000
|
$230.77
-6.50%
|
6/20/2014
|
$216.53
|
PP = $230.87
|
|
MB = $242.41
|
Most Recent Note - 8/1/2014 5:46:12 PM
Y - Found support at its 50 DMA line today while posting a solid volume-driven gain. Perched -6% off its 52-week high. Subsequent volume-driven gains to new highs may trigger a technical buy signal.
>>> FEATURED STOCK ARTICLE : Disciplined Investors Still Awaiting Technical Breakout - 7/16/2014
View all notes |
Set NEW NOTE alert |
CANSLIM.net Company Profile |
SEC
News |
Chart |
Request a new note
C
A N
S L
I M


|
AFSI
-
NASDAQ
Amtrust Financial Svcs
INSURANCE - Property and; Casualty Insurance
|
$43.25
|
+0.68
1.60% |
$43.36
|
452,917
79.32% of 50 DAV
50 DAV is 571,000
|
$47.10
-8.17%
|
5/21/2014
|
$44.85
|
PP = $44.85
|
|
MB = $47.09
|
 Most Recent Note - 8/4/2014 5:34:37 PM
G - Consolidating just above its 50 DMA line, still facing resistance due to overhead supply up through the $47 level.
>>> FEATURED STOCK ARTICLE : 50-Day Moving Average Line Acted as Recent Resistance - 7/23/2014
View all notes |
Set NEW NOTE alert |
CANSLIM.net Company Profile |
SEC
News |
Chart |
Request a new note
C
A N
S L
I M
|
BITA
-
NYSE
Bitauto Hldgs Ltd Ads
Internet-Content
|
$59.87
|
+3.04
5.35% |
$60.56
|
1,692,449
187.43% of 50 DAV
50 DAV is 903,000
|
$58.50
2.34%
|
6/26/2014
|
$46.20
|
PP = $47.03
|
|
MB = $49.38
|
Most Recent Note - 8/4/2014 12:10:19 PM
G - Hitting a new 52-week high with today's volume-driven gain, getting more extended from its prior base. Its 50 DMA line ($47.63) defines important near-term support to watch on pullbacks.
>>> FEATURED STOCK ARTICLE : Strength Returned After Shake-Out and Positive Reversal - 7/21/2014
View all notes |
Set NEW NOTE alert |
CANSLIM.net Company Profile |
SEC
News |
Chart |
Request a new note
C
A N
S L
I M
|
BWLD
-
NASDAQ
Buffalo Wild Wings Inc
LEISURE - Restaurants
|
$145.59
|
-0.67
-0.46% |
$147.01
|
403,705
80.61% of 50 DAV
50 DAV is 500,800
|
$167.64
-13.15%
|
6/19/2014
|
$158.52
|
PP = $159.91
|
|
MB = $167.91
|
Most Recent Note - 8/4/2014 5:31:14 PM
Holding its ground near its 200 DMA line which may act as support. Faces resistance due to overhead supply and its RS rating has slumped below 80+ guideline. See the latest FSU analysis for more details and new annotated graphs.
>>> FEATURED STOCK ARTICLE : Damaging Gap Down Hurt Technical Stance - 8/4/2014
View all notes |
Set NEW NOTE alert |
CANSLIM.net Company Profile |
SEC
News |
Chart |
Request a new note
C
A N
S L
I M
|
EQM
-
NYSE
E Q T Midstream Partners
ENERGY - Oil and Gas Pipelines
|
$87.41
|
+3.53
4.21% |
$88.16
|
201,585
59.29% of 50 DAV
50 DAV is 340,000
|
$102.51
-14.73%
|
12/12/2013
|
$53.17
|
PP = $56.51
|
|
MB = $59.34
|
Most Recent Note - 8/4/2014 5:33:00 PM
G - Gain today with light volume halted a streak of 4 losses after violating its 50 DMA line. Reported earnings +37% on +21% sales revenues for the Jun '14 quarter, an improvement after 2 sub par quarterly earnings comparisons.
>>> FEATURED STOCK ARTICLE : Volume Totals Cooling While Consolidating Near Highs - 7/17/2014
View all notes |
Set NEW NOTE alert |
CANSLIM.net Company Profile |
SEC
News |
Chart |
Request a new note
C
A N
S L
I M
|
Symbol/Exchange
Company Name
Industry Group |
PRICE |
CHANGE
(%Change) |
Day High |
Volume
(% DAV)
(% 50 day avg vol) |
52 Wk Hi
% From Hi |
Featured
Date |
Price
Featured |
Pivot Featured |
|
Max Buy |
FB
-
NASDAQ
Facebook Inc Cl A
INTERNET
|
$73.51
|
+1.15
1.59% |
$73.88
|
30,628,993
69.00% of 50 DAV
50 DAV is 44,389,000
|
$76.74
-4.21%
|
7/24/2014
|
$76.00
|
PP = $72.69
|
|
MB = $76.32
|
Most Recent Note - 7/30/2014 5:47:33 PM
Y - Holding its ground stubbornly near its 52-week high, above its pivot point and below its "max buy" level. Highlighted in yellow in the 7/24/14 mid-day report (read here) as a "breakaway gap" followed strong earnings news for the Jun '14 quarter and it triggered a technical buy signal.
>>> FEATURED STOCK ARTICLE : Breakaway Gap May Signal Beginning of Meaningful Rally - 7/24/2014
View all notes |
Set NEW NOTE alert |
CANSLIM.net Company Profile |
SEC
News |
Chart |
Request a new note
C
A N
S L
I M
|
ICON
-
NASDAQ
Iconix Brand Group Inc
CONSUMER NON-DURABLES - Textile - Apparel Footwear
|
$42.08
|
+0.06
0.14% |
$42.23
|
377,294
82.04% of 50 DAV
50 DAV is 459,900
|
$44.81
-6.09%
|
6/5/2014
|
$43.54
|
PP = $43.44
|
|
MB = $45.61
|
Most Recent Note - 7/31/2014 6:37:19 PM
G - Reported earnings +4% on +3% sales revenues for the Jun '14 quarter, below the +25% minimum earnings guideline (C criteria) raising fundamental concerns. Recent "negative reversal" as 50 DMA line acted as resistance and Relative Strength rating fell below 80+ minimum guideline. See latest FSU analysis for more details and new annotated graphs.
>>> FEATURED STOCK ARTICLE : Fundamental and Technical Deterioration Hurts Outlook - 7/31/2014
View all notes |
Set NEW NOTE alert |
CANSLIM.net Company Profile |
SEC
News |
Chart |
Request a new note
C
A N
S L
I M
|
PANW
-
NYSE
Palo Alto Networks
Computer Sftwr-Security
|
$80.24
|
+1.57
2.00% |
$80.50
|
910,207
50.65% of 50 DAV
50 DAV is 1,797,000
|
$85.78
-6.46%
|
7/30/2014
|
$84.21
|
PP = $85.88
|
|
MB = $90.17
|
Most Recent Note - 7/31/2014 3:57:54 PM
Y - Pulling back from its 52-week high with a loss today on below average volume. Color code was changed to yellow with new pivot point cited based on its 6/30/14 high plus 10 cents while building on a short flat base. Subsequent volume-driven gains to new high territory may trigger a new (or add-on) technical buy signal. Its 50 DMA line and prior highs define important support where subsequent violations would raise serious concerns and trigger technical sell signals.
>>> FEATURED STOCK ARTICLE : Found Support Above 50-Day Average Near Prior Highs - 7/22/2014
View all notes |
Set NEW NOTE alert |
CANSLIM.net Company Profile |
SEC
News |
Chart |
Request a new note
C
A N
S L
I M
|
TARO
-
NYSE
Taro Pharmaceutical Inds
DRUGS - Drug Manufacturers - Other
|
$142.53
|
-1.63
-1.13% |
$145.58
|
47,628
67.08% of 50 DAV
50 DAV is 71,000
|
$149.89
-4.91%
|
7/30/2014
|
$144.24
|
PP = $149.99
|
|
MB = $157.49
|
Most Recent Note - 7/30/2014 1:08:02 PM
Y - Color code is changed to yellow with new pivot point cited based on its 7/14/14 high while building on an advanced "3-weeks tight" base. Subsequent volume-driven gains to new highs may trigger a new (or add-on) buy signal. Tallying a volume-driven gain today.
>>> FEATURED STOCK ARTICLE : Big Gains in First 2-3 Weeks After Breakout an Encouraging Sign - 7/18/2014
View all notes |
Set NEW NOTE alert |
CANSLIM.net Company Profile |
SEC
News |
Chart |
Request a new note
C
A N
S L
I M
|
TRN
-
NYSE
Trinity Industries Inc
TRANSPORTATION - Railroads
|
$43.83
|
-0.10
-0.23% |
$44.14
|
2,353,816
76.35% of 50 DAV
50 DAV is 3,083,000
|
$47.83
-8.36%
|
4/30/2014
|
$37.79
|
PP = $38.03
|
|
MB = $39.93
|
Most Recent Note - 7/31/2014 3:54:48 PM
G - Gapped down today for a volume-driven loss, retreating from its 52-week high and testing its 50 DMA line ($43.19) which defines important near-term support. A damaging violation would raise concerns and trigger a technical sell signal. Reported earnings +91% on +39% sales for the Jun '14 quarter.
>>> FEATURED STOCK ARTICLE : Earnings News Due Following Tuesday's Close - 7/28/2014
View all notes |
Set NEW NOTE alert |
CANSLIM.net Company Profile |
SEC
News |
Chart |
Request a new note
C
A N
S L
I M
|
Symbol/Exchange
Company Name
Industry Group |
PRICE |
CHANGE
(%Change) |
Day High |
Volume
(% DAV)
(% 50 day avg vol) |
52 Wk Hi
% From Hi |
Featured
Date |
Price
Featured |
Pivot Featured |
|
Max Buy |
UA
-
NYSE
Under Armour Inc Cl A
CONSUMER NON-DURABLES - Textile - Apparel Clothing
|
$68.28
|
+0.84
1.25% |
$68.64
|
1,726,390
61.48% of 50 DAV
50 DAV is 2,808,000
|
$70.94
-3.75%
|
7/10/2014
|
$58.50
|
PP = $60.79
|
|
MB = $63.83
|
Most Recent Note - 7/31/2014 3:56:28 PM
G - Pulling back today with higher volume, enduring distributional pressure. Recently reported earnings +0% on +34% sales revenues for the Jun '14 quarter, below the +25% minimum earnings guideline (C criteria), yet the company raised its guidance.
>>> FEATURED STOCK ARTICLE : Bullish Action Despite Latest Earnings Below +25% Minimum Guideline - 7/30/2014
View all notes |
Set NEW NOTE alert |
CANSLIM.net Company Profile |
SEC
News |
Chart |
Request a new note
C
A N
S L
I M
|
WLK
-
NYSE
Westlake Chemical Corp
CHEMICALS - Specialty Chemicals
|
$89.27
|
+1.53
1.74% |
$89.42
|
514,199
90.69% of 50 DAV
50 DAV is 567,000
|
$91.97
-2.94%
|
4/29/2014
|
$72.79
|
PP = $69.31
|
|
MB = $72.78
|
Most Recent Note - 7/30/2014 5:42:51 PM
G - Pulled back with above average volume today, retreating from its 52-week high after getting extended from any sound base pattern. Its 50 DMA line defines important near-term support to watch on pullbacks.
>>> FEATURED STOCK ARTICLE : Extended From Prior Base After Streak of 8 Consecutive Gains - 7/25/2014
View all notes |
Set NEW NOTE alert |
CANSLIM.net Company Profile |
SEC
News |
Chart |
Request a new note
C
A N
S L
I M
|
|
|
|
THESE ARE NOT BUY RECOMMENDATIONS!
Comments contained in the body of this report are technical
opinions only. The material herein has been obtained
from sources believed to be reliable and accurate, however,
its accuracy and completeness cannot be guaranteed.
This site is not an investment advisor, hence it does
not endorse or recommend any securities or other investments.
Any recommendation contained in this report may not
be suitable for all investors and it is not to be deemed
an offer or solicitation on our part with respect to
the purchase or sale of any securities. All trademarks,
service marks and trade names appearing in this report
are the property of their respective owners, and are
likewise used for identification purposes only.
This report is a service available
only to active Paid Premium Members.
You may opt-out of receiving report notifications
at any time. Questions or comments may be submitted
by writing to Premium Membership Services 665 S.E. 10 Street, Suite 201 Deerfield Beach, FL 33441-5634 or by calling 1-800-965-8307
or 954-785-1121.
|
|
|

