You are not logged in.
This means you
CAN ONLY VIEW reports that were published prior to Sunday, October 27, 2024.
You
MUST UPGRADE YOUR MEMBERSHIP if you want to see any current reports.
AFTER MARKET UPDATE - TUESDAY, AUGUST 3RD, 2010
Previous After Market Report Next After Market Report >>>
|
|
|
|
DOW |
-38.00 |
10,636.38 |
-0.36% |
|
Volume |
1,000,511,020 |
-3% |
|
Volume |
1,955,330,380 |
+3% |
|
NASDAQ |
-11.84 |
2,283.52 |
-0.52% |
|
Advancers |
1,184 |
38% |
|
Advancers |
952 |
34% |
|
S&P 500 |
-5.40 |
1,120.46 |
-0.48% |
|
Decliners |
1,840 |
59% |
|
Decliners |
1,718 |
62% |
|
Russell 2000 |
-6.20 |
655.66 |
-0.94% |
|
52 Wk Highs |
214 |
|
|
52 Wk Highs |
64 |
|
|
S&P 600 |
-3.95 |
350.39 |
-1.11% |
|
52 Wk Lows |
7 |
|
|
52 Wk Lows |
33 |
|
|
 |
Nasdaq's Loss on Higher Volume Indicates Distributional Pressure
Adam Sarhan, Contributing Writer,
Stocks pulled back to consolidate Monday's move as investors digested a series of lackluster economic and earnings data. Volume totals were reportedly mixed; lower on the NYSE, yet higher on the Nasdaq exchange which marked a distribution day for the tech-heavy index. Decliners led advancers by a 3-to-2 ratio and the NYSE and on the Nasdaq exchange. New 52-week highs easily outnumbered new 52-week lows on the NYSE and the Nasdaq exchange. There were 27 high-ranked companies from the CANSLIM.net Leaders List that made a new 52-week high and appeared on the CANSLIM.net BreakOuts Page, down considerably from the 57 issues that appeared on the prior session.
The market digested a slew of weaker than expected economic data ranging from the ailing housing market to the US consumer. The National Association of Realtors said pending home resales in the US unexpectedly fell -2.6% from the prior month. Much of the decline was due to waning demand after the government tax credit expired. The report fell short of the Street's estimates for a gain of +4%. Meanwhile, a separate report showed that factory orders slid -1.2% in June, which doubled the decline analysts' expected. Finally, the Commerce Department said consumer spending was unchanged after a +0.1% gain in the prior month. The report also showed that US incomes did not increase for the first time since September 2009 while the savings rate jumped to the highest level in a year.
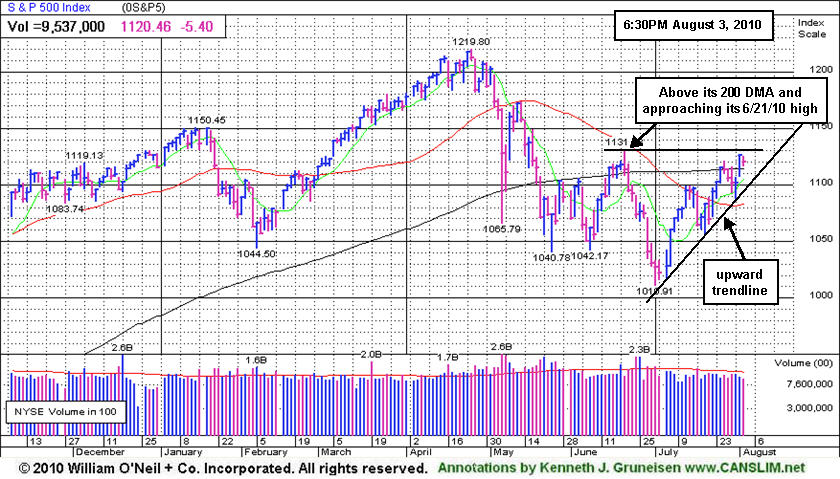
At this point, the Dow Jones Industrial Average and the NYSE Composite Index have traded above resistance at their long term 200-day moving average (DMA) lines and recent chart highs. The tech-heavy Nasdaq Composite and small-cap Russell 2000 index remain slightly below their recent chart highs. However, the fact that all of the major averages are trading above their respective 2-month downward trendlines bodes well for this five week rally. In order for a new leg higher to begin, all the major averages must close and remain above their respective resistance levels. Remember that the window remains open for for high-ranked stocks to be accumulated when they trigger fresh technical buy signals. Trade accordingly.
PICTURED: The benchmark S&P 500 Index has been approaching its June 21, 2010 high after rallying above its 200 DMA line. Lighter than average volume has been behind all of its gains in recent weeks since its low of 1,010.91 on July 1, 2010. Sunsequent gains with greater volume conviction would be a reassuring sign of growing buying demand from the institutional crowd.
|
|
|
 |
Retail and Financial Indexes Among Decliners
Kenneth J. Gruneisen - Passed the CAN SLIM® Master's Exam
Weakness in the influential Retail Index ($RLX -1.91%) and losses for the Bank Index ($BKX -1.30%) and Broker/Dealer Index ($XBD -0.94%) created a drag on the major average on Tuesday. The Oil Services Index ($OSX -1.20%) ended lower while Integrated Oil Index ($XOI +0.37%) edged higher. Healthcare Index ($HMO +1.49%) rose and there were modest gains from the Biotechnology Index ($BTK +0.39%) and the Networking Index ($NWX +0.52%), meanwhile the Internet Index ($IIX -0.16%) edged lower and the Semiconductor Index ($SOX -1.04%) was the tech sector's worst laggard. The Gold & Silver Index ($XAU +0.04%) held its ground.
Charts courtesy www.stockcharts.com
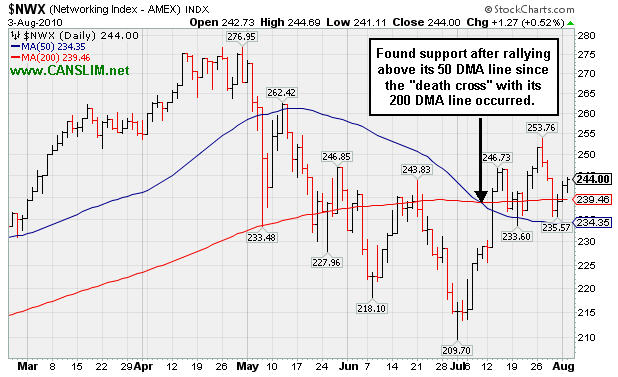
PICTURED: The Networking Index ($NWX +0.52%) found support after rallying above its 50 DMA line since the "death cross" with its 200 DMA occurred.
| Oil Services |
$OSX |
187.44 |
-2.28 |
-1.20% |
-3.84% |
| Healthcare |
$HMO |
1,522.59 |
+22.29 |
+1.49% |
+3.37% |
| Integrated Oil |
$XOI |
1,017.75 |
+3.80 |
+0.37% |
-4.72% |
| Semiconductor |
$SOX |
351.25 |
-3.69 |
-1.04% |
-2.41% |
| Networking |
$NWX |
244.00 |
+1.27 |
+0.52% |
+5.60% |
| Internet |
$IIX |
246.52 |
-0.40 |
-0.16% |
+5.41% |
| Broker/Dealer |
$XBD |
108.22 |
-1.02 |
-0.94% |
-5.93% |
| Retail |
$RLX |
405.67 |
-7.92 |
-1.91% |
-1.33% |
| Gold & Silver |
$XAU |
170.25 |
+0.06 |
+0.04% |
+1.19% |
| Bank |
$BKX |
49.52 |
-0.65 |
-1.30% |
+15.94% |
| Biotech |
$BTK |
1,087.09 |
+4.25 |
+0.39% |
+15.39% |
|
|
|
 |
Throwing Thoratec's Recent Action Under More Light
Kenneth J. Gruneisen - Passed the CAN SLIM® Master's Exam
Keep in mind that the latest notes for companies listed on the Featured Stocks page are published in each daily After Market Update, and in addition, the "Alert me of new notes" link/feature allows active members to immediately opt-in to receive email copies of the latest notes from our experts as soon as they are published. May it serve as an educational example of multiple warning signs to look back and review the recent notes that were published concerning the price/volume action in a company that will be dropped from the Featured Stocks list tonight.
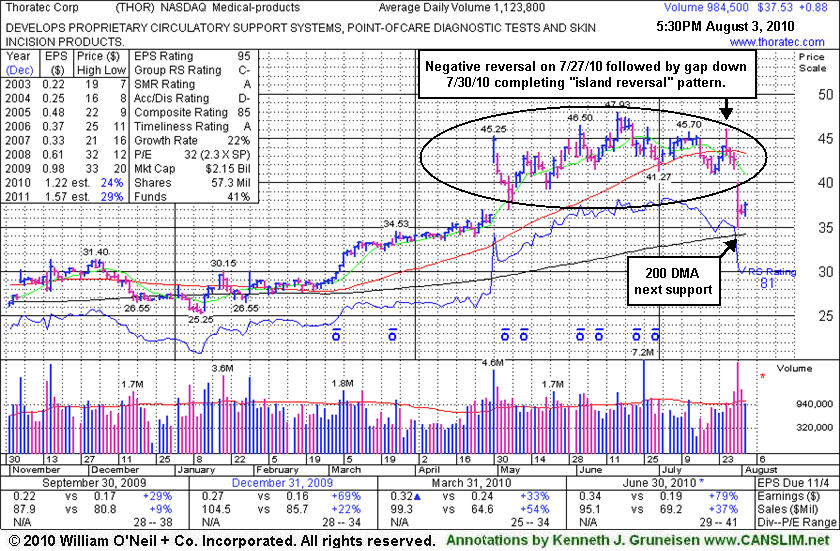
Thoratec Corp (THOR +$0.88 or +2.40% to $37.53) posted a small gain today on lighter volume. It will be dropped from the Featured Stocks list tonight. It faces a lot of overhead supply since the previously noted damaging gap down on 7/30/10 triggered technical sell signals. Its chart now shows a worrisome "island reversal" type pattern. The negative reversal on 7/27/10 also stands out on its chart today as an ominous sign prior to the more serious technical damage that came. Market technicians may expect its upward price progress to likely be hindered now by selling pressure as investors who accumulated shares while trading at higher levels in recent months look for a chance to exit at better prices. Meanwhile, its 200-day moving average (DMA) line may serve as the next support level.
In its last FSU appearance on 7/16/10 under the headline "Short-Term Average - Important Support Level Put Test " after violating its 50-day moving average line it was noted - "Its recent low ($41.27 on 7/01/10) defines the next important chart support level to watch now."
7/21/10 - Closed at the session low today and concerns have increased due to technical damage. A streak of 4 consecutive losses with below average volume included violations of its 50 DMA line and prior chart low. A prompt rebound above its short-term average would help its outlook, meanwhile the path of least resistance may lead this high-ranked Medical Products firm lower.
7/26/10 - This high-ranked Medical Products firm posted a 3rd consecutive gain on light volume and closed above its 50 DMA line today. Earnings news is due after the close on Thursday 7/29/10. Color code is changed to yellow as the prompt rebound above its short-term average, after briefly undercutting its prior chart low, helped its outlook improve.
7/28/10 - This high-ranked Medical Products has slumped under its 50 DMA line, and its color code is changed to green again. It has not produced a constructive gain with above average volume since peaking on 6/16/10. Earnings news is due after the close on Thursday 7/29/10.
|
|
|
Color Codes Explained :
Y - Better candidates highlighted by our
staff of experts.
G - Previously featured
in past reports as yellow but may no longer be buyable under the
guidelines.
***Last / Change / Volume data in this table is the closing quote data***
Symbol/Exchange
Company Name
Industry Group |
PRICE |
CHANGE
(%Change) |
Day High |
Volume
(% DAV)
(% 50 day avg vol) |
52 Wk Hi
% From Hi |
Featured
Date |
Price
Featured |
Pivot Featured |
|
Max Buy |
AAPL
-
NASDAQ
Apple Inc
COMPUTER HARDWARE - Personal Computers
|
$261.93
|
+0.08
0.03% |
$263.26
|
14,875,383
53.45% of 50 DAV
50 DAV is 27,833,000
|
$279.01
-6.12%
|
6/17/2010
|
$270.95
|
PP = $272.56
|
|
MB = $286.19
|
Most Recent Note - 7/30/2010 2:52:40 PM
Y - Quietly consolidating near its 50 DMA line, it has been 6 weeks since its negative reversal on 6/21/10 at its all-time high. Recent chart low ($239) defines an important support level.
>>> The latest Featured Stock Update with an annotated graph appeared on 7/12/2010. Click here.
View all notes |
Alert me of new notes |
CANSLIM.net Company Profile |
SEC |
Zacks Reports |
StockTalk |
News |
Chart |
Request a new note
C
A N
S L
I M


|
ABV
-
NYSE
Comp De Bebidas Adr
FOOD and BEVERAGE - Beverages - Brewers
|
$108.70
|
-0.55
-0.50% |
$109.49
|
818,120
114.57% of 50 DAV
50 DAV is 714,100
|
$112.60
-3.46%
|
6/29/2010
|
$104.74
|
PP = $109.33
|
|
MB = $114.80
|
Most Recent Note - 8/2/2010 12:16:21 PM
Y - After gapping up and reaching a new 52-week high it has reversed into the red, which is considered distributional action. This Brazil-based beverage firm is holding its ground while churning a lot of volume today. It found support near its 50 DMA line but did not trigger convincing technical breakout since it was featured in the 6/29/10 mid-day report.
>>> The latest Featured Stock Update with an annotated graph appeared on 7/20/2010. Click here.
View all notes |
Alert me of new notes |
CANSLIM.net Company Profile |
SEC |
Zacks Reports |
StockTalk |
News |
Chart |
Request a new note
C
A N
S L
I M
|
BIDU
-
NASDAQ
Baidu Inc Ads
INTERNET - Internet Information Providers
|
$84.79
|
+0.19
0.22% |
$85.35
|
10,130,832
82.83% of 50 DAV
50 DAV is 12,231,000
|
$84.98
-0.22%
|
7/14/2010
|
$75.03
|
PP = $78.59
|
|
MB = $82.52
|
Most Recent Note - 8/2/2010 2:52:31 PM
Y - Gapped up today and hit a new all-time high while rallying above its "max buy" level, yet the volume total is not especially high behind its gain thus far. Recent gains above prior highs in the $78 area lacked great volume conviction, however no overhead supply remains to act as resistance.
>>> The latest Featured Stock Update with an annotated graph appeared on 7/14/2010. Click here.
View all notes |
Alert me of new notes |
CANSLIM.net Company Profile |
SEC |
Zacks Reports |
StockTalk |
News |
Chart |
Request a new note
C
A N
S L
I M
|
CACC
-
NASDAQ
Credit Acceptance Corp
FINANCIAL SERVICES - Credit Services
|
$55.03
|
-0.96
-1.71% |
$56.42
|
33,163
68.52% of 50 DAV
50 DAV is 48,400
|
$56.67
-2.89%
|
7/29/2010
|
$52.04
|
PP = $54.07
|
|
MB = $56.77
|
Most Recent Note - 8/2/2010 4:44:28 PM
Y - Held its ground today at all-time highs above its pivot point and below its "max buy" level. Its 7/30/10 gain with more than twice average volume helped it trade above its pivot point and trigger a technical buy signal. Due to report earnings on Tuesday, August 3rd after the close. CACC was featured in the 7/29/10 mid-day report (read here) after quietly reaching new high territory.
>>> The latest Featured Stock Update with an annotated graph appeared on 8/2/2010. Click here.
View all notes |
Alert me of new notes |
CANSLIM.net Company Profile |
SEC |
Zacks Reports |
StockTalk |
News |
Chart |
Request a new note
C
A N
S L
I M
|
CRM
-
NYSE
Salesforce.Com Inc
INTERNET - Internet Software and Services
|
$101.01
|
-0.90
-0.88% |
$101.96
|
1,284,965
45.95% of 50 DAV
50 DAV is 2,796,200
|
$102.49
-1.44%
|
6/2/2010
|
$88.44
|
PP = $89.60
|
|
MB = $94.08
|
Most Recent Note - 8/2/2010 3:55:28 PM
G - Gapped up today and hit a new 52-week high with light volume behind its gain. It stubbornly held its ground above prior highs near $97 after recently rising from a choppy 7-week base with a gain on 7/23/10 backed by near average volume.
>>> The latest Featured Stock Update with an annotated graph appeared on 7/15/2010. Click here.
View all notes |
Alert me of new notes |
CANSLIM.net Company Profile |
SEC |
Zacks Reports |
StockTalk |
News |
Chart |
Request a new note
C
A N
S L
I M
|
Symbol/Exchange
Company Name
Industry Group |
PRICE |
CHANGE
(%Change) |
Day High |
Volume
(% DAV)
(% 50 day avg vol) |
52 Wk Hi
% From Hi |
Featured
Date |
Price
Featured |
Pivot Featured |
|
Max Buy |
DTSI
-
NASDAQ
D T S Inc
CONSUMER DURABLES - Electronic Equipment
|
$36.97
|
+0.94
2.61% |
$37.53
|
194,473
195.65% of 50 DAV
50 DAV is 99,400
|
$37.50
-1.41%
|
7/27/2010
|
$37.00
|
PP = $36.28
|
|
MB = $38.09
|
 Most Recent Note - 8/3/2010 2:59:06 PM
Y - Considerable gain with above average volume helped it rise above its pivot point and touch a new 52-week high this afternoon. It found support above prior highs in the $35-36 area after its 7/23/10 gain with above average volume triggered a technical buy signal and it was featured in yellow in the 7/27/10 mid-day report (read here). It will report earnings after the close on Monday, August 9th, and Street estimates calling for lower FY '10 earnings have been noted as a concern.
>>> The latest Featured Stock Update with an annotated graph appeared on 7/27/2010. Click here.
View all notes |
Alert me of new notes |
CANSLIM.net Company Profile |
SEC |
Zacks Reports |
StockTalk |
News |
Chart |
Request a new note
C
A N
S L
I M
|
FFIV
-
NASDAQ
F 5 Networks Inc
INTERNET - Internet Software and Services
|
$88.59
|
-0.01
-0.01% |
$89.27
|
1,097,346
60.08% of 50 DAV
50 DAV is 1,826,600
|
$90.25
-1.84%
|
6/16/2010
|
$74.50
|
PP = $74.10
|
|
MB = $77.81
|
Most Recent Note - 8/2/2010 4:49:14 PM
G - Second consecutive gain today for another new 52-week high. Extended from any sound base after recent volume-driven gains. It could go on to produce more climactic gains, and disciplined investors may watch for a secondary buy point to develop.
>>> The latest Featured Stock Update with an annotated graph appeared on 7/7/2010. Click here.
View all notes |
Alert me of new notes |
CANSLIM.net Company Profile |
SEC |
Zacks Reports |
StockTalk |
News |
Chart |
Request a new note
C
A N
S L
I M
|
MELI
-
NASDAQ
Mercadolibre Inc
INTERNET - Internet Software and; Services
|
$62.26
|
+1.92
3.18% |
$62.53
|
1,033,712
107.80% of 50 DAV
50 DAV is 958,900
|
$65.99
-5.65%
|
5/13/2010
|
$54.21
|
PP = $55.85
|
|
MB = $58.64
|
Most Recent Note - 8/3/2010 3:04:29 PM
G - Today's gain follows 5 consecutive losses, making a stand near prior chart highs in the $62 area. It has been consolidating after a gap up gain on 7/26/10.
>>> The latest Featured Stock Update with an annotated graph appeared on 7/23/2010. Click here.
View all notes |
Alert me of new notes |
CANSLIM.net Company Profile |
SEC |
Zacks Reports |
StockTalk |
News |
Chart |
Request a new note
C
A N
S L
I M
|
MWIV
-
NASDAQ
M W I Veterinary Supply
HEALTH SERVICES - Medical Instruments and; Supplies
|
$53.10
|
-0.12
-0.23% |
$53.70
|
63,094
89.62% of 50 DAV
50 DAV is 70,400
|
$54.48
-2.53%
|
7/29/2010
|
$52.05
|
PP = $52.09
|
|
MB = $54.69
|
Most Recent Note - 8/2/2010 4:55:28 PM
Y - Gapped up for a gain today with above average volume for its second best close ever. Rallied above its pivot point and finished strong after it was featured in the 7/29/10 mid-day report (read here).
>>> The latest Featured Stock Update with an annotated graph appeared on 7/30/2010. Click here.
View all notes |
Alert me of new notes |
CANSLIM.net Company Profile |
SEC |
Zacks Reports |
StockTalk |
News |
Chart |
Request a new note
C
A N
S L
I M
|
NEM
-
NYSE
Newmont Mining Corp
METALS and MINING - Gold
|
$55.47
|
-0.13
-0.23% |
$56.16
|
5,999,110
67.57% of 50 DAV
50 DAV is 8,878,300
|
$63.38
-12.48%
|
6/22/2010
|
$59.60
|
PP = $59.67
|
|
MB = $62.65
|
Most Recent Note - 7/30/2010 4:19:13 PM
G - Gains on light volume have followed damaging distributional losses including its gap down on 7/27/10. Technically, a rebound above its 50 DMA line would help its outlook improve.
>>> The latest Featured Stock Update with an annotated graph appeared on 7/9/2010. Click here.
View all notes |
Alert me of new notes |
CANSLIM.net Company Profile |
SEC |
Zacks Reports |
StockTalk |
News |
Chart |
Request a new note
C
A N
S L
I M
|
Symbol/Exchange
Company Name
Industry Group |
PRICE |
CHANGE
(%Change) |
Day High |
Volume
(% DAV)
(% 50 day avg vol) |
52 Wk Hi
% From Hi |
Featured
Date |
Price
Featured |
Pivot Featured |
|
Max Buy |
NEOG
-
NASDAQ
Neogen Corp
DRUGS - Diagnostic Substances
|
$29.45
|
-0.25
-0.84% |
$29.84
|
44,378
46.57% of 50 DAV
50 DAV is 95,300
|
$30.39
-3.09%
|
7/22/2010
|
$27.19
|
PP = $27.87
|
|
MB = $29.26
|
Most Recent Note - 7/30/2010 4:28:23 PM
G - Today's gain actually had nearly 2 times average volume as it rallied for a new 52-week high above "max buy" level. It was featured in the 7/22/10 mid-day report (read here).
>>> The latest Featured Stock Update with an annotated graph appeared on 7/22/2010. Click here.
View all notes |
Alert me of new notes |
CANSLIM.net Company Profile |
SEC |
Zacks Reports |
StockTalk |
News |
Chart |
Request a new note
C
A N
S L
I M
|
NETL
-
NASDAQ
Netlogic Microsystems
ELECTRONICS - Semiconductor - Memory Chips
|
$29.47
|
-0.44
-1.47% |
$29.98
|
1,410,014
102.52% of 50 DAV
50 DAV is 1,375,300
|
$35.00
-15.80%
|
7/28/2010
|
$33.44
|
PP = $35.10
|
|
MB = $36.86
|
Most Recent Note - 8/3/2010 3:26:41 PM
G - Slumping near its 50 DMA line today after making a stand near that important short-term average. Following a damaging 7/29/10 loss, any deterioration below its 7/30/10 low ($28.27) would raise more serious concerns. It was featured in the 7/28/10 mid-day report in yellow (read here).
>>> The latest Featured Stock Update with an annotated graph appeared on 7/28/2010. Click here.
View all notes |
Alert me of new notes |
CANSLIM.net Company Profile |
SEC |
Zacks Reports |
StockTalk |
News |
Chart |
Request a new note
C
A N
S L
I M
|
ROVI
-
NASDAQ
Rovi Corp
COMPUTER SOFTWARE andamp; SERVICES - Security Software andamp; Services
|
$42.04
|
-1.41
-3.25% |
$43.45
|
1,619,914
124.45% of 50 DAV
50 DAV is 1,301,700
|
$44.96
-6.49%
|
6/3/2010
|
$38.70
|
PP = $40.16
|
|
MB = $42.17
|
Most Recent Note - 8/3/2010 3:31:51 PM
G - Pulling back for a second consecutive session today, it has erased most of its 7/30/10 gap up gain and quietly slumped near its "max buy" level. Support is defined by highs in the $40 area and its 50 DMA line.
>>> The latest Featured Stock Update with an annotated graph appeared on 7/21/2010. Click here.
View all notes |
Alert me of new notes |
CANSLIM.net Company Profile |
SEC |
Zacks Reports |
StockTalk |
News |
Chart |
Request a new note
C
A N
S L
I M
|
THOR
-
NASDAQ
Thoratec Corp
HEALTH SERVICES - Medical Instruments and Supplies
|
$37.53
|
+0.88
2.40% |
$37.82
|
1,055,026
94.86% of 50 DAV
50 DAV is 1,112,200
|
$47.93
-21.70%
|
6/3/2010
|
$44.38
|
PP = $45.35
|
|
MB = $47.62
|
Most Recent Note - 8/3/2010 3:10:19 PM
G - Small gain today on lighter volume. It will be dropped from the Featured Stocks list tonight. It faces a lot of overhead supply since the previously noted damaging gap down on 7/30/10 triggered technical sell signals.
>>> The latest Featured Stock Update with an annotated graph appeared on 8/3/2010. Click here.
View all notes |
Alert me of new notes |
CANSLIM.net Company Profile |
SEC |
Zacks Reports |
StockTalk |
News |
Chart |
Request a new note
C
A N
S L
I M
|
ULTA
-
NASDAQ
Ulta Salon Cosm & Frag
SPECIALTY RETAIL - Specialty Retail, Other
|
$25.33
|
-0.10
-0.39% |
$25.49
|
478,536
66.16% of 50 DAV
50 DAV is 723,300
|
$26.75
-5.31%
|
5/28/2010
|
$25.58
|
PP = $25.86
|
|
MB = $27.15
|
Most Recent Note - 8/2/2010 4:59:27 PM
G - Holding its ground since a gap up for a solid gain with better than average volume on 7/29/10. Prior lows in the $22 area define the next support level just above its 200 DMA line.
>>> The latest Featured Stock Update with an annotated graph appeared on 7/19/2010. Click here.
View all notes |
Alert me of new notes |
CANSLIM.net Company Profile |
SEC |
Zacks Reports |
StockTalk |
News |
Chart |
Request a new note
C
A N
S L
I M
|
Symbol/Exchange
Company Name
Industry Group |
PRICE |
CHANGE
(%Change) |
Day High |
Volume
(% DAV)
(% 50 day avg vol) |
52 Wk Hi
% From Hi |
Featured
Date |
Price
Featured |
Pivot Featured |
|
Max Buy |
VIT
-
NYSE
Vanceinfo Tech Inc Ads
COMPUTER SOFTWARE and SERVICES - Business Software and Services
|
$26.60
|
-0.27
-1.00% |
$27.10
|
322,044
57.11% of 50 DAV
50 DAV is 563,900
|
$27.59
-3.59%
|
7/8/2010
|
$25.20
|
PP = $26.58
|
|
MB = $27.91
|
Most Recent Note - 8/2/2010 5:04:29 PM
Y - Gapped up today and closed near the session high with a considerable gain on lighter than average volume. After holding its ground near June highs it quietly rose above the pivot point cited in prior reports. Color code was changed to yellow again based on its resilience. Its 7/19/10 low ($23.78) defines near-term support above its 50 DMA line.
>>> The latest Featured Stock Update with an annotated graph appeared on 7/26/2010. Click here.
View all notes |
Alert me of new notes |
CANSLIM.net Company Profile |
SEC |
Zacks Reports |
StockTalk |
News |
Chart |
Request a new note
C
A N
S L
I M
|
|
|
|
THESE ARE NOT BUY RECOMMENDATIONS!
Comments contained in the body of this report are technical
opinions only. The material herein has been obtained
from sources believed to be reliable and accurate, however,
its accuracy and completeness cannot be guaranteed.
This site is not an investment advisor, hence it does
not endorse or recommend any securities or other investments.
Any recommendation contained in this report may not
be suitable for all investors and it is not to be deemed
an offer or solicitation on our part with respect to
the purchase or sale of any securities. All trademarks,
service marks and trade names appearing in this report
are the property of their respective owners, and are
likewise used for identification purposes only.
This report is a service available
only to active Paid Premium Members.
You may opt-out of receiving report notifications
at any time. Questions or comments may be submitted
by writing to Premium Membership Services 665 S.E. 10 Street, Suite 201 Deerfield Beach, FL 33441-5634 or by calling 1-800-965-8307
or 954-785-1121.
|
|
|


