***Last / Change / Volume data in this table is the closing quote data***
Symbol/Exchange
Company Name
Industry Group |
PRICE |
CHANGE
(%Change) |
Day High |
Volume
(% DAV)
(% 50 day avg vol) |
52 Wk Hi
% From Hi |
Featured
Date |
Price
Featured |
Pivot Featured |
|
Max Buy |
AAPL
-
NASDAQ
Apple Inc
COMPUTER HARDWARE - Personal Computers
|
$261.85
|
+4.60
1.79% |
$262.59
|
15,233,784
54.73% of 50 DAV
50 DAV is 27,833,000
|
$279.01
-6.15%
|
6/17/2010
|
$270.95
|
PP = $272.56
|
|
MB = $286.19
|
Most Recent Note - 7/30/2010 2:52:40 PM
Y - Quietly consolidating near its 50 DMA line, it has been 6 weeks since its negative reversal on 6/21/10 at its all-time high. Recent chart low ($239) defines an important support level.
>>> The latest Featured Stock Update with an annotated graph appeared on 7/12/2010. Click here.
View all notes |
Alert me of new notes |
CANSLIM.net Company Profile |
SEC |
Zacks Reports |
StockTalk |
News |
Chart |
Request a new note
C
A N
S L
I M


|
ABV
-
NYSE
Comp De Bebidas Adr
FOOD and BEVERAGE - Beverages - Brewers
|
$109.25
|
+0.03
0.03% |
$112.60
|
1,918,339
268.64% of 50 DAV
50 DAV is 714,100
|
$110.68
-1.29%
|
6/29/2010
|
$104.74
|
PP = $109.33
|
|
MB = $114.80
|
 Most Recent Note - 8/2/2010 12:16:21 PM
Y - After gapping up and reaching a new 52-week high it has reversed into the red, which is considered distributional action. This Brazil-based beverage firm is holding its ground while churning a lot of volume today. It found support near its 50 DMA line but did not trigger convincing technical breakout since it was featured in the 6/29/10 mid-day report.
>>> The latest Featured Stock Update with an annotated graph appeared on 7/20/2010. Click here.
View all notes |
Alert me of new notes |
CANSLIM.net Company Profile |
SEC |
Zacks Reports |
StockTalk |
News |
Chart |
Request a new note
C
A N
S L
I M
|
BIDU
-
NASDAQ
Baidu Inc Ads
INTERNET - Internet Information Providers
|
$84.60
|
+3.19
3.92% |
$84.98
|
13,568,125
110.93% of 50 DAV
50 DAV is 12,231,000
|
$82.29
2.81%
|
7/14/2010
|
$75.03
|
PP = $78.59
|
|
MB = $82.52
|
Most Recent Note - 8/2/2010 2:52:31 PM
Y - Gapped up today and hit a new all-time high while rallying above its "max buy" level, yet the volume total is not especially high behind its gain thus far. Recent gains above prior highs in the $78 area lacked great volume conviction, however no overhead supply remains to act as resistance.
>>> The latest Featured Stock Update with an annotated graph appeared on 7/14/2010. Click here.
View all notes |
Alert me of new notes |
CANSLIM.net Company Profile |
SEC |
Zacks Reports |
StockTalk |
News |
Chart |
Request a new note
C
A N
S L
I M
|
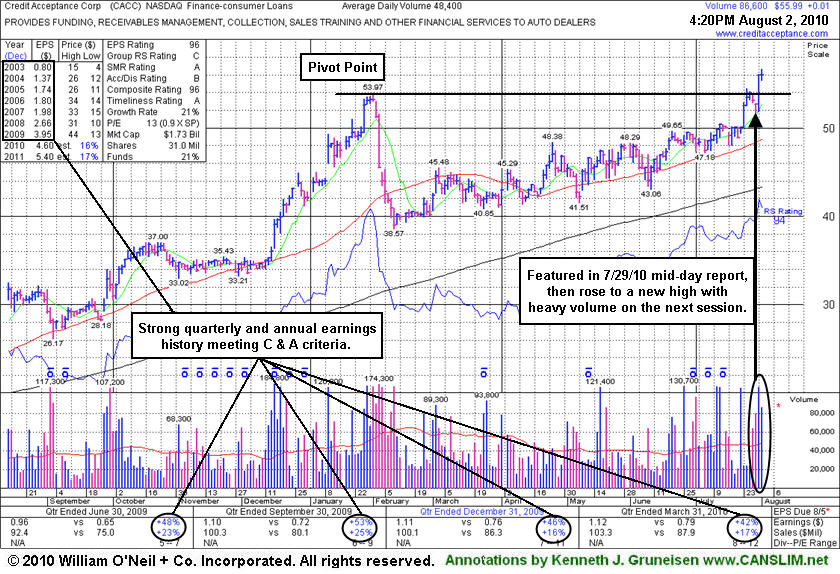
CACC
-
NASDAQ
Credit Acceptance Corp
FINANCIAL SERVICES - Credit Services
|
$55.99
|
+0.01
0.02% |
$56.67
|
86,617
178.96% of 50 DAV
50 DAV is 48,400
|
$56.00
-0.02%
|
7/29/2010
|
$52.04
|
PP = $54.07
|
|
MB = $56.77
|
Most Recent Note - 8/2/2010 4:44:28 PM
Y - Held its ground today at all-time highs above its pivot point and below its "max buy" level. Its 7/30/10 gain with more than twice average volume helped it trade above its pivot point and trigger a technical buy signal. Due to report earnings on Tuesday, August 3rd after the close. CACC was featured in the 7/29/10 mid-day report (read here) after quietly reaching new high territory.
>>> The latest Featured Stock Update with an annotated graph appeared on 8/2/2010. Click here.
View all notes |
Alert me of new notes |
CANSLIM.net Company Profile |
SEC |
Zacks Reports |
StockTalk |
News |
Chart |
Request a new note
C
A N
S L
I M
|
CRM
-
NYSE
Salesforce.Com Inc
INTERNET - Internet Software and Services
|
$101.91
|
+2.96
2.99% |
$102.49
|
1,641,247
58.70% of 50 DAV
50 DAV is 2,796,200
|
$101.49
0.41%
|
6/2/2010
|
$88.44
|
PP = $89.60
|
|
MB = $94.08
|
Most Recent Note - 8/2/2010 3:55:28 PM
G - Gapped up today and hit a new 52-week high with light volume behind its gain. It stubbornly held its ground above prior highs near $97 after recently rising from a choppy 7-week base with a gain on 7/23/10 backed by near average volume.
>>> The latest Featured Stock Update with an annotated graph appeared on 7/15/2010. Click here.
View all notes |
Alert me of new notes |
CANSLIM.net Company Profile |
SEC |
Zacks Reports |
StockTalk |
News |
Chart |
Request a new note
C
A N
S L
I M
|
Symbol/Exchange
Company Name
Industry Group |
PRICE |
CHANGE
(%Change) |
Day High |
Volume
(% DAV)
(% 50 day avg vol) |
52 Wk Hi
% From Hi |
Featured
Date |
Price
Featured |
Pivot Featured |
|
Max Buy |
DTSI
-
NASDAQ
D T S Inc
CONSUMER DURABLES - Electronic Equipment
|
$36.03
|
+0.31
0.87% |
$36.46
|
146,871
147.76% of 50 DAV
50 DAV is 99,400
|
$37.50
-3.92%
|
7/27/2010
|
$37.00
|
PP = $36.28
|
|
MB = $38.09
|
Most Recent Note - 8/2/2010 4:48:07 PM
Y - Gain today with higher volume helped it rise and close near its pivot point. Volume totals had been light while consolidating above prior highs in the $35-36 area after its 7/23/10 gain with above average volume triggered a technical buy signal and it was featured in yellow in the 7/27/10 mid-day report (read here). It will report earnings after the close on Monday, August 9th, and Street estimates calling for lower FY '10 earnings have been noted as a concern.
>>> The latest Featured Stock Update with an annotated graph appeared on 7/27/2010. Click here.
View all notes |
Alert me of new notes |
CANSLIM.net Company Profile |
SEC |
Zacks Reports |
StockTalk |
News |
Chart |
Request a new note
C
A N
S L
I M
|
FFIV
-
NASDAQ
F 5 Networks Inc
INTERNET - Internet Software and Services
|
$88.60
|
+0.77
0.88% |
$90.25
|
2,190,938
119.95% of 50 DAV
50 DAV is 1,826,600
|
$88.34
0.29%
|
6/16/2010
|
$74.50
|
PP = $74.10
|
|
MB = $77.81
|
Most Recent Note - 8/2/2010 4:49:14 PM
G - Second consecutive gain today for another new 52-week high. Extended from any sound base after recent volume-driven gains. It could go on to produce more climactic gains, and disciplined investors may watch for a secondary buy point to develop.
>>> The latest Featured Stock Update with an annotated graph appeared on 7/7/2010. Click here.
View all notes |
Alert me of new notes |
CANSLIM.net Company Profile |
SEC |
Zacks Reports |
StockTalk |
News |
Chart |
Request a new note
C
A N
S L
I M
|
MELI
-
NASDAQ
Mercadolibre Inc
INTERNET - Internet Software and; Services
|
$60.34
|
-0.16
-0.26% |
$62.28
|
937,680
97.79% of 50 DAV
50 DAV is 958,900
|
$65.99
-8.56%
|
5/13/2010
|
$54.21
|
PP = $55.85
|
|
MB = $58.64
|
Most Recent Note - 7/30/2010 5:22:17 PM
G - Today marked its 4th consecutive loss, yet it closed in the upper half of its intra-day range. It has slumped back under prior chart highs in the $62 area after clearing a choppy 6-week consolidation with a gap up gain on 7/26/10.
>>> The latest Featured Stock Update with an annotated graph appeared on 7/23/2010. Click here.
View all notes |
Alert me of new notes |
CANSLIM.net Company Profile |
SEC |
Zacks Reports |
StockTalk |
News |
Chart |
Request a new note
C
A N
S L
I M
|
MWIV
-
NASDAQ
M W I Veterinary Supply
HEALTH SERVICES - Medical Instruments and; Supplies
|
$53.22
|
+0.56
1.06% |
$54.48
|
107,161
152.22% of 50 DAV
50 DAV is 70,400
|
$54.35
-2.08%
|
7/29/2010
|
$52.05
|
PP = $52.09
|
|
MB = $54.69
|
Most Recent Note - 8/2/2010 4:55:28 PM
Y - Gapped up for a gain today with above average volume for its second best close ever. Rallied above its pivot point and finished strong after it was featured in the 7/29/10 mid-day report (read here).
>>> The latest Featured Stock Update with an annotated graph appeared on 7/30/2010. Click here.
View all notes |
Alert me of new notes |
CANSLIM.net Company Profile |
SEC |
Zacks Reports |
StockTalk |
News |
Chart |
Request a new note
C
A N
S L
I M
|
NEM
-
NYSE
Newmont Mining Corp
METALS and MINING - Gold
|
$55.60
|
-0.30
-0.54% |
$56.88
|
6,434,639
72.48% of 50 DAV
50 DAV is 8,878,300
|
$63.38
-12.28%
|
6/22/2010
|
$59.60
|
PP = $59.67
|
|
MB = $62.65
|
Most Recent Note - 7/30/2010 4:19:13 PM
G - Gains on light volume have followed damaging distributional losses including its gap down on 7/27/10. Technically, a rebound above its 50 DMA line would help its outlook improve.
>>> The latest Featured Stock Update with an annotated graph appeared on 7/9/2010. Click here.
View all notes |
Alert me of new notes |
CANSLIM.net Company Profile |
SEC |
Zacks Reports |
StockTalk |
News |
Chart |
Request a new note
C
A N
S L
I M
|
Symbol/Exchange
Company Name
Industry Group |
PRICE |
CHANGE
(%Change) |
Day High |
Volume
(% DAV)
(% 50 day avg vol) |
52 Wk Hi
% From Hi |
Featured
Date |
Price
Featured |
Pivot Featured |
|
Max Buy |
NEOG
-
NASDAQ
Neogen Corp
DRUGS - Diagnostic Substances
|
$29.70
|
-0.16
-0.54% |
$30.39
|
98,121
102.96% of 50 DAV
50 DAV is 95,300
|
$30.25
-1.82%
|
7/22/2010
|
$27.19
|
PP = $27.87
|
|
MB = $29.26
|
Most Recent Note - 7/30/2010 4:28:23 PM
G - Today's gain actually had nearly 2 times average volume as it rallied for a new 52-week high above "max buy" level. It was featured in the 7/22/10 mid-day report (read here).
>>> The latest Featured Stock Update with an annotated graph appeared on 7/22/2010. Click here.
View all notes |
Alert me of new notes |
CANSLIM.net Company Profile |
SEC |
Zacks Reports |
StockTalk |
News |
Chart |
Request a new note
C
A N
S L
I M
|
NETL
-
NASDAQ
Netlogic Microsystems
ELECTRONICS - Semiconductor - Memory Chips
|
$29.91
|
+0.35
1.18% |
$30.50
|
994,734
72.33% of 50 DAV
50 DAV is 1,375,300
|
$35.00
-14.54%
|
7/28/2010
|
$33.44
|
PP = $35.10
|
|
MB = $36.86
|
Most Recent Note - 7/30/2010 3:48:23 PM
G - It has positively reversed after a gap down today and early trading below its 50 DMA line following a damaging loss on the prior session. Ahead of its latest earnings report it was featured in the 7/28/10 mid-day report in yellow (read here). Gains above resistance in the $35 area would turn its outlook bullish.
>>> The latest Featured Stock Update with an annotated graph appeared on 7/28/2010. Click here.
View all notes |
Alert me of new notes |
CANSLIM.net Company Profile |
SEC |
Zacks Reports |
StockTalk |
News |
Chart |
Request a new note
C
A N
S L
I M
|
ROVI
-
NASDAQ
Rovi Corp
COMPUTER SOFTWARE andamp; SERVICES - Security Software andamp; Services
|
$43.45
|
-1.05
-2.36% |
$44.50
|
1,686,127
129.53% of 50 DAV
50 DAV is 1,301,700
|
$44.96
-3.36%
|
6/3/2010
|
$38.70
|
PP = $40.16
|
|
MB = $42.17
|
Most Recent Note - 8/2/2010 3:58:27 PM
G - Pulled back today following a 7/30/10 gap up gain and new 52-week high with more than 2 times average volume after its latest earnings report. It is extended from a sound base, and support is defined by prior resistance in the $40 area and its 50 DMA line.
>>> The latest Featured Stock Update with an annotated graph appeared on 7/21/2010. Click here.
View all notes |
Alert me of new notes |
CANSLIM.net Company Profile |
SEC |
Zacks Reports |
StockTalk |
News |
Chart |
Request a new note
C
A N
S L
I M
|
THOR
-
NASDAQ
Thoratec Corp
HEALTH SERVICES - Medical Instruments and Supplies
|
$36.65
|
-0.13
-0.35% |
$37.55
|
1,890,924
170.02% of 50 DAV
50 DAV is 1,112,200
|
$47.93
-23.53%
|
6/3/2010
|
$44.38
|
PP = $45.35
|
|
MB = $47.62
|
Most Recent Note - 8/2/2010 4:58:48 PM
G - Small loss today on above average volume. Gapped down on 7/30/10 following its latest earnings news, triggering technical sell signals with a damaging loss on more than 6 times average volume.
>>> The latest Featured Stock Update with an annotated graph appeared on 7/16/2010. Click here.
View all notes |
Alert me of new notes |
CANSLIM.net Company Profile |
SEC |
Zacks Reports |
StockTalk |
News |
Chart |
Request a new note
C
A N
S L
I M
|
ULTA
-
NASDAQ
Ulta Salon Cosm & Frag
SPECIALTY RETAIL - Specialty Retail, Other
|
$25.43
|
+0.17
0.67% |
$25.87
|
394,057
54.48% of 50 DAV
50 DAV is 723,300
|
$26.75
-4.93%
|
5/28/2010
|
$25.58
|
PP = $25.86
|
|
MB = $27.15
|
Most Recent Note - 8/2/2010 4:59:27 PM
G - Holding its ground since a gap up for a solid gain with better than average volume on 7/29/10. Prior lows in the $22 area define the next support level just above its 200 DMA line.
>>> The latest Featured Stock Update with an annotated graph appeared on 7/19/2010. Click here.
View all notes |
Alert me of new notes |
CANSLIM.net Company Profile |
SEC |
Zacks Reports |
StockTalk |
News |
Chart |
Request a new note
C
A N
S L
I M
|
Symbol/Exchange
Company Name
Industry Group |
PRICE |
CHANGE
(%Change) |
Day High |
Volume
(% DAV)
(% 50 day avg vol) |
52 Wk Hi
% From Hi |
Featured
Date |
Price
Featured |
Pivot Featured |
|
Max Buy |
VIT
-
NYSE
Vanceinfo Tech Inc Ads
COMPUTER SOFTWARE and SERVICES - Business Software and Services
|
$26.87
|
+1.48
5.83% |
$26.93
|
465,303
82.52% of 50 DAV
50 DAV is 563,900
|
$27.59
-2.61%
|
7/8/2010
|
$25.20
|
PP = $26.58
|
|
MB = $27.91
|
Most Recent Note - 8/2/2010 5:04:29 PM
Y - Gapped up today and closed near the session high with a considerable gain on lighter than average volume. After holding its ground near June highs it quietly rose above the pivot point cited in prior reports. Color code was changed to yellow again based on its resilience. Its 7/19/10 low ($23.78) defines near-term support above its 50 DMA line.
>>> The latest Featured Stock Update with an annotated graph appeared on 7/26/2010. Click here.
View all notes |
Alert me of new notes |
CANSLIM.net Company Profile |
SEC |
Zacks Reports |
StockTalk |
News |
Chart |
Request a new note
C
A N
S L
I M
|