You are not logged in.
This means you
CAN ONLY VIEW reports that were published prior to Wednesday, April 30, 2025.
You
MUST UPGRADE YOUR MEMBERSHIP if you want to see any current reports.
AFTER MARKET UPDATE - THURSDAY, JULY 31ST, 2014
Previous After Market Report Next After Market Report >>>
|
|
|
|
DOW |
-317.06 |
16,563.30 |
-1.88% |
|
Volume |
909,388,240 |
+36% |
|
Volume |
2,092,947,750 |
+21% |
|
NASDAQ |
-93.13 |
4,369.77 |
-2.09% |
|
Advancers |
277 |
9% |
|
Advancers |
443 |
15% |
|
S&P 500 |
-39.40 |
1,930.67 |
-2.00% |
|
Decliners |
2,852 |
90% |
|
Decliners |
2,511 |
82% |
|
Russell 2000 |
-26.50 |
1,120.07 |
-2.31% |
|
52 Wk Highs |
26 |
|
|
52 Wk Highs |
28 |
|
|
S&P 600 |
-14.90 |
644.93 |
-2.26% |
|
52 Wk Lows |
107 |
|
|
52 Wk Lows |
110 |
|
|
 |
Technical Damage Signals Shift in Market Direction
Kenneth J. Gruneisen - Passed the CAN SLIM® Master's Exam
With Thursday's pullback, the major averages finished July in negative territory. For the month the Dow Jones Industrial Average lost -1.6%, the S&P 500 Index retreated -1.5% while the NASDAQ slipped -0.9%. The Dow violated its 50-day moving average (DMA) line as it fell 317 points to 16,563. The volume totals were higher than the prior session volume total on the NYSE and on the Nasdaq exchange, a sign of distributional pressure. Decliners led advancers by a 9-1 margin on the NYSE and by more than a 5-1 margin on the Nasdaq exchange. Leadership contracted as there were 12 high-ranked companies from the CANSLIM.net Leaders List that made new 52-week highs and appeared on the CANSLIM.net BreakOuts Page, down from the prior session total of 27 stocks. A healthy level of leadership (stocks hitting new 52-week highs) is necessary for any sustained rally. New 52-week lows outnumbered new 52-week highs on the NYSE and on the Nasdaq exchange. There was only 1 gainer out of the 14 of the high-ranked companies currently included on the Featured Stocks Page. The market (M criteria) deterioration is enough to earn the label of a "correction" as the technical damage became significant to chart readers. Disciplined investors limit losses and reduce market exposure during rough market periods by selling any stocks which fall more than -7% from their purchase price.
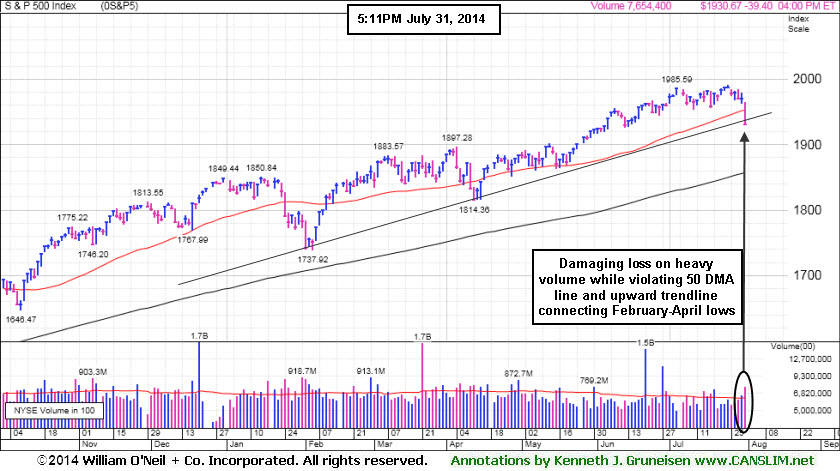
PICTURED: The benchmark S&P 500 Index retreated 39 points to 1,930. Its damaging loss on heavy volume led to a violation of its 50-day moving average line, a clear sign of the market's deteriorating strength. It also violated a multi-month upward trendline.
The NASDAQ Composite dropped 93 points to 4,369, leaving it ten points above its 50 DMA line. The major averages finished firmly lower following a round of disappointing earnings releases. Kraft (KRFT -6.4%) fell as results fell short of consensus. Whole Foods (WFM -2.3%) fell following its reduced its outlook. Health insurer Cigna (CI -3.7%) even after profits topped estimates and raised its full-year forecast. Market weakness was also attributed to concerns surrounding a debt default by Argentina.
On the economic front, weekly jobless claims rose to 302,000 from a revised prior reading of 279,000. Friday's jobs report is expected to show non-farm payrolls rose 231,000 in July.
All 10 sectors in the S&P 500 declined on the session by more than -1.5%. Energy and telecom were the worst performing groups. Exxon (XOM -4.2%) and Verizon (VZ -2.6%) fell. Allstate (ALL 2.7%) was a notable gainer after reporting quarterly results above consensus.
Treasuries finished mixed and little changed. The 10-year note was down 1/32 to yield 2.56%.
|
 Kenneth J. Gruneisen started out as a licensed stockbroker in August 1987, a couple of months prior to the historic stock market crash that took the Dow Jones Industrial Average down -22.6% in a single day. He has published daily fact-based fundamental and technical analysis on high-ranked stocks online for two decades. Through FACTBASEDINVESTING.COM, Kenneth provides educational articles, news, market commentary, and other information regarding proven investment systems that work in good times and bad.
Comments contained in the body of this report are technical opinions only and are not necessarily those of Gruneisen Growth Corp. The material herein has been obtained from sources believed to be reliable and accurate, however, its accuracy and completeness cannot be guaranteed. Our firm, employees, and customers may effect transactions, including transactions contrary to any recommendation herein, or have positions in the securities mentioned herein or options with respect thereto. Any recommendation contained in this report may not be suitable for all investors and it is not to be deemed an offer or solicitation on our part with respect to the purchase or sale of any securities. |
|
 |
Tech, Financial, Retail and Commodity-Linked Groups Fell
Kenneth J. Gruneisen - Passed the CAN SLIM® Master's Exam
The Networking Index ($NWX -3.06%), Biotechnology Index ($BTK -2.41%), and the Semiconductor Index ($SOX -2.10%) fell as the tech sector suffered large losses. Financial shares were weak as the Broker/Dealer Index ($XBD -1.88%) and the Bank Index ($BKX -1.76%) fell, and the Retail Index ($RLX -1.81%) was also a negative influence on the major averages. The Gold & Silver Index ($XAU -2.02%) lost ground and energy-related shares sank as the Oil Services Index ($OSX -2.61%) and the Integrated Oil Index ($XOI -1.77%) lost ground.
Charts courtesy www.stockcharts.com
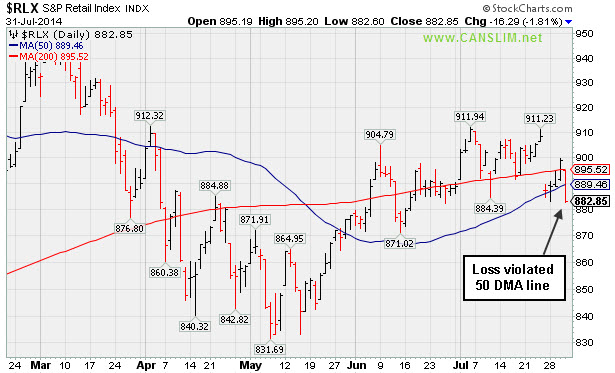
PICTURED: The Retail Index ($RLX -1.81%) suffered a damaging loss and violated its 200-day moving average (DMA) line.
| Oil Services |
$OSX |
287.98 |
-7.73 |
-2.61% |
+2.47% |
| Integrated Oil |
$XOI |
1,641.89 |
-29.64 |
-1.77% |
+9.23% |
| Semiconductor |
$SOX |
607.55 |
-13.05 |
-2.10% |
+13.55% |
| Networking |
$NWX |
326.70 |
-10.32 |
-3.06% |
+0.85% |
| Broker/Dealer |
$XBD |
162.60 |
-3.11 |
-1.88% |
+1.27% |
| Retail |
$RLX |
882.85 |
-16.29 |
-1.81% |
-6.06% |
| Gold & Silver |
$XAU |
98.87 |
-2.04 |
-2.02% |
+17.49% |
| Bank |
$BKX |
70.14 |
-1.26 |
-1.76% |
+1.27% |
| Biotech |
$BTK |
2,737.17 |
-67.57 |
-2.41% |
+17.45% |
|
|
|
 |
Fundamental and Technical Deterioration Hurts Outlook
Kenneth J. Gruneisen - Passed the CAN SLIM® Master's Exam
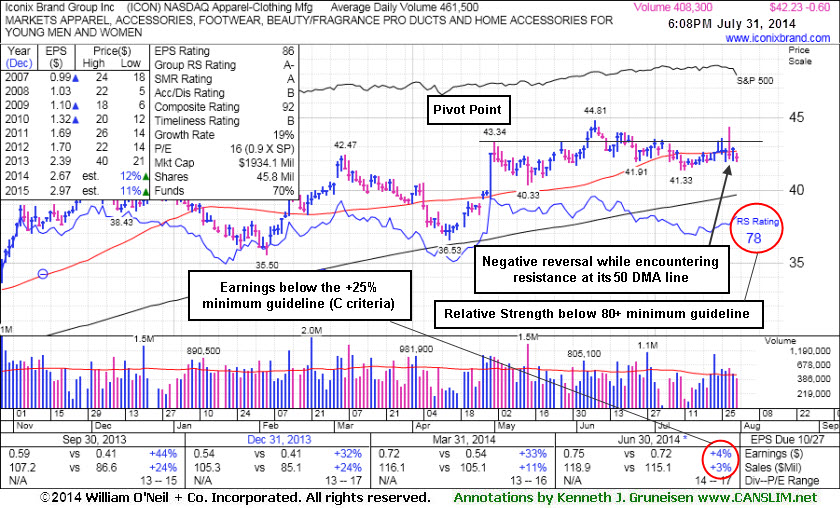
Iconix Brand Group Inc (ICON -$0.23 or -0.55% to $41.68) encountered resistance near its 50-day moving average (DMA) recently and there was a "negative reversal" on 7/29/14. It reported earnings +4% on +3% sales revenues for the Jun '14 quarter, below the +25% minimum earnings guideline (C criteria), raising fundamental concerns. Its Relative Strength rating has slumped below the 80+ minimum guideline for buy candidates under the fact-based system and it faces resistance due to overhead supply up through the $44 level which may hinder its ability to rally. More damaging losses undercutting prior lows ($41.33 on 7/10/14) would raise greater concerns and trigger a more worrisome technical sell signal.
The stock was last shown in this FSU section on 7/11/14 with annotated graphs under the headline, "Slump Below 50-Day Moving Average Line Hurt Outlook". Disciplined investors limit losses while they are small by always selling if any stock falls more than -7% from their purchase price.
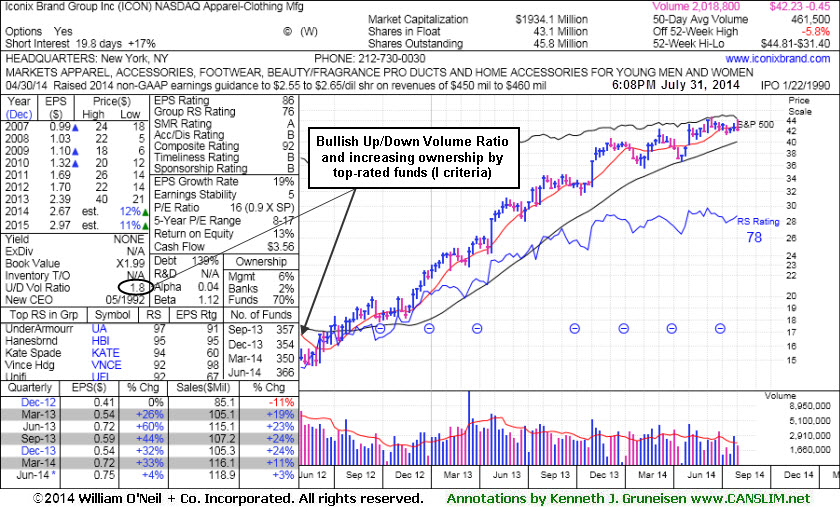
The high-ranked Apparel - Clothing Manufacturing firm's annual earnings (A criteria) history has been steady. The number of top-rated funds owning its shares fell from 357 in Sep '13 to 366 in Jun '14, not a reassuring sign concerning the I criteria. However, its current Up/Down Volume Ratio of 1.8 is a unbiased indication its shares have been under accumulation over the past 50 days.
|
|
|
Color Codes Explained :
Y - Better candidates highlighted by our
staff of experts.
G - Previously featured
in past reports as yellow but may no longer be buyable under the
guidelines.
***Last / Change / Volume data in this table is the closing quote data***
Symbol/Exchange
Company Name
Industry Group |
PRICE |
CHANGE
(%Change) |
Day High |
Volume
(% DAV)
(% 50 day avg vol) |
52 Wk Hi
% From Hi |
Featured
Date |
Price
Featured |
Pivot Featured |
|
Max Buy |
ACT
-
NYSE
Actavis plc
Medical-Generic Drugs
|
$214.26
|
-1.29
-0.60% |
$214.80
|
3,024,929
142.82% of 50 DAV
50 DAV is 2,118,000
|
$230.77
-7.15%
|
6/20/2014
|
$216.53
|
PP = $230.87
|
|
MB = $242.41
|
Most Recent Note - 7/29/2014 8:09:11 PM
Y - Quietly edged below its 50 DMA line ($215.53) with today's 4th consecutive loss. Still only -6.9% off its 52-week high. Subsequent volume-driven gains to new highs may trigger a technical buy signal.
>>> FEATURED STOCK ARTICLE : Disciplined Investors Still Awaiting Technical Breakout - 7/16/2014
View all notes |
Set NEW NOTE alert |
CANSLIM.net Company Profile |
SEC
News |
Chart |
Request a new note
C
A N
S L
I M


|
AFSI
-
NASDAQ
Amtrust Financial Svcs
INSURANCE - Property and; Casualty Insurance
|
$42.64
|
-1.07
-2.45% |
$43.55
|
298,344
51.09% of 50 DAV
50 DAV is 584,000
|
$47.10
-9.47%
|
5/21/2014
|
$44.85
|
PP = $44.85
|
|
MB = $47.09
|
Most Recent Note - 7/29/2014 8:11:13 PM
G - Small gains this week helped it rebound above its 50 DMA line helping its technical stance and outlook improve. Faces little resistance due to overhead supply up through the $47 level.
>>> FEATURED STOCK ARTICLE : 50-Day Moving Average Line Acted as Recent Resistance - 7/23/2014
View all notes |
Set NEW NOTE alert |
CANSLIM.net Company Profile |
SEC
News |
Chart |
Request a new note
C
A N
S L
I M
|
BITA
-
NYSE
Bitauto Hldgs Ltd Ads
Internet-Content
|
$54.36
|
-1.67
-2.98% |
$55.79
|
1,000,011
111.24% of 50 DAV
50 DAV is 899,000
|
$58.50
-7.08%
|
6/26/2014
|
$46.20
|
PP = $47.03
|
|
MB = $49.38
|
 Most Recent Note - 7/31/2014 4:02:23 PM
G - Pulled back with today's 3rd consecutive loss on average volume. It remains extended from its prior base after recently wedging higher. Prior highs and its 50 DMA line coincide in the $46 area defining important near-term support to watch on pullbacks.
>>> FEATURED STOCK ARTICLE : Strength Returned After Shake-Out and Positive Reversal - 7/21/2014
View all notes |
Set NEW NOTE alert |
CANSLIM.net Company Profile |
SEC
News |
Chart |
Request a new note
C
A N
S L
I M
|
BWLD
-
NASDAQ
Buffalo Wild Wings Inc
LEISURE - Restaurants
|
$145.32
|
+0.15
0.10% |
$146.50
|
943,524
196.53% of 50 DAV
50 DAV is 480,100
|
$167.64
-13.31%
|
6/19/2014
|
$158.52
|
PP = $159.91
|
|
MB = $167.91
|
Most Recent Note - 7/30/2014 3:51:42 PM
G - Gapped down today for a damaging loss on heavy volume, violating its 50 DMA line and triggering a technical sell signal. Color code is changed to green while trading near its 200 DMA line which may act as support. Reported earnings +42% on +20% sales revenues for the Jun '14 quarter.
>>> FEATURED STOCK ARTICLE : Slump Into Prior Base Negated Recent Breakout - 7/14/2014
View all notes |
Set NEW NOTE alert |
CANSLIM.net Company Profile |
SEC
News |
Chart |
Request a new note
C
A N
S L
I M
|
EQM
-
NYSE
E Q T Midstream Partners
ENERGY - Oil and Gas Pipelines
|
$86.54
|
-2.68
-3.00% |
$89.19
|
448,679
136.79% of 50 DAV
50 DAV is 328,000
|
$102.51
-15.58%
|
12/12/2013
|
$53.17
|
PP = $56.51
|
|
MB = $59.34
|
Most Recent Note - 7/30/2014 5:45:07 PM
G - Violated its 50 DMA line with today's loss triggering a technical sell signal. Reported earnings +37% on +21% sales revenues for the Jun '14 quarter, an improvement after 2 sub par quarterly earnings comparisons.
>>> FEATURED STOCK ARTICLE : Volume Totals Cooling While Consolidating Near Highs - 7/17/2014
View all notes |
Set NEW NOTE alert |
CANSLIM.net Company Profile |
SEC
News |
Chart |
Request a new note
C
A N
S L
I M
|
Symbol/Exchange
Company Name
Industry Group |
PRICE |
CHANGE
(%Change) |
Day High |
Volume
(% DAV)
(% 50 day avg vol) |
52 Wk Hi
% From Hi |
Featured
Date |
Price
Featured |
Pivot Featured |
|
Max Buy |
FB
-
NASDAQ
Facebook Inc Cl A
INTERNET
|
$72.65
|
-2.03
-2.71% |
$74.17
|
43,521,405
96.94% of 50 DAV
50 DAV is 44,897,000
|
$76.74
-5.33%
|
7/24/2014
|
$76.00
|
PP = $72.69
|
|
MB = $76.32
|
Most Recent Note - 7/30/2014 5:47:33 PM
Y - Holding its ground stubbornly near its 52-week high, above its pivot point and below its "max buy" level. Highlighted in yellow in the 7/24/14 mid-day report (read here) as a "breakaway gap" followed strong earnings news for the Jun '14 quarter and it triggered a technical buy signal.
>>> FEATURED STOCK ARTICLE : Breakaway Gap May Signal Beginning of Meaningful Rally - 7/24/2014
View all notes |
Set NEW NOTE alert |
CANSLIM.net Company Profile |
SEC
News |
Chart |
Request a new note
C
A N
S L
I M
|
GRFS
-
NASDAQ
Grifols Sa Cl B Ads
Medical-Ethical Drugs
|
$36.67
|
-5.54
-13.12% |
$38.35
|
3,093,113
499.70% of 50 DAV
50 DAV is 619,000
|
$46.66
-21.41%
|
5/15/2014
|
$41.14
|
PP = $43.55
|
|
MB = $45.73
|
Most Recent Note - 7/31/2014 11:11:17 AM
Gapped down today for a considerable volume-driven loss violating its prior lows and undercutting its 200 DMA line triggering more worrisome technical sell signals. It will be dropped from the Featured Stocks list tonight.
>>> FEATURED STOCK ARTICLE : Encountered Resistance at 50-Day Moving Average Line - 7/29/2014
View all notes |
Set NEW NOTE alert |
CANSLIM.net Company Profile |
SEC
News |
Chart |
Request a new note
C
A N
S L
I M
|
HF
-
NYSE
H F F Inc Cl A
REAL ESTATE - Property Management/Developmen
|
$33.96
|
-1.54
-4.34% |
$35.07
|
264,758
135.08% of 50 DAV
50 DAV is 196,000
|
$38.23
-11.17%
|
6/20/2014
|
$34.60
|
PP = $36.16
|
|
MB = $37.97
|
Most Recent Note - 7/31/2014 4:00:09 PM
G - Color code is changed to green while slumping below its 50 DMA line ($34.64) with today's loss raising concerns. Subsequent violation of its recent low ($33.91 on 7/18/14) would raise greater concerns and trigger a more worrisome technical sell signal.
>>> FEATURED STOCK ARTICLE : Slump Into Prior Base Negated Recent Breakout - 7/15/2014
View all notes |
Set NEW NOTE alert |
CANSLIM.net Company Profile |
SEC
News |
Chart |
Request a new note
C
A N
S L
I M
|
ICON
-
NASDAQ
Iconix Brand Group Inc
CONSUMER NON-DURABLES - Textile - Apparel Footwear
|
$42.23
|
-0.60
-1.40% |
$42.54
|
404,222
87.68% of 50 DAV
50 DAV is 461,000
|
$44.81
-5.76%
|
6/5/2014
|
$43.54
|
PP = $43.44
|
|
MB = $45.61
|
Most Recent Note - 7/31/2014 6:37:19 PM
G - Reported earnings +4% on +3% sales revenues for the Jun '14 quarter, below the +25% minimum earnings guideline (C criteria) raising fundamental concerns. Recent "negative reversal" as 50 DMA line acted as resistance and Relative Strength rating fell below 80+ minimum guideline. See latest FSU analysis for more details and new annotated graphs.
>>> FEATURED STOCK ARTICLE : Fundamental and Technical Deterioration Hurts Outlook - 7/31/2014
View all notes |
Set NEW NOTE alert |
CANSLIM.net Company Profile |
SEC
News |
Chart |
Request a new note
C
A N
S L
I M
|
PANW
-
NYSE
Palo Alto Networks
Computer Sftwr-Security
|
$80.86
|
-3.35
-3.98% |
$83.40
|
910,029
50.73% of 50 DAV
50 DAV is 1,794,000
|
$85.78
-5.74%
|
7/30/2014
|
$84.21
|
PP = $85.88
|
|
MB = $90.17
|
Most Recent Note - 7/31/2014 3:57:54 PM
Y - Pulling back from its 52-week high with a loss today on below average volume. Color code was changed to yellow with new pivot point cited based on its 6/30/14 high plus 10 cents while building on a short flat base. Subsequent volume-driven gains to new high territory may trigger a new (or add-on) technical buy signal. Its 50 DMA line and prior highs define important support where subsequent violations would raise serious concerns and trigger technical sell signals.
>>> FEATURED STOCK ARTICLE : Found Support Above 50-Day Average Near Prior Highs - 7/22/2014
View all notes |
Set NEW NOTE alert |
CANSLIM.net Company Profile |
SEC
News |
Chart |
Request a new note
C
A N
S L
I M
|
Symbol/Exchange
Company Name
Industry Group |
PRICE |
CHANGE
(%Change) |
Day High |
Volume
(% DAV)
(% 50 day avg vol) |
52 Wk Hi
% From Hi |
Featured
Date |
Price
Featured |
Pivot Featured |
|
Max Buy |
TARO
-
NYSE
Taro Pharmaceutical Inds
DRUGS - Drug Manufacturers - Other
|
$141.26
|
-4.07
-2.80% |
$146.37
|
64,422
90.74% of 50 DAV
50 DAV is 71,000
|
$149.89
-5.76%
|
7/30/2014
|
$144.24
|
PP = $149.99
|
|
MB = $157.49
|
Most Recent Note - 7/30/2014 1:08:02 PM
Y - Color code is changed to yellow with new pivot point cited based on its 7/14/14 high while building on an advanced "3-weeks tight" base. Subsequent volume-driven gains to new highs may trigger a new (or add-on) buy signal. Tallying a volume-driven gain today.
>>> FEATURED STOCK ARTICLE : Big Gains in First 2-3 Weeks After Breakout an Encouraging Sign - 7/18/2014
View all notes |
Set NEW NOTE alert |
CANSLIM.net Company Profile |
SEC
News |
Chart |
Request a new note
C
A N
S L
I M
|
TRN
-
NYSE
Trinity Industries Inc
TRANSPORTATION - Railroads
|
$43.64
|
-2.08
-4.55% |
$45.04
|
4,557,305
150.01% of 50 DAV
50 DAV is 3,038,000
|
$47.83
-8.76%
|
4/30/2014
|
$37.79
|
PP = $38.03
|
|
MB = $39.93
|
Most Recent Note - 7/31/2014 3:54:48 PM
G - Gapped down today for a volume-driven loss, retreating from its 52-week high and testing its 50 DMA line ($43.19) which defines important near-term support. A damaging violation would raise concerns and trigger a technical sell signal. Reported earnings +91% on +39% sales for the Jun '14 quarter.
>>> FEATURED STOCK ARTICLE : Earnings News Due Following Tuesday's Close - 7/28/2014
View all notes |
Set NEW NOTE alert |
CANSLIM.net Company Profile |
SEC
News |
Chart |
Request a new note
C
A N
S L
I M
|
UA
-
NYSE
Under Armour Inc Cl A
CONSUMER NON-DURABLES - Textile - Apparel Clothing
|
$66.75
|
-2.47
-3.57% |
$68.97
|
4,486,570
163.62% of 50 DAV
50 DAV is 2,742,000
|
$70.94
-5.91%
|
7/10/2014
|
$58.50
|
PP = $60.79
|
|
MB = $63.83
|
Most Recent Note - 7/31/2014 3:56:28 PM
G - Pulling back today with higher volume, enduring distributional pressure. Recently reported earnings +0% on +34% sales revenues for the Jun '14 quarter, below the +25% minimum earnings guideline (C criteria), yet the company raised its guidance.
>>> FEATURED STOCK ARTICLE : Bullish Action Despite Latest Earnings Below +25% Minimum Guideline - 7/30/2014
View all notes |
Set NEW NOTE alert |
CANSLIM.net Company Profile |
SEC
News |
Chart |
Request a new note
C
A N
S L
I M
|
WLK
-
NYSE
Westlake Chemical Corp
CHEMICALS - Specialty Chemicals
|
$87.39
|
-2.07
-2.31% |
$89.15
|
889,061
155.98% of 50 DAV
50 DAV is 570,000
|
$91.97
-4.98%
|
4/29/2014
|
$72.79
|
PP = $69.31
|
|
MB = $72.78
|
Most Recent Note - 7/30/2014 5:42:51 PM
G - Pulled back with above average volume today, retreating from its 52-week high after getting extended from any sound base pattern. Its 50 DMA line defines important near-term support to watch on pullbacks.
>>> FEATURED STOCK ARTICLE : Extended From Prior Base After Streak of 8 Consecutive Gains - 7/25/2014
View all notes |
Set NEW NOTE alert |
CANSLIM.net Company Profile |
SEC
News |
Chart |
Request a new note
C
A N
S L
I M
|
|
|
|
THESE ARE NOT BUY RECOMMENDATIONS!
Comments contained in the body of this report are technical
opinions only. The material herein has been obtained
from sources believed to be reliable and accurate, however,
its accuracy and completeness cannot be guaranteed.
This site is not an investment advisor, hence it does
not endorse or recommend any securities or other investments.
Any recommendation contained in this report may not
be suitable for all investors and it is not to be deemed
an offer or solicitation on our part with respect to
the purchase or sale of any securities. All trademarks,
service marks and trade names appearing in this report
are the property of their respective owners, and are
likewise used for identification purposes only.
This report is a service available
only to active Paid Premium Members.
You may opt-out of receiving report notifications
at any time. Questions or comments may be submitted
by writing to Premium Membership Services 665 S.E. 10 Street, Suite 201 Deerfield Beach, FL 33441-5634 or by calling 1-800-965-8307
or 954-785-1121.
|
|
|

