You are not logged in.
This means you
CAN ONLY VIEW reports that were published prior to Friday, April 11, 2025.
You
MUST UPGRADE YOUR MEMBERSHIP if you want to see any current reports.
AFTER MARKET UPDATE - WEDNESDAY, JULY 30TH, 2014
Previous After Market Report Next After Market Report >>>
|
|
|
|
DOW |
-31.75 |
16,880.36 |
-0.19% |
|
Volume |
666,515,150 |
+8% |
|
Volume |
1,734,363,380 |
-11% |
|
NASDAQ |
+20.20 |
4,462.90 |
+0.45% |
|
Advancers |
1,183 |
37% |
|
Advancers |
1,662 |
58% |
|
S&P 500 |
+0.12 |
1,970.07 |
+0.01% |
|
Decliners |
1,865 |
59% |
|
Decliners |
1,106 |
39% |
|
Russell 2000 |
+4.93 |
1,146.57 |
+0.43% |
|
52 Wk Highs |
91 |
|
|
52 Wk Highs |
59 |
|
|
S&P 600 |
+1.54 |
659.83 |
+0.23% |
|
52 Wk Lows |
55 |
|
|
52 Wk Lows |
55 |
|
|
 |
Mixed Action After Fed Maintained Prior Course
Kenneth J. Gruneisen - Passed the CAN SLIM® Master's Exam
Stocks finished mixed on Wednesday. The Dow had declined 95 points before closing down 32 at 16,880. The S&P 500 rose less than a point to 1,970. The NASDAQ gained 20 points to 4,462. The volume totals were mixed, higher than the prior session volume total on the NYSE and lower on the Nasdaq exchange. Decliners led advancers by a 3-2 margin on the NYSE while advancers led decliners by a 3-2 margin on the Nasdaq exchange. There were 27 high-ranked companies from the CANSLIM.net Leaders List that made new 52-week highs and appeared on the CANSLIM.net BreakOuts Page, versus the prior session total of 26 stocks. New 52-week highs outnumbered new 52-week lows on the NYSE and on the Nasdaq exchange. There were gains for 9 of the 14 of the high-ranked companies currently included on the Featured Stocks Page. The market (M criteria) uptrend recently faced pressure, however a healthy level of leadership has been reassuring. Disciplined investors limit losses and reduce market exposure during rough market periods by selling any stocks which fall more than -7% from their purchase price.
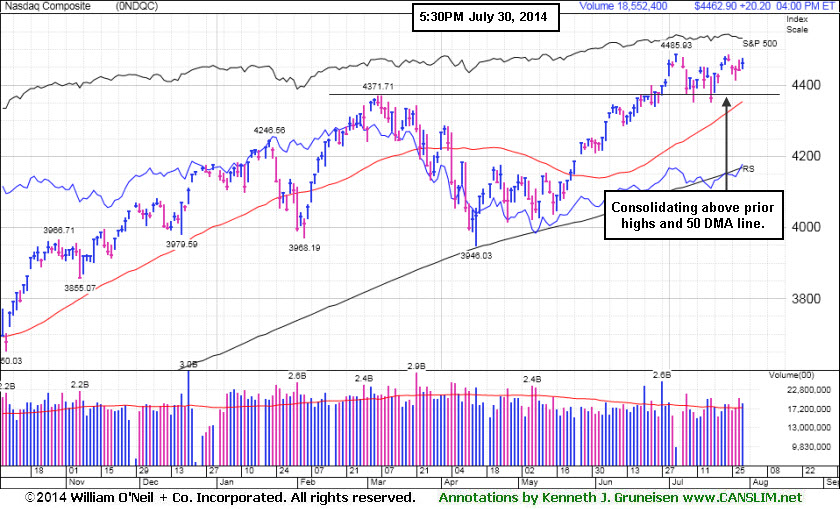
PICTURED: The Nasdaq Composite Index is consolidating above prior highs and its 50-day moving average (DMA) line.
The major averages experienced a choppy trading session as investors weighed economic data against Fed policy. Before the open, the Commerce Department reported U.S. GDP expanded at a +4% annualized rate in the second quarter versus a projected +3% increase. Stocks moved lower amid speculation that the positive growth figure could prompt policy makers to raise interest rates sooner than anticipated. The market rebounded after the central bank announced another $10 billion reduction in its monthly bond buying program and maintained its benchmark rate unchanged.
On the earnings front, Twitter (TWTR +20%) rallied after posting results above analyst projections. Edward Lifesciences (EW +10%) rose following the heart valve maker's increased profit outlook. Amgen (AMGN +5.4%) rose as revenues topped consensus estimates. Consumer discretionary was the best performing group in the S&P 500 today. Netflix (NFLX +2.4%) rose. Utilities were down the most on the session. Shares of Exelon (EXC -1.5%) were lower.
Treasuries declined with the 10-year note falling 26/32 to yield 2.55%.
|
 Kenneth J. Gruneisen started out as a licensed stockbroker in August 1987, a couple of months prior to the historic stock market crash that took the Dow Jones Industrial Average down -22.6% in a single day. He has published daily fact-based fundamental and technical analysis on high-ranked stocks online for two decades. Through FACTBASEDINVESTING.COM, Kenneth provides educational articles, news, market commentary, and other information regarding proven investment systems that work in good times and bad.
Comments contained in the body of this report are technical opinions only and are not necessarily those of Gruneisen Growth Corp. The material herein has been obtained from sources believed to be reliable and accurate, however, its accuracy and completeness cannot be guaranteed. Our firm, employees, and customers may effect transactions, including transactions contrary to any recommendation herein, or have positions in the securities mentioned herein or options with respect thereto. Any recommendation contained in this report may not be suitable for all investors and it is not to be deemed an offer or solicitation on our part with respect to the purchase or sale of any securities. |
|
 |
Broker/Dealer Index Led Group Gainers
Kenneth J. Gruneisen - Passed the CAN SLIM® Master's Exam
The Broker/Dealer Index ($XBD +3.91%) was a standout gainer on Wednesday while the Bank Index ($BKX +0.88%) posted a smaller gain, and the Retail Index ($RLX +1.16%) was also a positive influence on the major averages. The Networking Index ($NWX +1.42%) led the tech sector while the Semiconductor Index ($SOX +1.00%) posted a solid gain and the Biotechnology Index ($BTK +0.19%) inched higher. Commodity-linked groups fell as the Gold & Silver Index ($XAU -0.93%), Oil Services Index ($OSX -0.82%), and the Integrated Oil Index ($XOI -0.34%) lost ground.
Charts courtesy www.stockcharts.com
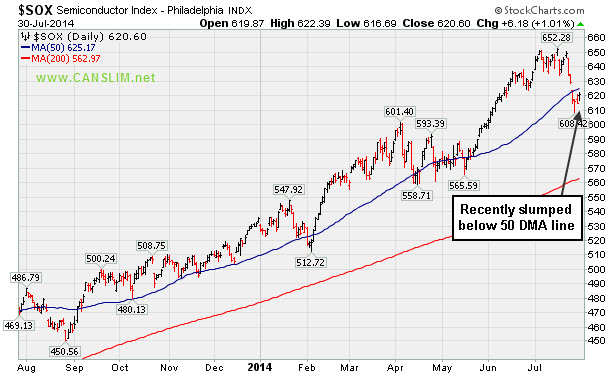
PICTURED: The Semiconductor Index ($SOX +1.00%) recently slumped below its 50-day moving average (DMA) line.
| Oil Services |
$OSX |
295.71 |
-2.43 |
-0.82% |
+5.22% |
| Integrated Oil |
$XOI |
1,671.53 |
-5.70 |
-0.34% |
+11.20% |
| Semiconductor |
$SOX |
620.60 |
+6.17 |
+1.00% |
+15.99% |
| Networking |
$NWX |
337.02 |
+4.73 |
+1.42% |
+4.04% |
| Broker/Dealer |
$XBD |
165.71 |
+6.23 |
+3.91% |
+3.21% |
| Retail |
$RLX |
899.14 |
+10.27 |
+1.16% |
-4.33% |
| Gold & Silver |
$XAU |
100.91 |
-0.95 |
-0.93% |
+19.92% |
| Bank |
$BKX |
71.40 |
+0.62 |
+0.88% |
+3.09% |
| Biotech |
$BTK |
2,804.74 |
+5.23 |
+0.19% |
+20.35% |
|
|
|
 |
Bullish Action Despite Latest Earnings Below +25% Minimum Guideline
Kenneth J. Gruneisen - Passed the CAN SLIM® Master's Exam
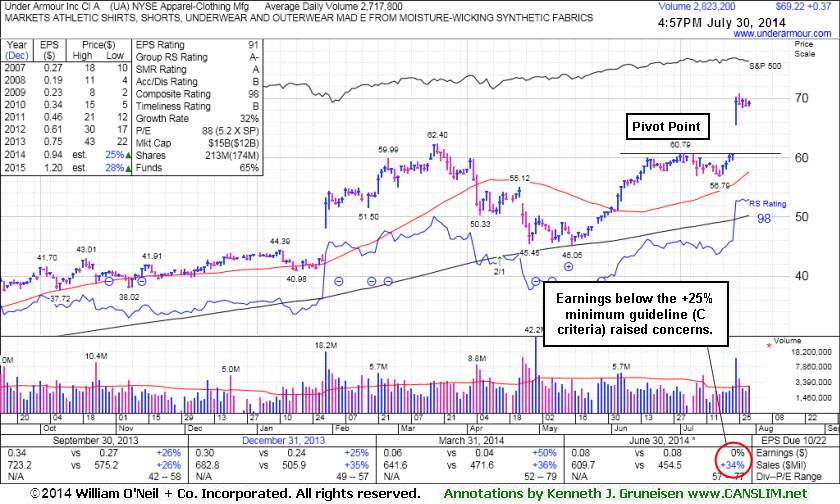
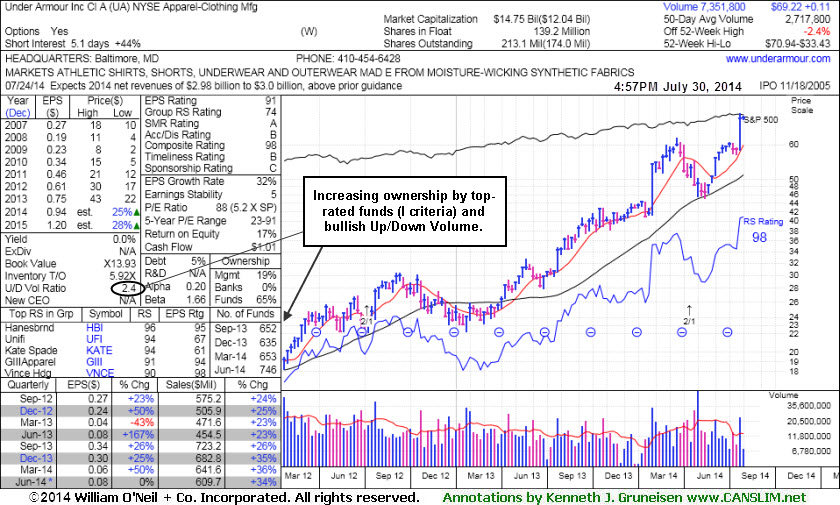
Under Armour Inc (UA +$0.37 or +0.54% to $69.22) recently reported earnings +0% on +34% sales revenues for the Jun '14 quarter, below the +25% minimum earnings guideline (C criteria) and raising concerns, yet the company increased its guidance. It has been stubbornly holding its ground at its 52-week high following a considerable "breakaway gap" on 7/24/14 with more than 4 times average volume. A breakaway gap is the one noted exception where investors may chase a stock more than +5% above prior highs, but the risks increase the further above prior highs one buys that an ordinary pullback may prompt investors into selling based on the fact-based investment system's rule of always selling if any stock falls more than -7% from the purchase price. However, fundamental concerns were raised by its sub par earnings growth in the most current quarter.
It was last shown in this FSU section on 7/10/14 with annotated graphs under the headline, "Forming Handle on Cup-With-Handle Base Pattern", after highlighted in yellow with pivot point based on its 7/01/14 high in the earlier mid-day report (read here). The high-ranked Apparel - Clothing manufacturing firm's annual earnings (A criteria) history has been strong. The number of top-rated funds owning its shares rose from 637 in Dec '13 to 725 in Jun '14, a reassuring trend concerning the I criteria. Its current Up/Down Volume Ratio of 2.9 is an unbiased indication that its shares have been under accumulation over the past 50 days.
|
|
|
Color Codes Explained :
Y - Better candidates highlighted by our
staff of experts.
G - Previously featured
in past reports as yellow but may no longer be buyable under the
guidelines.
***Last / Change / Volume data in this table is the closing quote data***
Symbol/Exchange
Company Name
Industry Group |
PRICE |
CHANGE
(%Change) |
Day High |
Volume
(% DAV)
(% 50 day avg vol) |
52 Wk Hi
% From Hi |
Featured
Date |
Price
Featured |
Pivot Featured |
|
Max Buy |
ACT
-
NYSE
Actavis plc
Medical-Generic Drugs
|
$215.55
|
+0.70
0.33% |
$216.56
|
1,565,517
73.74% of 50 DAV
50 DAV is 2,123,000
|
$230.77
-6.60%
|
6/20/2014
|
$216.53
|
PP = $230.87
|
|
MB = $242.41
|
Most Recent Note - 7/29/2014 8:09:11 PM
Y - Quietly edged below its 50 DMA line ($215.53) with today's 4th consecutive loss. Still only -6.9% off its 52-week high. Subsequent volume-driven gains to new highs may trigger a technical buy signal.
>>> FEATURED STOCK ARTICLE : Disciplined Investors Still Awaiting Technical Breakout - 7/16/2014
View all notes |
Set NEW NOTE alert |
CANSLIM.net Company Profile |
SEC
News |
Chart |
Request a new note
C
A N
S L
I M


|
AFSI
-
NASDAQ
Amtrust Financial Svcs
INSURANCE - Property and; Casualty Insurance
|
$43.71
|
+0.65
1.51% |
$43.93
|
453,610
77.14% of 50 DAV
50 DAV is 588,000
|
$47.10
-7.20%
|
5/21/2014
|
$44.85
|
PP = $44.85
|
|
MB = $47.09
|
Most Recent Note - 7/29/2014 8:11:13 PM
G - Small gains this week helped it rebound above its 50 DMA line helping its technical stance and outlook improve. Faces little resistance due to overhead supply up through the $47 level.
>>> FEATURED STOCK ARTICLE : 50-Day Moving Average Line Acted as Recent Resistance - 7/23/2014
View all notes |
Set NEW NOTE alert |
CANSLIM.net Company Profile |
SEC
News |
Chart |
Request a new note
C
A N
S L
I M
|
BITA
-
NYSE
Bitauto Hldgs Ltd Ads
Internet-Content
|
$56.03
|
-0.50
-0.88% |
$57.19
|
876,060
97.67% of 50 DAV
50 DAV is 897,000
|
$58.50
-4.22%
|
6/26/2014
|
$46.20
|
PP = $47.03
|
|
MB = $49.38
|
Most Recent Note - 7/29/2014 8:07:00 PM
G - Small loss today on higher but below average volume. It remains extended from its prior base after recently wedging higher. Prior highs and its 50 DMA line coincide in the $46 area defining important near-term support to watch on pullbacks.
>>> FEATURED STOCK ARTICLE : Strength Returned After Shake-Out and Positive Reversal - 7/21/2014
View all notes |
Set NEW NOTE alert |
CANSLIM.net Company Profile |
SEC
News |
Chart |
Request a new note
C
A N
S L
I M
|
BWLD
-
NASDAQ
Buffalo Wild Wings Inc
LEISURE - Restaurants
|
$145.17
|
-21.98
-13.15% |
$152.47
|
4,192,570
1,048.14% of 50 DAV
50 DAV is 400,000
|
$167.64
-13.40%
|
6/19/2014
|
$158.52
|
PP = $159.91
|
|
MB = $167.91
|
 Most Recent Note - 7/30/2014 3:51:42 PM
G - Gapped down today for a damaging loss on heavy volume, violating its 50 DMA line and triggering a technical sell signal. Color code is changed to green while trading near its 200 DMA line which may act as support. Reported earnings +42% on +20% sales revenues for the Jun '14 quarter.
>>> FEATURED STOCK ARTICLE : Slump Into Prior Base Negated Recent Breakout - 7/14/2014
View all notes |
Set NEW NOTE alert |
CANSLIM.net Company Profile |
SEC
News |
Chart |
Request a new note
C
A N
S L
I M
|
EQM
-
NYSE
E Q T Midstream Partners
ENERGY - Oil and Gas Pipelines
|
$89.22
|
-2.78
-3.02% |
$93.97
|
248,210
76.37% of 50 DAV
50 DAV is 325,000
|
$102.51
-12.96%
|
12/12/2013
|
$53.17
|
PP = $56.51
|
|
MB = $59.34
|
Most Recent Note - 7/30/2014 5:45:07 PM
G - Violated its 50 DMA line with today's loss triggering a technical sell signal. Reported earnings +37% on +21% sales revenues for the Jun '14 quarter, an improvement after 2 sub par quarterly earnings comparisons.
>>> FEATURED STOCK ARTICLE : Volume Totals Cooling While Consolidating Near Highs - 7/17/2014
View all notes |
Set NEW NOTE alert |
CANSLIM.net Company Profile |
SEC
News |
Chart |
Request a new note
C
A N
S L
I M
|
Symbol/Exchange
Company Name
Industry Group |
PRICE |
CHANGE
(%Change) |
Day High |
Volume
(% DAV)
(% 50 day avg vol) |
52 Wk Hi
% From Hi |
Featured
Date |
Price
Featured |
Pivot Featured |
|
Max Buy |
FB
-
NASDAQ
Facebook Inc Cl A
INTERNET
|
$74.68
|
+0.97
1.31% |
$75.19
|
36,328,030
80.69% of 50 DAV
50 DAV is 45,021,000
|
$76.74
-2.69%
|
7/24/2014
|
$76.00
|
PP = $72.69
|
|
MB = $76.32
|
Most Recent Note - 7/30/2014 5:47:33 PM
Y - Holding its ground stubbornly near its 52-week high, above its pivot point and below its "max buy" level. Highlighted in yellow in the 7/24/14 mid-day report (read here) as a "breakaway gap" followed strong earnings news for the Jun '14 quarter and it triggered a technical buy signal.
>>> FEATURED STOCK ARTICLE : Breakaway Gap May Signal Beginning of Meaningful Rally - 7/24/2014
View all notes |
Set NEW NOTE alert |
CANSLIM.net Company Profile |
SEC
News |
Chart |
Request a new note
C
A N
S L
I M
|
GRFS
-
NASDAQ
Grifols Sa Cl B Ads
Medical-Ethical Drugs
|
$42.21
|
-0.03
-0.07% |
$42.42
|
367,850
58.02% of 50 DAV
50 DAV is 634,000
|
$46.66
-9.54%
|
5/15/2014
|
$41.14
|
PP = $43.55
|
|
MB = $45.73
|
Most Recent Note - 7/29/2014 8:13:29 PM
G - Encountered resistance again today at its 50 DMA line. A rebound above that important short-term average is needed for its outlook to improve. Faces resistance due to overhead supply up through the $46 area. See the latest FSU analysis for more details and annotated graphs.
>>> FEATURED STOCK ARTICLE : Encountered Resistance at 50-Day Moving Average Line - 7/29/2014
View all notes |
Set NEW NOTE alert |
CANSLIM.net Company Profile |
SEC
News |
Chart |
Request a new note
C
A N
S L
I M
|
HF
-
NYSE
H F F Inc Cl A
REAL ESTATE - Property Management/Developmen
|
$35.50
|
+0.62
1.78% |
$35.59
|
248,875
128.29% of 50 DAV
50 DAV is 194,000
|
$38.23
-7.14%
|
6/20/2014
|
$34.60
|
PP = $36.16
|
|
MB = $37.97
|
Most Recent Note - 7/30/2014 5:49:10 PM
Y - Recently finding support at its 50 DMA line ($34.56). Subsequent violations of that important short-term average and recent lows ($33.91 on 7/18/14) would raise greater concerns and trigger technical sell signals.
>>> FEATURED STOCK ARTICLE : Slump Into Prior Base Negated Recent Breakout - 7/15/2014
View all notes |
Set NEW NOTE alert |
CANSLIM.net Company Profile |
SEC
News |
Chart |
Request a new note
C
A N
S L
I M
|
ICON
-
NASDAQ
Iconix Brand Group Inc
CONSUMER NON-DURABLES - Textile - Apparel Footwear
|
$42.83
|
+0.39
0.92% |
$42.96
|
478,973
103.00% of 50 DAV
50 DAV is 465,000
|
$44.81
-4.42%
|
6/5/2014
|
$43.54
|
PP = $43.44
|
|
MB = $45.61
|
Most Recent Note - 7/30/2014 5:50:57 PM
G - Consolidating near its 50 DMA line. Reported earnings +4% on +3% sales revenues for the Jun '14 quarter, below the +25% minimum earnings guideline (C criteria) raising fundamental concerns. Faces resistance due to overhead supply up through the $44 level.
>>> FEATURED STOCK ARTICLE : Slump Below 50-Day Moving Average Line Hurt Outlook - 7/11/2014
View all notes |
Set NEW NOTE alert |
CANSLIM.net Company Profile |
SEC
News |
Chart |
Request a new note
C
A N
S L
I M
|
PANW
-
NYSE
Palo Alto Networks
Computer Sftwr-Security
|
$84.21
|
+2.11
2.57% |
$84.23
|
902,988
50.33% of 50 DAV
50 DAV is 1,794,000
|
$85.78
-1.83%
|
7/30/2014
|
$84.21
|
PP = $85.88
|
|
MB = $90.17
|
Most Recent Note - 7/30/2014 5:54:26 PM
Y - Color code is changed to yellow with new pivot point cited based on its 6/30/14 high plus 10 cents while building on a short flat base. Subsequent volume-driven gains to new high territory may trigger a new (or add-on) technical buy signal. Its 50 DMA line and prior highs define important support where subsequent violations would raise serious concerns and trigger technical sell signals.
>>> FEATURED STOCK ARTICLE : Found Support Above 50-Day Average Near Prior Highs - 7/22/2014
View all notes |
Set NEW NOTE alert |
CANSLIM.net Company Profile |
SEC
News |
Chart |
Request a new note
C
A N
S L
I M
|
Symbol/Exchange
Company Name
Industry Group |
PRICE |
CHANGE
(%Change) |
Day High |
Volume
(% DAV)
(% 50 day avg vol) |
52 Wk Hi
% From Hi |
Featured
Date |
Price
Featured |
Pivot Featured |
|
Max Buy |
TARO
-
NYSE
Taro Pharmaceutical Inds
DRUGS - Drug Manufacturers - Other
|
$145.33
|
+4.34
3.08% |
$146.70
|
109,700
156.71% of 50 DAV
50 DAV is 70,000
|
$149.89
-3.04%
|
7/30/2014
|
$144.24
|
PP = $149.99
|
|
MB = $157.49
|
Most Recent Note - 7/30/2014 1:08:02 PM
Y - Color code is changed to yellow with new pivot point cited based on its 7/14/14 high while building on an advanced "3-weeks tight" base. Subsequent volume-driven gains to new highs may trigger a new (or add-on) buy signal. Tallying a volume-driven gain today.
>>> FEATURED STOCK ARTICLE : Big Gains in First 2-3 Weeks After Breakout an Encouraging Sign - 7/18/2014
View all notes |
Set NEW NOTE alert |
CANSLIM.net Company Profile |
SEC
News |
Chart |
Request a new note
C
A N
S L
I M
|
TRN
-
NYSE
Trinity Industries Inc
TRANSPORTATION - Railroads
|
$45.72
|
+0.70
1.55% |
$47.83
|
4,861,525
162.54% of 50 DAV
50 DAV is 2,991,000
|
$46.29
-1.23%
|
4/30/2014
|
$37.79
|
PP = $38.03
|
|
MB = $39.93
|
Most Recent Note - 7/30/2014 1:14:19 PM
G - Hit a new 52-week high today yet erased much of its early gain. Its 50 DMA line defines important near-term support to watch. Reported earnings +91% on +39% sales for the Jun '14 quarter. See the latest FSU analysis for more details and new annotated graphs.
>>> FEATURED STOCK ARTICLE : Earnings News Due Following Tuesday's Close - 7/28/2014
View all notes |
Set NEW NOTE alert |
CANSLIM.net Company Profile |
SEC
News |
Chart |
Request a new note
C
A N
S L
I M
|
UA
-
NYSE
Under Armour Inc Cl A
CONSUMER NON-DURABLES - Textile - Apparel Clothing
|
$69.22
|
+0.37
0.54% |
$69.66
|
2,823,202
103.91% of 50 DAV
50 DAV is 2,717,000
|
$70.94
-2.42%
|
7/10/2014
|
$58.50
|
PP = $60.79
|
|
MB = $63.83
|
Most Recent Note - 7/30/2014 5:41:37 PM
G - Recently reported earnings +0% on +34% sales revenues for the Jun '14 quarter, below the +25% minimum earnings guideline (C criteria), yet the company raised its guidance. Holding its ground at its 52-week high following a considerable "breakaway gap" on 7/24/14. See the latest FSU analysis for more details and new annotated graphs.
>>> FEATURED STOCK ARTICLE : Bullish Action Despite Latest Earnings Below +25% Minimum Guideline - 7/30/2014
View all notes |
Set NEW NOTE alert |
CANSLIM.net Company Profile |
SEC
News |
Chart |
Request a new note
C
A N
S L
I M
|
WLK
-
NYSE
Westlake Chemical Corp
CHEMICALS - Specialty Chemicals
|
$89.46
|
-0.54
-0.60% |
$90.80
|
992,816
176.97% of 50 DAV
50 DAV is 561,000
|
$91.97
-2.73%
|
4/29/2014
|
$72.79
|
PP = $69.31
|
|
MB = $72.78
|
Most Recent Note - 7/30/2014 5:42:51 PM
G - Pulled back with above average volume today, retreating from its 52-week high after getting extended from any sound base pattern. Its 50 DMA line defines important near-term support to watch on pullbacks.
>>> FEATURED STOCK ARTICLE : Extended From Prior Base After Streak of 8 Consecutive Gains - 7/25/2014
View all notes |
Set NEW NOTE alert |
CANSLIM.net Company Profile |
SEC
News |
Chart |
Request a new note
C
A N
S L
I M
|
|
|
|
THESE ARE NOT BUY RECOMMENDATIONS!
Comments contained in the body of this report are technical
opinions only. The material herein has been obtained
from sources believed to be reliable and accurate, however,
its accuracy and completeness cannot be guaranteed.
This site is not an investment advisor, hence it does
not endorse or recommend any securities or other investments.
Any recommendation contained in this report may not
be suitable for all investors and it is not to be deemed
an offer or solicitation on our part with respect to
the purchase or sale of any securities. All trademarks,
service marks and trade names appearing in this report
are the property of their respective owners, and are
likewise used for identification purposes only.
This report is a service available
only to active Paid Premium Members.
You may opt-out of receiving report notifications
at any time. Questions or comments may be submitted
by writing to Premium Membership Services 665 S.E. 10 Street, Suite 201 Deerfield Beach, FL 33441-5634 or by calling 1-800-965-8307
or 954-785-1121.
|
|
|

