You are not logged in.
This means you
CAN ONLY VIEW reports that were published prior to Monday, April 14, 2025.
You
MUST UPGRADE YOUR MEMBERSHIP if you want to see any current reports.
AFTER MARKET UPDATE - TUESDAY, JULY 27TH, 2010
Previous After Market Report Next After Market Report >>>
|
|
|
|
DOW |
+12.26 |
10,537.69 |
+0.12% |
|
Volume |
1,115,420,240 |
+10% |
|
Volume |
2,011,803,170 |
-5% |
|
NASDAQ |
-8.18 |
2,288.25 |
-0.36% |
|
Advancers |
1,336 |
42% |
|
Advancers |
1,123 |
40% |
|
S&P 500 |
-1.17 |
1,113.84 |
-0.10% |
|
Decliners |
1,700 |
54% |
|
Decliners |
1,502 |
54% |
|
Russell 2000 |
-3.05 |
662.17 |
-0.46% |
|
52 Wk Highs |
242 |
|
|
52 Wk Highs |
100 |
|
|
S&P 600 |
-1.35 |
355.22 |
-0.38% |
|
52 Wk Lows |
11 |
|
|
52 Wk Lows |
24 |
|
|
 |
Major Averages End Mixed Amid Mixed Economic News
Adam Sarhan, Contributing Writer,
The major averages traded between positive and negative territory and finished Tuesday's session basically flat after the latest round of mixed earnings and economic data was released. Volume, an important indicator of institutional sponsorship, was reported mixed, higher on the NYSE and lower on the Nasdaq exchange. Decliners led advancers by about a 5-to-4 ratio on the NYSE and on the Nasdaq exchange while new 52-week highs easily outnumbered new 52-week lows on both major exchanges. There were 59 high-ranked companies from the CANSLIM.net Leaders List that made a new 52-week high and appeared on the CANSLIM.net BreakOuts Page, down from the 64 issues that appeared on the prior session. The recent signs of expanding leadership bode well for the current confirmed rally.
The major averages opened higher after DuPont De Nemours & Co (DD +3.57%) and Deutsche Bank's (DB +2.84%) shares gapped higher on solid Q2 results. However, the major averages fell into the red after the latest round of mixed economic data was released. The S&P Case-Shiller home-price index showed home prices across the US rose in May due to "seasonal factors and the residual impact of the now-expired first-time home buyers’ tax credit." The Case-Shiller 20-city index rose +1.3% compared to April's reading and it rose +0.5% when adjusted for seasonal factors. It was somewhat encouraging to see the index rise +4.6% when compared to the same period last year. Elsewhere, consumer confidence plunged to a five-month low and the latest reading on US manufacturing fell short of the Street's estimates.
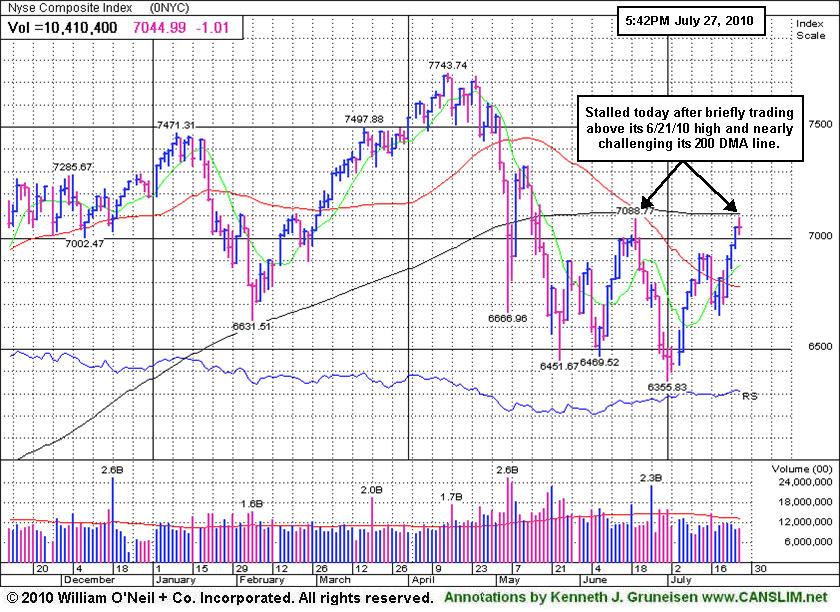
It is encouraging to see the major averages hold on to their gains after breaking above their respective 2-month downward trendlines and rising above their respective 50 & 200 day moving average (DMA) lines in recent sessions. It is also healthy to see a new batch of high-ranked stocks breakout of fresh bases as the present rally gets stronger. The window remains open for for high-ranked stocks to be accumulated when they trigger fresh technical buy signals. Trade accordingly.
PICTURED: The NYSE Composite Index stalled today after briefly trading above its 6/21/10 high and nearly challenging its 200 DMA line.
|
|
|
 |
The Classic "Safe Haven" Group Suffers Another Big Loss
Kenneth J. Gruneisen - Passed the CAN SLIM® Master's Exam
Financial shares were mixed on Tuesday as the Broker/Dealer Index ($XBD -0.19%) edged lower and the Bank Index ($BKX +0.43%) posted a modest gain. The Healthcare Index ($HMO -0.15%) and energy-related shares edged lower as the Integrated Oil Index ($XOI -0.39%) and Oil Services Index ($OSX -0.36%) finished with small losses. The tech sector had a negative bias as the Networking Index ($NWX -1.42%), Semiconductor Index ($SOX -0.93%), Internet Index ($IIX -0.91%), and Biotechnology Index ($BTK -0.84%) ended unanimously lower.
Charts courtesy www.stockcharts.com
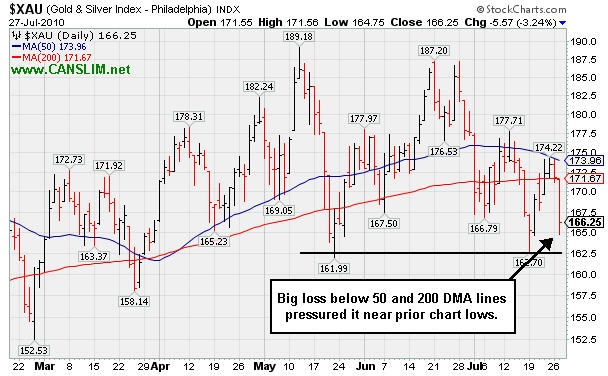
PICTURED 1: The Gold & Silver Index ($XAU -3.24%) was clearly a laggard as it tumbled for a large loss below its 50-day moving average (DMA) and 200 DMA lines, sinking toward prior chart lows.
Charts courtesy www.stockcharts.com

PICTURED 2: The Retail Index ($RLX -1.91%) encountered resistance at its 50 DMA line which recently crossed under its 200 DMA line.
| Oil Services |
$OSX |
180.86 |
-0.66 |
-0.36% |
-7.21% |
| Healthcare |
$HMO |
1,447.64 |
-2.16 |
-0.15% |
-1.72% |
| Integrated Oil |
$XOI |
981.07 |
-3.85 |
-0.39% |
-8.16% |
| Semiconductor |
$SOX |
366.08 |
-3.42 |
-0.93% |
+1.71% |
| Networking |
$NWX |
248.03 |
-3.58 |
-1.42% |
+7.35% |
| Internet |
$IIX |
246.31 |
-2.26 |
-0.91% |
+5.32% |
| Broker/Dealer |
$XBD |
105.89 |
-0.20 |
-0.19% |
-7.96% |
| Retail |
$RLX |
407.67 |
-8.01 |
-1.93% |
-0.84% |
| Gold & Silver |
$XAU |
166.25 |
-5.57 |
-3.24% |
-1.19% |
| Bank |
$BKX |
49.39 |
+0.21 |
+0.43% |
+15.64% |
| Biotech |
$BTK |
1,075.98 |
-9.36 |
-0.86% |
+14.21% |
|
|
|
 |
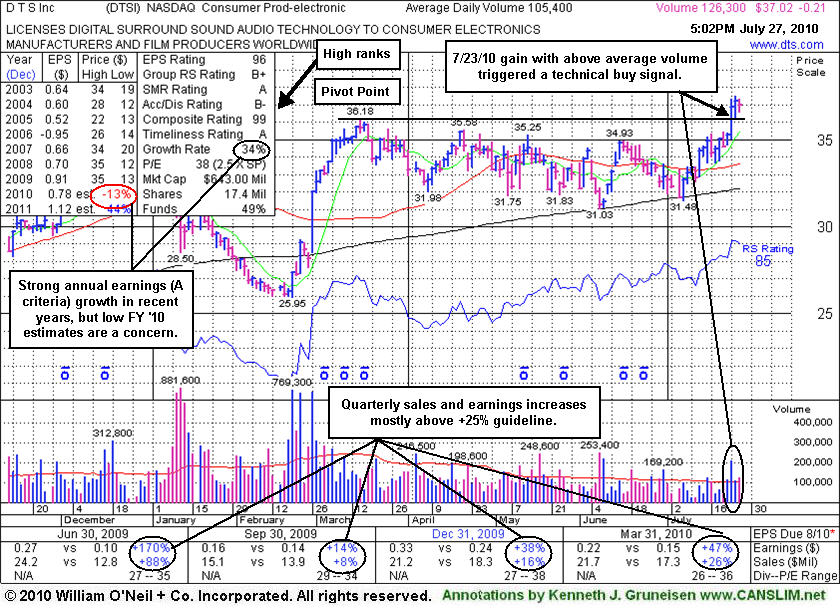
Digital Sound Technology Licensor Faces No Resistance After Breakout
Kenneth J. Gruneisen - Passed the CAN SLIM® Master's Exam
D T S Inc (DTSI -$0.29 or -0.78% to $36.94) is holding its ground above prior multi-year highs in the $35-36 area after its 7/23/10 gain with above average volume triggered a technical buy signal by clearing its 3/16/10 high. It was featured in yellow in today's mid-day report (read here). This high-ranked leader hailing from the Consumer Products - Electronics group is due to report earnings after the close on Monday, August 9th. That could be a difficult comparison for it to beat by a healthy margin, and Street estimates calling for lower FY '10 earnings (see red circle) are also of some concern. However, no resistance currently remains to hinder its upward progress. Its small supply (S criteria) of only 17.4 million shares outstanding can lead to greater volatility in the event of institutional accumulation or distribution. Volume and volatility often increase near earnings news. It will be important to stay disciplined about making proper entries and exits, as always. Disciplined investors avoid chasing a stock more than +5% above its prior chart high or pivot point.
|
|
|
Color Codes Explained :
Y - Better candidates highlighted by our
staff of experts.
G - Previously featured
in past reports as yellow but may no longer be buyable under the
guidelines.
***Last / Change / Volume data in this table is the closing quote data***
Symbol/Exchange
Company Name
Industry Group |
PRICE |
CHANGE
(%Change) |
Day High |
Volume
(% DAV)
(% 50 day avg vol) |
52 Wk Hi
% From Hi |
Featured
Date |
Price
Featured |
Pivot Featured |
|
Max Buy |
AAPL
-
NASDAQ
Apple Inc
COMPUTER HARDWARE - Personal Computers
|
$264.08
|
+4.80
1.85% |
$264.80
|
20,747,904
72.11% of 50 DAV
50 DAV is 28,770,700
|
$279.01
-5.35%
|
6/17/2010
|
$270.95
|
PP = $272.56
|
|
MB = $286.19
|
 Most Recent Note - 7/27/2010 4:07:04 PM
Y - Gain today with light volume continues its recent rebound above its 50 DMA line. Consolidating for the 6th week since its negative reversal on 6/21/10 at its all-time high, its color code is changed to yellow with new pivot point cited.
>>> The latest Featured Stock Update with an annotated graph appeared on 7/12/2010. Click here.
View all notes |
Alert me of new notes |
CANSLIM.net Company Profile |
SEC |
Zacks Reports |
StockTalk |
News |
Chart |
Request a new note
C
A N
S L
I M


|
ABV
-
NYSE
Comp De Bebidas Adr
FOOD and BEVERAGE - Beverages - Brewers
|
$107.85
|
-0.20
-0.19% |
$109.19
|
392,998
53.65% of 50 DAV
50 DAV is 732,500
|
$109.78
-1.76%
|
6/29/2010
|
$104.74
|
PP = $109.33
|
|
MB = $114.80
|
Most Recent Note - 7/27/2010 4:10:30 PM
Y - This Brazil-based beverage firm is quietly holding its ground after reaching a new 52-week high, but it has not triggered a recent technical buy signal. It found support near its 50 DMA line since featured in the 6/29/10 mid-day report.
>>> The latest Featured Stock Update with an annotated graph appeared on 7/20/2010. Click here.
View all notes |
Alert me of new notes |
CANSLIM.net Company Profile |
SEC |
Zacks Reports |
StockTalk |
News |
Chart |
Request a new note
C
A N
S L
I M
|
BIDU
-
NASDAQ
Baidu Inc Ads
INTERNET - Internet Information Providers
|
$81.07
|
+0.70
0.87% |
$81.99
|
10,736,460
79.25% of 50 DAV
50 DAV is 13,546,800
|
$82.29
-1.48%
|
7/14/2010
|
$75.03
|
PP = $78.59
|
|
MB = $82.52
|
Most Recent Note - 7/27/2010 4:12:53 PM
Y - Posted a 4th consecutive gain today on light volume while trading with 30 cents of its all-time high. Latest quarter ended June 30, 2010 showed sales revenues growth still accelerating and earnings increasing by triple digit percentages for the 2nd consecutive comparison.
>>> The latest Featured Stock Update with an annotated graph appeared on 7/14/2010. Click here.
View all notes |
Alert me of new notes |
CANSLIM.net Company Profile |
SEC |
Zacks Reports |
StockTalk |
News |
Chart |
Request a new note
C
A N
S L
I M
|
CRM
-
NYSE
Salesforce.Com Inc
INTERNET - Internet Software and Services
|
$98.80
|
-1.27
-1.27% |
$100.98
|
1,697,968
59.66% of 50 DAV
50 DAV is 2,846,200
|
$101.49
-2.65%
|
6/2/2010
|
$88.44
|
PP = $89.60
|
|
MB = $94.08
|
Most Recent Note - 7/27/2010 4:17:44 PM
G - Pulled back on lighter volume today after rising to a new 52-week highs on the 2 prior sessions with higher volume near average. On 7/23/10 it rose from a choppy 7-week base.
>>> The latest Featured Stock Update with an annotated graph appeared on 7/15/2010. Click here.
View all notes |
Alert me of new notes |
CANSLIM.net Company Profile |
SEC |
Zacks Reports |
StockTalk |
News |
Chart |
Request a new note
C
A N
S L
I M
|
DTSI
-
NASDAQ
D T S Inc
CONSUMER DURABLES - Electronic Equipment
|
$36.94
|
-0.29
-0.78% |
$37.26
|
131,888
124.78% of 50 DAV
50 DAV is 105,700
|
$37.50
-1.49%
|
7/27/2010
|
$37.00
|
PP = $36.28
|
|
MB = $38.09
|
Most Recent Note - 7/27/2010 4:20:02 PM
Y - Holding its ground above prior multi-year highs in the $35-36 area after its 7/23/10 gain with above average volume triggered a technical buy signal. It was featured in yellow in the 7/27/10 mid-day report (read here). Due to report earnings after the close on Monday, August 9th. Street estimates that are calling for lower FY '10 earnings are of some concern.
>>> The latest Featured Stock Update with an annotated graph appeared on 7/27/2010. Click here.
View all notes |
Alert me of new notes |
CANSLIM.net Company Profile |
SEC |
Zacks Reports |
StockTalk |
News |
Chart |
Request a new note
C
A N
S L
I M
|
Symbol/Exchange
Company Name
Industry Group |
PRICE |
CHANGE
(%Change) |
Day High |
Volume
(% DAV)
(% 50 day avg vol) |
52 Wk Hi
% From Hi |
Featured
Date |
Price
Featured |
Pivot Featured |
|
Max Buy |
FFIV
-
NASDAQ
F 5 Networks Inc
INTERNET - Internet Software and Services
|
$86.09
|
-1.39
-1.59% |
$87.95
|
1,489,477
83.22% of 50 DAV
50 DAV is 1,789,800
|
$87.69
-1.82%
|
6/16/2010
|
$74.50
|
PP = $74.10
|
|
MB = $77.81
|
Most Recent Note - 7/27/2010 4:27:57 PM
G - Reversed into the red and closed with a small loss on lighter volume today after touching another new 52-week high. It is extended from a sound base, yet could go on to produce more climactic gains
>>> The latest Featured Stock Update with an annotated graph appeared on 7/7/2010. Click here.
View all notes |
Alert me of new notes |
CANSLIM.net Company Profile |
SEC |
Zacks Reports |
StockTalk |
News |
Chart |
Request a new note
C
A N
S L
I M
|
MELI
-
NASDAQ
Mercadolibre Inc
INTERNET - Internet Software and; Services
|
$64.00
|
-1.15
-1.77% |
$65.74
|
948,432
100.46% of 50 DAV
50 DAV is 944,100
|
$65.99
-3.02%
|
5/13/2010
|
$54.21
|
PP = $55.85
|
|
MB = $58.64
|
Most Recent Note - 7/27/2010 4:36:46 PM
G - Loss today with average volume followed a considerable gain with above average volume that helped it clear a choppy 6-week consolidation for a new 52-week high. Support to watch is defined by its 50 DMA line and its Dec '09 highs in the $55 area.
>>> The latest Featured Stock Update with an annotated graph appeared on 7/23/2010. Click here.
View all notes |
Alert me of new notes |
CANSLIM.net Company Profile |
SEC |
Zacks Reports |
StockTalk |
News |
Chart |
Request a new note
C
A N
S L
I M
|
NEM
-
NYSE
Newmont Mining Corp
METALS and MINING - Gold
|
$55.78
|
-2.32
-3.99% |
$57.36
|
14,297,608
155.74% of 50 DAV
50 DAV is 9,180,600
|
$63.38
-11.99%
|
6/22/2010
|
$59.60
|
PP = $59.67
|
|
MB = $62.65
|
Most Recent Note - 7/27/2010 12:04:05 PM
G - Gapped down today, triggering a technical sell signal while violating its 50 DMA line and trading near its December 2009 highs which may now serve as support. Earnings news is due before the open on Wednesday July 28th. A prompt rebound back to near or above its short-term average would be an encouraging sign, meanwhile the action looks distributional and it faces some near-term resistance due to overhead supply.
>>> The latest Featured Stock Update with an annotated graph appeared on 7/9/2010. Click here.
View all notes |
Alert me of new notes |
CANSLIM.net Company Profile |
SEC |
Zacks Reports |
StockTalk |
News |
Chart |
Request a new note
C
A N
S L
I M
|
NEOG
-
NASDAQ
Neogen Corp
DRUGS - Diagnostic Substances
|
$29.30
|
+0.13
0.45% |
$29.80
|
109,981
118.77% of 50 DAV
50 DAV is 92,600
|
$29.18
0.41%
|
7/22/2010
|
$27.19
|
PP = $27.87
|
|
MB = $29.26
|
Most Recent Note - 7/27/2010 4:39:25 PM
G - Closed in the lower third of its intra-day trading range near its "max buy" level after early gains today near the $30 level. Color code is changed to green. Recent action has been bullish, as indicated by its current Up/Down Volume Ratio of 1.5, which is an unbiased indication of recent accumulation. Technically, the actual gains that lifted it above the pivot point cited lacked the volume conviction required after it was featured in the 7/22/10 mid-day report (read here).
>>> The latest Featured Stock Update with an annotated graph appeared on 7/22/2010. Click here.
View all notes |
Alert me of new notes |
CANSLIM.net Company Profile |
SEC |
Zacks Reports |
StockTalk |
News |
Chart |
Request a new note
C
A N
S L
I M
|
ROVI
-
NASDAQ
Rovi Corp
COMPUTER SOFTWARE andamp; SERVICES - Security Software andamp; Services
|
$43.60
|
-1.06
-2.37% |
$44.85
|
835,302
62.94% of 50 DAV
50 DAV is 1,327,200
|
$44.79
-2.65%
|
6/3/2010
|
$38.70
|
PP = $40.16
|
|
MB = $42.17
|
Most Recent Note - 7/27/2010 4:42:35 PM
G - Loss today on lighter volume, pulling back from its 52-week high after 3 consecutive gains on below average volume. Earnings news is due 7/29/10 after the close. Support is defined by prior resistance in the $40 area and its 50 DMA line.
>>> The latest Featured Stock Update with an annotated graph appeared on 7/21/2010. Click here.
View all notes |
Alert me of new notes |
CANSLIM.net Company Profile |
SEC |
Zacks Reports |
StockTalk |
News |
Chart |
Request a new note
C
A N
S L
I M
|
Symbol/Exchange
Company Name
Industry Group |
PRICE |
CHANGE
(%Change) |
Day High |
Volume
(% DAV)
(% 50 day avg vol) |
52 Wk Hi
% From Hi |
Featured
Date |
Price
Featured |
Pivot Featured |
|
Max Buy |
THOR
-
NASDAQ
Thoratec Corp
HEALTH SERVICES - Medical Instruments and Supplies
|
$43.62
|
-0.39
-0.89% |
$45.90
|
1,047,668
107.88% of 50 DAV
50 DAV is 971,100
|
$47.93
-8.99%
|
6/3/2010
|
$44.38
|
PP = $45.35
|
|
MB = $47.62
|
Most Recent Note - 7/27/2010 4:46:27 PM
Y - This high-ranked Medical Products gapped up today and then reversed for a loss and closed near its 50 DMA line. Earnings news is due after the close on Thursday 7/29/10. Color code was changed to yellow as it rebounded above its short-term average this week after briefly undercutting its prior chart low.
>>> The latest Featured Stock Update with an annotated graph appeared on 7/16/2010. Click here.
View all notes |
Alert me of new notes |
CANSLIM.net Company Profile |
SEC |
Zacks Reports |
StockTalk |
News |
Chart |
Request a new note
C
A N
S L
I M
|
ULTA
-
NASDAQ
Ulta Salon Cosm & Frag
SPECIALTY RETAIL - Specialty Retail, Other
|
$24.67
|
-0.76
-2.99% |
$25.84
|
346,367
48.72% of 50 DAV
50 DAV is 711,000
|
$26.75
-7.78%
|
5/28/2010
|
$25.58
|
PP = $25.86
|
|
MB = $27.15
|
Most Recent Note - 7/27/2010 4:49:19 PM
G - Closed near the session low today, negatively reversing for a loss on light volume after a small gap up. It has not formed a sound new base since its June breakout attempt failed. Prior lows in the $22 area define the next support level just above its 200 DMA line.
>>> The latest Featured Stock Update with an annotated graph appeared on 7/19/2010. Click here.
View all notes |
Alert me of new notes |
CANSLIM.net Company Profile |
SEC |
Zacks Reports |
StockTalk |
News |
Chart |
Request a new note
C
A N
S L
I M
|
VIT
-
NYSE
Vanceinfo Tech Inc Ads
COMPUTER SOFTWARE and SERVICES - Business Software and Services
|
$25.98
|
-0.16
-0.61% |
$26.77
|
300,652
47.61% of 50 DAV
50 DAV is 631,500
|
$27.59
-5.84%
|
7/8/2010
|
$25.20
|
PP = $26.58
|
|
MB = $27.91
|
Most Recent Note - 7/27/2010 4:53:18 PM
Y - Back to back losses have erased last Friday's gain for a new 52-week high and it has slumped back below its pivot point. It briefly matched its all-time high when it was featured in the 7/08/10 mid-day report (read here).
>>> The latest Featured Stock Update with an annotated graph appeared on 7/26/2010. Click here.
View all notes |
Alert me of new notes |
CANSLIM.net Company Profile |
SEC |
Zacks Reports |
StockTalk |
News |
Chart |
Request a new note
C
A N
S L
I M
|
|
|
|
THESE ARE NOT BUY RECOMMENDATIONS!
Comments contained in the body of this report are technical
opinions only. The material herein has been obtained
from sources believed to be reliable and accurate, however,
its accuracy and completeness cannot be guaranteed.
This site is not an investment advisor, hence it does
not endorse or recommend any securities or other investments.
Any recommendation contained in this report may not
be suitable for all investors and it is not to be deemed
an offer or solicitation on our part with respect to
the purchase or sale of any securities. All trademarks,
service marks and trade names appearing in this report
are the property of their respective owners, and are
likewise used for identification purposes only.
This report is a service available
only to active Paid Premium Members.
You may opt-out of receiving report notifications
at any time. Questions or comments may be submitted
by writing to Premium Membership Services 665 S.E. 10 Street, Suite 201 Deerfield Beach, FL 33441-5634 or by calling 1-800-965-8307
or 954-785-1121.
|
|
|


