You are not logged in.
This means you
CAN ONLY VIEW reports that were published prior to Monday, April 14, 2025.
You
MUST UPGRADE YOUR MEMBERSHIP if you want to see any current reports.
AFTER MARKET UPDATE - TUESDAY, JULY 26TH, 2011
Previous After Market Report Next After Market Report >>>
|
|
|
|
DOW |
-91.50 |
12,501.30 |
-0.73% |
|
Volume |
837,374,350 |
+10% |
|
Volume |
1,694,552,090 |
+8% |
|
NASDAQ |
-2.84 |
2,839.96 |
-0.10% |
|
Advancers |
999 |
32% |
|
Advancers |
890 |
33% |
|
S&P 500 |
-5.49 |
1,331.94 |
-0.41% |
|
Decliners |
1,979 |
64% |
|
Decliners |
1,688 |
63% |
|
Russell 2000 |
-6.57 |
824.83 |
-0.79% |
|
52 Wk Highs |
44 |
|
|
52 Wk Highs |
32 |
|
|
S&P 600 |
-3.85 |
443.93 |
-0.86% |
|
52 Wk Lows |
50 |
|
|
52 Wk Lows |
43 |
|
|
 |
Indices Hovering Within -3% of Highs in the Face of Debt Concerns
Kenneth J. Gruneisen - Passed the CAN SLIM® Master's Exam
The three major averages finished a second consecutive session with unanimous losses of less than -1%. The volume totals were reported slightly higher than Monday's totals on the NYSE and on the Nasdaq exchange, a hint that institutional investors had a bias toward unloading stocks. Declining issues beat advancers by nearly 2-1 on both the NYSE and the Nasdaq exchange. New 52-week lows outnumbered new 52-week highs again on the NYSE and on the Nasdaq exchange. There were 21 high-ranked companies from the CANSLIM.net Leaders List that made new 52-week highs and appeared on the CANSLIM.net BreakOuts Page, down from Monday's total of 32 stocks. There were only 5 gainers out of the 18 high-ranked leaders currently included on the Featured Stocks Page.
Wall Street had a negative tilt in subdued trading as the stalemate over the federal deficit appeared to keep some equity investors on the sidelines. An auction of 2-year Treasury notes saw stronger demand, possibly anticipating an eventual agreement on the debt limit. Meanwhile, economic reports presented an unlikely combination of improved consumer confidence in July, but weak June new home sales.
Weak earnings played a big role in sending the Dow to its third straight loss. 3-M Company (MMM -5.4%) and was responsible for over 40 points of the Dow's decline after reporting lackluster results. Illinois Tool Works Inc (ITW -8.2%) also tumbled after disappointing results, and United Parcel Service (UPS -3.3%) fell after saying it expects a slow third quarter. All three of the above mentioned companies gapped down, in each case violating both their 50-day and 200-day moving average (DMA) line(s).
The technology sector held up the best today, led by Broadcom Corp (BRCM +9.47%) which rallied on positive earnings. Lexmark Int'l Inc (LXK +17.65%) was a standout after corporate customers lifted profits in the latest quarter. Meanwhile, Netflix Inc (NFLX -5.19%) forecast sluggish subscriber growth and its shares fell.
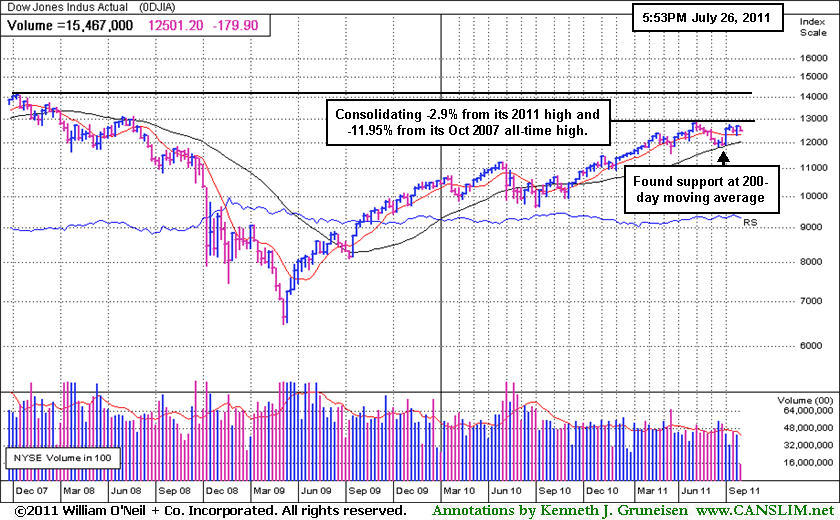
It is hard to say that a market rally is "under pressure" when each of the major averages is perched within -3% of their respective highs, however distribution days have been adding up in recent weeks, indicating some problems for the current rally. Financial stocks, considered very important leading indicators, have continued to struggle. The S&P 500 Index, Dow Jones Industrial Average, and Nasdaq Composite Index recently found support at their respective 50-day moving average (DMA) lines. Any subsequent losses violating their short-term averages and recent lows would obviously bode poorly for the market outlook (M criteria).
The July 2011 issue of CANSLIM.net News is available (click here) and the Q2 2011 CANSLIM.net Webcast is also still available "ON DEMAND" to UPGRADED MEMBERS ONLY - (CLICK HERE).
PICTURED: The Dow Jones Industrial Average is consolidating -2.9% off its 2011 high and -11.95% off its October 2007 all-time high.
|
 Kenneth J. Gruneisen started out as a licensed stockbroker in August 1987, a couple of months prior to the historic stock market crash that took the Dow Jones Industrial Average down -22.6% in a single day. He has published daily fact-based fundamental and technical analysis on high-ranked stocks online for two decades. Through FACTBASEDINVESTING.COM, Kenneth provides educational articles, news, market commentary, and other information regarding proven investment systems that work in good times and bad.
Comments contained in the body of this report are technical opinions only and are not necessarily those of Gruneisen Growth Corp. The material herein has been obtained from sources believed to be reliable and accurate, however, its accuracy and completeness cannot be guaranteed. Our firm, employees, and customers may effect transactions, including transactions contrary to any recommendation herein, or have positions in the securities mentioned herein or options with respect thereto. Any recommendation contained in this report may not be suitable for all investors and it is not to be deemed an offer or solicitation on our part with respect to the purchase or sale of any securities. |
|
 |
Financial Groups Still Sputtering
Kenneth J. Gruneisen - Passed the CAN SLIM® Master's Exam
The Broker/Dealer Index ($XBD -0.52%) and Bank Index ($BKX -0.36%) inched lower on Tuesday. Energy-related shares faced modest losses as the Integrated Oil Index ($XOI -0.46%) and Oil Services Index ($OSX -0.10%) edged lower. The Retail Index ($RLX +0.08%) held its ground along with defensive groups including the Healthcare Index ($HMO +0.05%) and Gold & Silver Index ($XAU +0.17%). The Internet Index ($IIX +0.71%), Networking Index ($NWX +0.80%), and Semiconductor Index ($SOX +0.84%) posted modest gains while the Biotechnology Index ($BTK -1.98%) was the clear laggard group in the tech sector.
Charts courtesy www.stockcharts.com
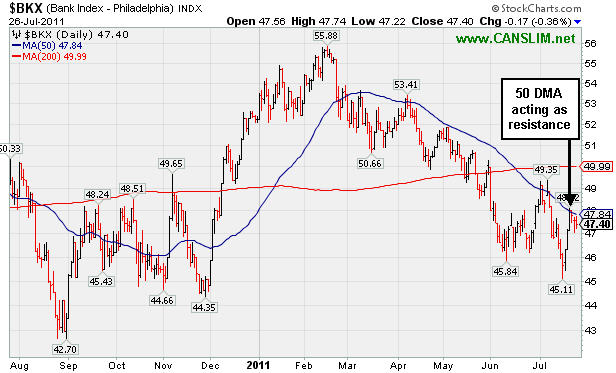
PICTURED: The Bank Index ($BKX -0.36%) has encountered resistance at its 50-day moving average line. Financial groups' weakness continues to bode poorly for the broader market outlook.
| Oil Services |
$OSX |
279.05 |
-0.28 |
-0.10% |
+13.84% |
| Healthcare |
$HMO |
2,377.95 |
+1.09 |
+0.05% |
+40.54% |
| Integrated Oil |
$XOI |
1,335.16 |
-6.18 |
-0.46% |
+10.06% |
| Semiconductor |
$SOX |
406.47 |
+3.39 |
+0.84% |
-1.30% |
| Networking |
$NWX |
292.63 |
+2.32 |
+0.80% |
+4.31% |
| Internet |
$IIX |
319.16 |
+2.26 |
+0.71% |
+3.71% |
| Broker/Dealer |
$XBD |
108.39 |
-0.56 |
-0.52% |
-10.80% |
| Retail |
$RLX |
545.64 |
+0.46 |
+0.08% |
+7.33% |
| Gold & Silver |
$XAU |
218.84 |
+0.37 |
+0.17% |
-3.42% |
| Bank |
$BKX |
47.40 |
-0.17 |
-0.36% |
-9.21% |
| Biotech |
$BTK |
1,396.31 |
-28.14 |
-1.98% |
+7.60% |
|
|
|
 |
Confirming Gains Did Not Trigger Fresh Buy Signal
Kenneth J. Gruneisen - Passed the CAN SLIM® Master's Exam
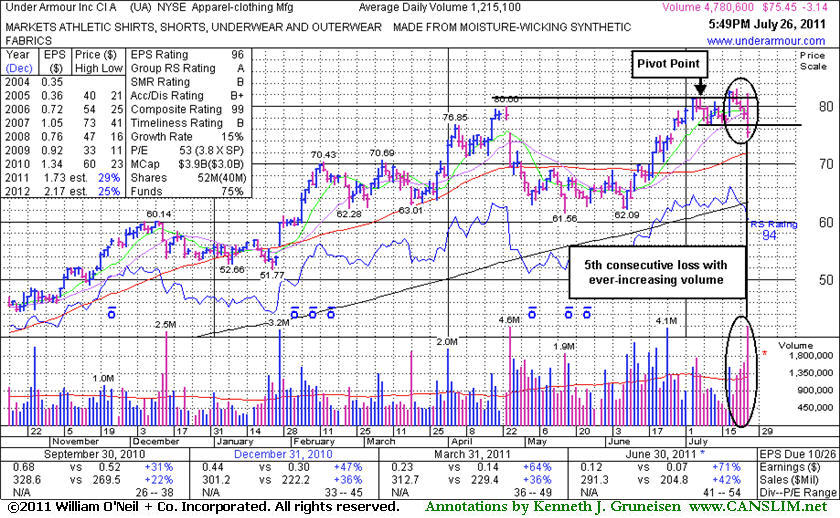
Under Armour Inc (UA -$3.14 or -4.00% to $75.45) reported earnings +71% on +42% sales revenues for the quarter ended June 30, 2011 versus the year ago period, showing impressive acceleration in sales and earnings increases, sequentially. However, today its color code was changed to green after enduring more distributional pressure and slumping more than -7% below its pivot point with a 5th consecutive loss on ever-increasing volume. It did not confirm a proper technical buy signal since featured in yellow in the 7/19/11 mid-day report. While above average demand drove it to a new high, the unconvincing volume total on 7/19/11 (below the minimum guideline of +40-50% above average volume) left disciplined investors to wonder where the enthusiastic buyers were hiding. Subsequent confirming gains never materialized. Volume and volatility often increase near earnings news, but the loss on even heavier volume and weak finish made it clear today that the institutional crowd was not accumulating this high-ranked leader from the Apparel - Clothing Mfg group's shares.
The number of top-rated funds owning its shares rose from 308 in Mar '10 to 403 in June '11, a reassuring sign concerning the I criteria. Earlier notes had acknowledged the downward turn in annual earnings (A criteria) in FY '08, a concern with respect to the fact-based investment system. UA found support near earlier lows in the $62 area after it was dropped from the Featured Stocks list on 5/03/11. Its last appearance in this FSU section was on 4/29/11 with an annotated graph under the headline, "Overhead Supply Can Be the Source of Resistance", as damaging losses with above average volume led to a close below its 50-day moving average (DMA) line and under prior chart highs, raising concerns and triggering a technical sell signal. Volume-driven gains and gaps up during its subsequent rebound were bullish signs.
Rather than bargain hunting, disciplined investors might sooner consider any fresh breakouts that might emerge. Keep in mind that UA may still dig its heels in and trade higher, but disciplined investors will wait for signs of heavy new institutional buying demand before considering new buying efforts.
|
|
|
Color Codes Explained :
Y - Better candidates highlighted by our
staff of experts.
G - Previously featured
in past reports as yellow but may no longer be buyable under the
guidelines.
***Last / Change / Volume data in this table is the closing quote data***
Symbol/Exchange
Company Name
Industry Group |
PRICE |
CHANGE
(%Change) |
Day High |
Volume
(% DAV)
(% 50 day avg vol) |
52 Wk Hi
% From Hi |
Featured
Date |
Price
Featured |
Pivot Featured |
|
Max Buy |
ATHN
-
NASDAQ
Athenahealth Inc
DIVERSIFIED SERVICES - Business/Management Services
|
$57.76
|
-0.62
-1.06% |
$59.49
|
1,199,328
272.95% of 50 DAV
50 DAV is 439,400
|
$60.29
-4.20%
|
7/22/2011
|
$57.30
|
PP = $50.66
|
|
MB = $53.19
|
 Most Recent Note - 7/26/2011 12:24:59 PM
G - Holding its ground stubbornly at all-time highs since highlighted in yellow in the 7/22/11 mid-day report (read here), a session marked by 11 times average volume as its considerable "breakaway gap" cleared previously noted resistance in the $50 area. Reported earnings +83% on +33% sales revenues for the quarter ended June 30, 2011 versus the year ago period. The C criteria is satisfied by the past 4 quarterly comparisons showing solid sales and earnings increases above the +25% guideline. It rallied above its 50 and 200 DMA lines with considerable volume-driven gains in recent weeks during its long base pattern. Color code is changed to green. Disciplined investors are careful to not chase extended stocks, however a breakaway gap is one noted exception to the regular guidelines for buying stocks no more than 5% above a prior high or pivot point. Always limit losses if a stock falls -7% from your buy price.
There are no Featured Stock Updates™ available for this stock at this time. You may request one by clicking the Request a New Note link below
View all notes |
Alert me of new notes |
CANSLIM.net Company Profile |
SEC |
Zacks Reports |
StockTalk |
News |
Chart |
Request a new note
C
A N
S L
I M


|
BIDU
-
NASDAQ
Baidu Inc Ads
INTERNET - Internet Information Providers
|
$164.36
|
+7.82
5.00% |
$165.96
|
17,766,237
196.99% of 50 DAV
50 DAV is 9,018,700
|
$157.90
4.09%
|
7/26/2011
|
$164.32
|
PP = $156.14
|
|
MB = $163.95
|
Most Recent Note - 7/26/2011 12:45:07 PM
Y - Gapped up today and hit a new 52-week high, rising from a 14-week cup shaped base without a handle. No resistance remains due to overhead supply, however, after its small breakaway gap. Color code is changed to yellow with pivot point cited based on its 4/28/11 high plus 10 cents. After this high-ranked Internet - Content firm was dropped from the Featured Stocks list on 5/13/11 it subsequently fell from $131 to $114 and tested support at its long-term 200 DMA line before rebounding impressively. It has maintained a track record of strong quarterly sales revenues and earnings increases.
>>> The latest Featured Stock Update with an annotated graph appeared on 5/9/2011. Click here.
View all notes |
Alert me of new notes |
CANSLIM.net Company Profile |
SEC |
Zacks Reports |
StockTalk |
News |
Chart |
Request a new note
C
A N
S L
I M
|
CACC
-
NASDAQ
Credit Acceptance Corp
FINANCIAL SERVICES - Credit Services
|
$80.82
|
-1.69
-2.05% |
$83.11
|
25,566
66.41% of 50 DAV
50 DAV is 38,500
|
$86.87
-6.96%
|
6/2/2011
|
$76.10
|
PP = $82.39
|
|
MB = $86.51
|
Most Recent Note - 7/26/2011 4:46:43 PM
Y - Today's loss on light volume led to a close below its pivot point and just under the old high closes prior to its volume-driven 6/30/11 gain, raising some concerns. Important support to watch now is its 50 DMA line. Due to report earnings results on Monday, August 1st.
>>> The latest Featured Stock Update with an annotated graph appeared on 6/27/2011. Click here.
View all notes |
Alert me of new notes |
CANSLIM.net Company Profile |
SEC |
Zacks Reports |
StockTalk |
News |
Chart |
Request a new note
C
A N
S L
I M
|
CMG
-
NYSE
Chipotle Mexican Grill
LEISURE - Restaurants
|
$331.40
|
-3.06
-0.91% |
$336.88
|
466,147
57.76% of 50 DAV
50 DAV is 807,000
|
$337.32
-1.76%
|
4/1/2011
|
$274.00
|
PP = $275.10
|
|
MB = $288.86
|
Most Recent Note - 7/26/2011 4:47:45 PM
G - Quietly hovering at all-time highs this week, extended from any sound base pattern. Reported earnings per share +12% on +22% sales revenues for the quarter ended June 30, 2011 versus the year ago period. Fundamentals have raised concern with its 2nd consecutive quarterly comparison with earnings below the +25% guideline.
>>> The latest Featured Stock Update with an annotated graph appeared on 7/8/2011. Click here.
View all notes |
Alert me of new notes |
CANSLIM.net Company Profile |
SEC |
Zacks Reports |
StockTalk |
News |
Chart |
Request a new note
C
A N
S L
I M
|
EZPW
-
NASDAQ
Ezcorp Inc Cl A
SPECIALTY RETAIL - Specialty Retail, Other
|
$32.74
|
-1.07
-3.16% |
$33.74
|
782,956
168.38% of 50 DAV
50 DAV is 465,000
|
$38.66
-15.31%
|
6/13/2011
|
$31.18
|
PP = $33.41
|
|
MB = $35.08
|
Most Recent Note - 7/26/2011 2:57:05 PM
G - Down again today with above average volume behind a 3rd consecutive loss. Raising concerns while slumping under its 50 DMA line and near prior highs previously noted as a support level to watch.
>>> The latest Featured Stock Update with an annotated graph appeared on 7/5/2011. Click here.
View all notes |
Alert me of new notes |
CANSLIM.net Company Profile |
SEC |
Zacks Reports |
StockTalk |
News |
Chart |
Request a new note
C
A N
S L
I M
|
Symbol/Exchange
Company Name
Industry Group |
PRICE |
CHANGE
(%Change) |
Day High |
Volume
(% DAV)
(% 50 day avg vol) |
52 Wk Hi
% From Hi |
Featured
Date |
Price
Featured |
Pivot Featured |
|
Max Buy |
FCFS
-
NASDAQ
First Cash Financial Svs
SPECIALTY RETAIL - Specialty Retail, Other
|
$43.07
|
-0.53
-1.22% |
$44.06
|
207,980
105.84% of 50 DAV
50 DAV is 196,500
|
$44.84
-3.95%
|
5/31/2011
|
$42.00
|
PP = $40.23
|
|
MB = $42.24
|
Most Recent Note - 7/25/2011 6:42:42 PM
G - Consolidating above prior highs in the $40-42 area that define support to watch along with its 50 DMA line.
>>> The latest Featured Stock Update with an annotated graph appeared on 7/18/2011. Click here.
View all notes |
Alert me of new notes |
CANSLIM.net Company Profile |
SEC |
Zacks Reports |
StockTalk |
News |
Chart |
Request a new note
C
A N
S L
I M
|
FOSL
-
NASDAQ
Fossil Inc
CONSUMER DURABLES - Recreational Goods, Other
|
$130.43
|
-2.18
-1.64% |
$134.00
|
559,149
79.95% of 50 DAV
50 DAV is 699,400
|
$134.98
-3.37%
|
2/1/2011
|
$73.30
|
PP = $74.44
|
|
MB = $78.16
|
Most Recent Note - 7/26/2011 4:50:50 PM
G - Hovering quietly at its all-time high. It may produce more climactic gains but it is very extended from its 50 DMA line and prior highs in the $107 area that define support.
>>> The latest Featured Stock Update with an annotated graph appeared on 7/21/2011. Click here.
View all notes |
Alert me of new notes |
CANSLIM.net Company Profile |
SEC |
Zacks Reports |
StockTalk |
News |
Chart |
Request a new note
C
A N
S L
I M
|
HS
-
NYSE
Healthspring Inc
HEALTH SERVICES - Health Care Plans
|
$44.47
|
-0.23
-0.51% |
$45.15
|
420,113
51.23% of 50 DAV
50 DAV is 820,000
|
$48.95
-9.15%
|
6/16/2011
|
$42.44
|
PP = $45.21
|
|
MB = $47.47
|
Most Recent Note - 7/26/2011 4:53:39 PM
Y - Quietly consolidating near prior highs and its 50 DMA line, and losses on light volume this week have it slipping just under its pivot point. Volume has been light behind all gains since 7/05/11.
>>> The latest Featured Stock Update with an annotated graph appeared on 7/11/2011. Click here.
View all notes |
Alert me of new notes |
CANSLIM.net Company Profile |
SEC |
Zacks Reports |
StockTalk |
News |
Chart |
Request a new note
C
A N
S L
I M
|
IPCM
-
NASDAQ
I P C The Hospitalist Co
HEALTH SERVICES - Hospitals
|
$50.93
|
-0.39
-0.76% |
$51.66
|
177,836
205.59% of 50 DAV
50 DAV is 86,500
|
$52.25
-2.53%
|
7/25/2011
|
$51.40
|
PP = $52.35
|
|
MB = $54.97
|
Most Recent Note - 7/26/2011 4:54:35 PM
Y - Encountering some distributional pressure while recently churning near its all-time high. Due to report earnings after the close on Thursday, July 28th. Formed an orderly saucer shaped base. In the 7/25/11 mid-day report its color code was changed to yellow with pivot point cited based on its 52-week high plus 10 cents. Small supply (S criteria) of only 16.4 million outstanding shares can contribute to greater volatility. See the latest FSU analysis for more details and an annotated graph.
>>> The latest Featured Stock Update with an annotated graph appeared on 7/25/2011. Click here.
View all notes |
Alert me of new notes |
CANSLIM.net Company Profile |
SEC |
Zacks Reports |
StockTalk |
News |
Chart |
Request a new note
C
A N
S L
I M
|
LULU
-
NASDAQ
Lululemon Athletica
MANUFACTURING - Textile Manufacturing
|
$62.86
|
+0.96
1.55% |
$63.16
|
2,089,463
50.48% of 50 DAV
50 DAV is 4,139,400
|
$64.49
-2.53%
|
6/21/2011
|
$102.95
|
PP = $101.14
|
|
MB = $106.20
|
Most Recent Note - 7/25/2011 5:37:45 PM
G - Hovering near its all-time high with volume totals cooling, very extended from a sound base. A 2:1 split effective 7/12/11 impacted prices (prior Featured Price, Pivot Point, and Max Buy levels will soon be adjusted).
>>> The latest Featured Stock Update with an annotated graph appeared on 7/15/2011. Click here.
View all notes |
Alert me of new notes |
CANSLIM.net Company Profile |
SEC |
Zacks Reports |
StockTalk |
News |
Chart |
Request a new note
C
A N
S L
I M
|
Symbol/Exchange
Company Name
Industry Group |
PRICE |
CHANGE
(%Change) |
Day High |
Volume
(% DAV)
(% 50 day avg vol) |
52 Wk Hi
% From Hi |
Featured
Date |
Price
Featured |
Pivot Featured |
|
Max Buy |
MWIV
-
NASDAQ
M W I Veterinary Supply
HEALTH SERVICES - Medical Instruments and; Supplies
|
$79.49
|
-1.84
-2.26% |
$81.81
|
55,551
91.37% of 50 DAV
50 DAV is 60,800
|
$86.99
-8.62%
|
7/11/2011
|
$83.39
|
PP = $84.67
|
|
MB = $88.90
|
Most Recent Note - 7/26/2011 5:00:10 PM
G - Enduring mild distributional pressure and slumping under its 50 DMA line today raising concerns, and its color code is changed to green. Volume-driven gains did not recently confirm a proper technical buy signal. Due to report earnings on the morning of Thursday, July 28th.
>>> The latest Featured Stock Update with an annotated graph appeared on 6/30/2011. Click here.
View all notes |
Alert me of new notes |
CANSLIM.net Company Profile |
SEC |
Zacks Reports |
StockTalk |
News |
Chart |
Request a new note
C
A N
S L
I M
|
OTEX
-
NASDAQ
Open Text Corp
INTERNET - Internet Software and Services
|
$69.40
|
+0.54
0.78% |
$69.45
|
260,522
91.70% of 50 DAV
50 DAV is 284,100
|
$72.32
-4.04%
|
6/1/2011
|
$65.86
|
PP = $67.18
|
|
MB = $70.54
|
Most Recent Note - 7/25/2011 5:44:14 PM
Y - Quietly holding its ground above its pivot point yet below its "max buy" level. It stalled after its 7/13/11 technical buy signal, with volume totals cooling since its negative reversal at its all-time high. Prior resistance near $66 defines important chart support to watch above its 50 DMA line.
>>> The latest Featured Stock Update with an annotated graph appeared on 7/20/2011. Click here.
View all notes |
Alert me of new notes |
CANSLIM.net Company Profile |
SEC |
Zacks Reports |
StockTalk |
News |
Chart |
Request a new note
C
A N
S L
I M
|
PRGO
-
NASDAQ
Perrigo Co
DRUGS - Drug Related Products
|
$93.68
|
+0.44
0.47% |
$93.99
|
285,669
63.34% of 50 DAV
50 DAV is 451,000
|
$94.61
-0.98%
|
7/13/2011
|
$92.89
|
PP = $92.40
|
|
MB = $97.02
|
Most Recent Note - 7/25/2011 5:55:58 PM
Y - A strong rally above the pivot point cited with sufficient volume has not yet confirmed a proper technical buy signal. It is considered a riskier late-stage setup that stalled after recently rallying to a new 52-week high. Some may have considered its 7/13/11 gain a technical breakout from a cup shaped base without a handle, but its close in the middle of the day's range left it short of its pivot point.
>>> The latest Featured Stock Update with an annotated graph appeared on 7/13/2011. Click here.
View all notes |
Alert me of new notes |
CANSLIM.net Company Profile |
SEC |
Zacks Reports |
StockTalk |
News |
Chart |
Request a new note
C
A N
S L
I M
|
PSMT
-
NASDAQ
Pricesmart Inc
RETAIL - Drug Stores
|
$60.63
|
-0.23
-0.38% |
$61.93
|
102,640
44.66% of 50 DAV
50 DAV is 229,800
|
$62.27
-2.63%
|
7/22/2011
|
$60.04
|
PP = $61.14
|
|
MB = $64.20
|
Most Recent Note - 7/25/2011 5:58:10 PM
Y - Volume was lighter than average today as it reversed after touching a new high and then closed back below its pivot point cited. Bullish action has continued since noted in the 6/27/11 mid-day report after rising from a 7-week base-on-base type pattern with no resistance due to overhead supply. See the latest FSU analysis for more details and an annotated graph.
>>> The latest Featured Stock Update with an annotated graph appeared on 7/22/2011. Click here.
View all notes |
Alert me of new notes |
CANSLIM.net Company Profile |
SEC |
Zacks Reports |
StockTalk |
News |
Chart |
Request a new note
C
A N
S L
I M
|
QSII
-
NASDAQ
Quality Systems Inc
COMPUTER SOFTWARE and SERVICES - Healthcare Information Service
|
$89.25
|
-0.38
-0.42% |
$90.09
|
141,791
60.47% of 50 DAV
50 DAV is 234,500
|
$92.38
-3.39%
|
7/6/2011
|
$91.26
|
PP = $91.67
|
|
MB = $96.25
|
Most Recent Note - 7/26/2011 4:37:03 PM
G - Small loss today with light volume, perched just -3.4% from its all-time high. Found support at its 50 DMA line during its recent consolidation after failing to trigger a technical buy signal.
>>> The latest Featured Stock Update with an annotated graph appeared on 7/6/2011. Click here.
View all notes |
Alert me of new notes |
CANSLIM.net Company Profile |
SEC |
Zacks Reports |
StockTalk |
News |
Chart |
Request a new note
C
A N
S L
I M
|
Symbol/Exchange
Company Name
Industry Group |
PRICE |
CHANGE
(%Change) |
Day High |
Volume
(% DAV)
(% 50 day avg vol) |
52 Wk Hi
% From Hi |
Featured
Date |
Price
Featured |
Pivot Featured |
|
Max Buy |
UA
-
NYSE
Under Armour Inc Cl A
CONSUMER NON-DURABLES - Textile - Apparel Clothing
|
$75.45
|
-3.14
-4.00% |
$82.17
|
4,780,853
393.45% of 50 DAV
50 DAV is 1,215,100
|
$82.95
-9.04%
|
7/19/2011
|
$81.33
|
PP = $81.52
|
|
MB = $85.60
|
Most Recent Note - 7/26/2011 6:34:15 PM
G - Reported earnings +71% on +42% sales revenues for the quarter ended June 30, 2011 versus the year ago period, showing impressive acceleration in sales and earnings increases, sequentially. Color code was changed to green after enduring more distributional pressure and slumping more than -7% below its pivot point with a 5th consecutive loss on ever-increasing volume. Did not confirm a proper technical buy signal since recently featured in yellow. See latest FSU analysis for more details and a new annotated graph.
>>> The latest Featured Stock Update with an annotated graph appeared on 7/26/2011. Click here.
View all notes |
Alert me of new notes |
CANSLIM.net Company Profile |
SEC |
Zacks Reports |
StockTalk |
News |
Chart |
Request a new note
C
A N
S L
I M
|
ULTA
-
NASDAQ
Ulta Salon Cosm & Frag
SPECIALTY RETAIL - Specialty Retail, Other
|
$64.94
|
-0.15
-0.23% |
$65.96
|
449,657
49.33% of 50 DAV
50 DAV is 911,600
|
$68.80
-5.61%
|
1/6/2011
|
$36.12
|
PP = $37.34
|
|
MB = $39.21
|
Most Recent Note - 7/25/2011 6:36:59 PM
G - Volume totals have been cooling in recent weeks while consolidating, but it is still extended from any sound base pattern and well above its 50 DMA line. It rallied +200% since first featured in yellow at $22.81 in the 3/12/10 mid-day report.
>>> The latest Featured Stock Update with an annotated graph appeared on 7/14/2011. Click here.
View all notes |
Alert me of new notes |
CANSLIM.net Company Profile |
SEC |
Zacks Reports |
StockTalk |
News |
Chart |
Request a new note
C
A N
S L
I M
|
ZAGG
-
NASDAQ
Zagg Inc
SPECIALTY RETAIL - Specialty Retail, Other
|
$16.39
|
+0.11
0.68% |
$16.50
|
1,043,066
43.13% of 50 DAV
50 DAV is 2,418,200
|
$16.90
-3.02%
|
6/1/2011
|
$10.92
|
PP = $10.59
|
|
MB = $11.12
|
Most Recent Note - 7/26/2011 4:41:56 PM
G - Small gain on light volume for another new best-ever close today, getting more extended. No overhead supply remains to act as resistance, however its short V shaped consolidation in recent weeks is not recognized as a sound base pattern. Its 50 DMA line and recent lows define chart support.
>>> The latest Featured Stock Update with an annotated graph appeared on 7/19/2011. Click here.
View all notes |
Alert me of new notes |
CANSLIM.net Company Profile |
SEC |
Zacks Reports |
StockTalk |
News |
Chart |
Request a new note
C
A N
S L
I M
|
|
|
|
THESE ARE NOT BUY RECOMMENDATIONS!
Comments contained in the body of this report are technical
opinions only. The material herein has been obtained
from sources believed to be reliable and accurate, however,
its accuracy and completeness cannot be guaranteed.
This site is not an investment advisor, hence it does
not endorse or recommend any securities or other investments.
Any recommendation contained in this report may not
be suitable for all investors and it is not to be deemed
an offer or solicitation on our part with respect to
the purchase or sale of any securities. All trademarks,
service marks and trade names appearing in this report
are the property of their respective owners, and are
likewise used for identification purposes only.
This report is a service available
only to active Paid Premium Members.
You may opt-out of receiving report notifications
at any time. Questions or comments may be submitted
by writing to Premium Membership Services 665 S.E. 10 Street, Suite 201 Deerfield Beach, FL 33441-5634 or by calling 1-800-965-8307
or 954-785-1121.
|
|
|

