You are not logged in.
This means you
CAN ONLY VIEW reports that were published prior to Monday, March 10, 2025.
You
MUST UPGRADE YOUR MEMBERSHIP if you want to see any current reports.
AFTER MARKET UPDATE - MONDAY, JULY 25TH, 2011
Previous After Market Report Next After Market Report >>>
|
|
|
|
DOW |
-88.36 |
12,592.80 |
-0.70% |
|
Volume |
761,273,150 |
+3% |
|
Volume |
1,569,285,860 |
-4% |
|
NASDAQ |
-16.03 |
2,842.80 |
-0.56% |
|
Advancers |
584 |
19% |
|
Advancers |
608 |
23% |
|
S&P 500 |
-7.59 |
1,337.43 |
-0.56% |
|
Decliners |
2,436 |
78% |
|
Decliners |
2,010 |
75% |
|
Russell 2000 |
-10.42 |
831.40 |
-1.24% |
|
52 Wk Highs |
59 |
|
|
52 Wk Highs |
43 |
|
|
S&P 600 |
-4.83 |
447.78 |
-1.07% |
|
52 Wk Lows |
41 |
|
|
52 Wk Lows |
29 |
|
|
 |
Major Averages Pull Back With Mixed Volume Totals
Kenneth J. Gruneisen - Passed the CAN SLIM® Master's Exam
On Monday the three major averages finished with unanimous losses of less than -1%. The volume totals were below average, yet the NYSE volume total was reported slightly higher than Friday's total while the volume was reported lower on the Nasdaq exchange. Decliners beat advancers by more than 4-1 on the NYSE and by more than 3-1 on the Nasdaq exchange. New 52-week highs outnumbered new 52-week lows on the NYSE and on the Nasdaq exchange. There were 32 high-ranked companies from the CANSLIM.net Leaders List that made new 52-week highs and appeared on the CANSLIM.net BreakOuts Page, down from Friday's total of 42 stocks. There were only 3 gainers out of the 17 high-ranked leaders currently included on the Featured Stocks Page.
European markets were modestly lower after Moody's cut Greece's debt rating three steps. Gold reached a new record of $1,624.30 per ounce. Politicians in Washington remain at a stalemate over raising the nation's debt limit and the standoff threatens to cause a downgrade of the U.S. credit rating. Some pundits have said the U.S. market might be due for consolidation regardless of the debt ceiling issue. The S&P 500 on Friday rose to within 1.4% of a three-year high.
It will be another busy week for earnings. Monday's results had little in the way of positive impact. Kimberly Clark (KMB -2.09%) beat expectations but its profit declined from a year ago because of higher commodity costs. Baker Hughes Inc (BHI +0.05%) was little changed even though it posted better-than-expected earnings. Research In Motion Ltd (RIMM -4.44%) fell after announcing it will cut 2,000 positions. E*Trade Financial (ETFC +5.63%) announced plans to explore a sale of the company. TD Ameritrade Holding Corp (AMTD +1.78%) rose following a report that it may consider a bid for E*Trade Financial.
Utility stocks valued for their dividends, including FirstEnergy Corp (FE +2.21%), held up well following several analyst upgrades. Tenet Healthcare Corp (THC -3.83%) and other hospital stocks weakened after HCA Holdings Inc (HCA -19.19%) posted earnings that missed analyst estimates. The number of hospital patients increased, but those patients sought less expensive procedures.
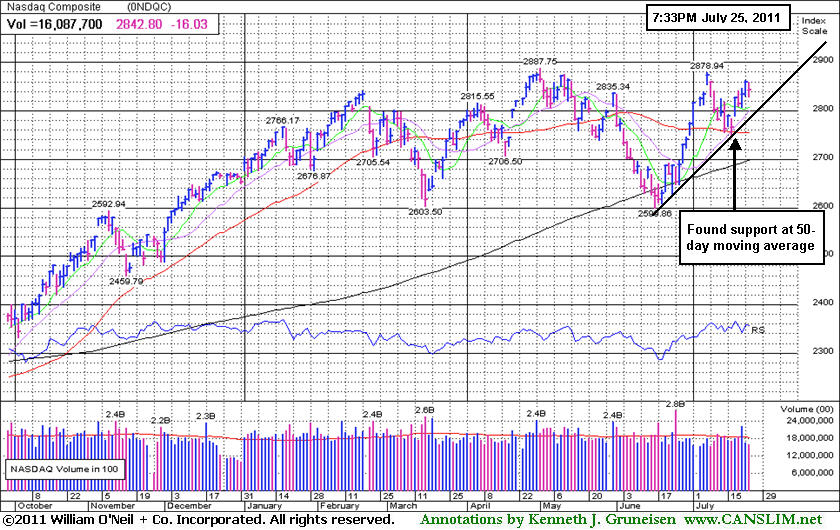
The S&P 500 Index, Dow Jones Industrial Average, and Nasdaq Composite Index all have found support at their respective 50-day moving average (DMA) lines. Any subsequent losses violating their short-term averages and recent lows would obviously bode poorly for the market outlook.
The July 2011 issue of CANSLIM.net News is now available (click here) and the Q2 2011 CANSLIM.net Webcast is also still available "ON DEMAND" to UPGRADED MEMBERS ONLY - (CLICK HERE).
PICTURED: The Nasdaq Composite Index found support near its 50-day moving average (DMA) line on its last pullback.
|
 Kenneth J. Gruneisen started out as a licensed stockbroker in August 1987, a couple of months prior to the historic stock market crash that took the Dow Jones Industrial Average down -22.6% in a single day. He has published daily fact-based fundamental and technical analysis on high-ranked stocks online for two decades. Through FACTBASEDINVESTING.COM, Kenneth provides educational articles, news, market commentary, and other information regarding proven investment systems that work in good times and bad.
Comments contained in the body of this report are technical opinions only and are not necessarily those of Gruneisen Growth Corp. The material herein has been obtained from sources believed to be reliable and accurate, however, its accuracy and completeness cannot be guaranteed. Our firm, employees, and customers may effect transactions, including transactions contrary to any recommendation herein, or have positions in the securities mentioned herein or options with respect thereto. Any recommendation contained in this report may not be suitable for all investors and it is not to be deemed an offer or solicitation on our part with respect to the purchase or sale of any securities. |
|
 |
HMO Index Sank Below 50-Day Moving Average With Loss Today
Kenneth J. Gruneisen - Passed the CAN SLIM® Master's Exam
The Biotechnology Index ($BTK -2.17%) and Healthcare Index ($HMO -2.02%) were Monday's worst laggards. The tech sector also had a negative bias as the Networking Index ($NWX -1.58%) and Semiconductor Index ($SOX -1.34%) outpaced the Internet Index ($IIX -0.38%) to the downside. The Broker/Dealer Index ($XBD -0.23%) and Bank Index ($BKX -0.52%) had a slightly negative bias and the Retail Index ($RLX -0.72%) also put modest negative pressure on the major averages. The Gold & Silver Index ($XAU -0.86%) backpedaled and energy-related shares edged lower as the Integrated Oil Index ($XOI -0.21%) and Oil Services Index ($OSX -0.16%) ended with tiny losses.
Charts courtesy www.stockcharts.com
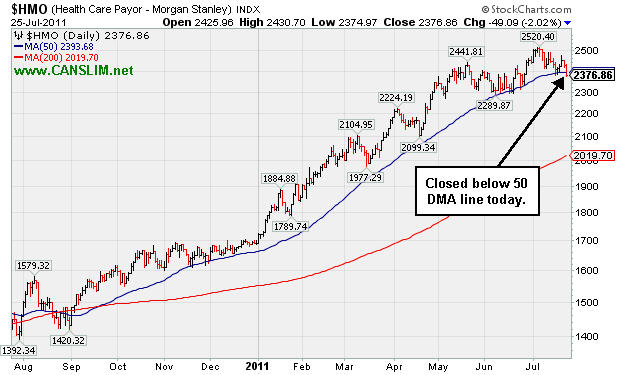
PICTURED: The Healthcare Index ($HMO -2.02%) closed below its 50-day moving average (DMA) line. After putting up solid gains which made it a standout gainer this year, the technical deterioration may signal the beginning of a longer and deeper consolidation in healthcare group.
| Oil Services |
$OSX |
279.33 |
-0.46 |
-0.16% |
+13.96% |
| Healthcare |
$HMO |
2,376.86 |
-49.09 |
-2.02% |
+40.48% |
| Integrated Oil |
$XOI |
1,341.34 |
-2.78 |
-0.21% |
+10.57% |
| Semiconductor |
$SOX |
403.08 |
-5.48 |
-1.34% |
-2.12% |
| Networking |
$NWX |
290.31 |
-4.67 |
-1.58% |
+3.48% |
| Internet |
$IIX |
316.90 |
-1.22 |
-0.38% |
+2.98% |
| Broker/Dealer |
$XBD |
108.95 |
-0.25 |
-0.23% |
-10.34% |
| Retail |
$RLX |
545.18 |
-3.95 |
-0.72% |
+7.24% |
| Gold & Silver |
$XAU |
218.47 |
-1.89 |
-0.86% |
-3.58% |
| Bank |
$BKX |
47.57 |
-0.25 |
-0.52% |
-8.89% |
| Biotech |
$BTK |
1,424.45 |
-31.65 |
-2.17% |
+9.77% |
|
|
|
 |
Hospital Services Firm Near Highs Ahead of Earnings Report
Kenneth J. Gruneisen - Passed the CAN SLIM® Master's Exam
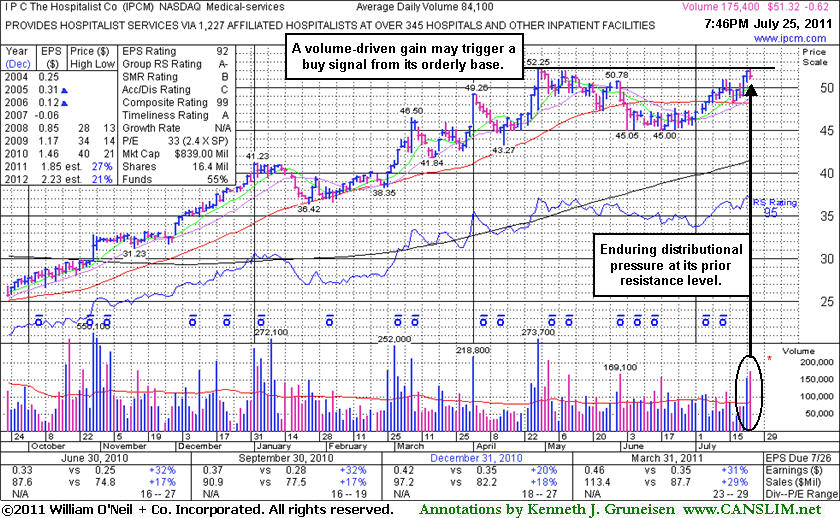
I P C The Hospitalist Co (IPCM -1.19%) encountered distributional pressure today when challenging prior resistance. It is due to report earnings after the close on Thursday, July 28th. In today's mid-day report its color code was changed to yellow with pivot point cited based on its 52-week high plus 10 cents. It has formed an orderly saucer shaped base since noted in the 5/11/11 mid-day report. It reported +31% earnings on +29% sales revenues for the quarter ended March 31, 2011 versus the year ago period. Its annual earnings (A criteria) growth has been impressive since January 2008 beginning of its public trading history. Its small supply (S criteria) of only 16.4 million outstanding shares can contribute to greater volatility. The number of top-rated funds owning its shares rose from 272 in Sep '10 to 293 in Mar '11, but fell to 281 in Jun '11. Overall the ongoing trend as been indicative of greater institutional ownership (I criteria).
Volume and volatility often increase near earnings news. Disciplined investors may be careful about any stock near earnings news, especially if it has not even triggered a convincing technical buy signal. Patience may be paramount for now, and while this high-ranked leader is setting up it makes a good candidate for investors' watch lists. A stock should always trigger a convincing technical buy signal before it is bought. Concerns have been raised by breakdowns in other Medical stocks including Edwards Lifesciences Corp (EW), which had been on the Featured Stocks list and was recently dropped after failing to trigger a sound buy signal, and HCA Holdings Inc (HCA -19.19%) which is mentioned in today's Market Commentary section after an earnings disappointment and considerable loss. Both serve as a reminder to always play good defense and limit losses if any stock you own ever gets into trouble. Strictly limiting losses at -7% is the only way to eliminate the chances of even greater losses.
|
|
|
Color Codes Explained :
Y - Better candidates highlighted by our
staff of experts.
G - Previously featured
in past reports as yellow but may no longer be buyable under the
guidelines.
***Last / Change / Volume data in this table is the closing quote data***
Symbol/Exchange
Company Name
Industry Group |
PRICE |
CHANGE
(%Change) |
Day High |
Volume
(% DAV)
(% 50 day avg vol) |
52 Wk Hi
% From Hi |
Featured
Date |
Price
Featured |
Pivot Featured |
|
Max Buy |
ATHN
-
NASDAQ
Athenahealth Inc
DIVERSIFIED SERVICES - Business/Management Services
|
$58.38
|
+1.29
2.26% |
$58.70
|
1,191,334
283.92% of 50 DAV
50 DAV is 419,600
|
$60.29
-3.17%
|
7/22/2011
|
$57.30
|
PP = $50.66
|
|
MB = $53.19
|
 Most Recent Note - 7/25/2011 1:04:24 PM
Y - Up today with above average volume. It was highlighted in yellow in the 7/22/11 mid-day report (read here) and finished the session with 11 times average volume. Reported earnings +83% on +33% sales revenues for the quarter ended June 30, 2011 versus the year ago period. The C criteria is satisfied by the past 4 quarterly comparisons showing solid sales and earnings increases above the +25% guideline. Its considerable "breakaway gap" up for a new all-time high helped it blast above previously noted resistance in the $50 area. It rallied above its 50 and 200 DMA lines with considerable volume-driven gains in recent weeks during its long base pattern. Disciplined investors are careful to not chase extended stocks, however a breakaway gap is one noted exception to the regular guidelines for buying stocks no more than 5% above a prior high or pivot point. Always limit losses if a stock falls -7% from your buy price.
There are no Featured Stock Updates™ available for this stock at this time. You may request one by clicking the Request a New Note link below
View all notes |
Alert me of new notes |
CANSLIM.net Company Profile |
SEC |
Zacks Reports |
StockTalk |
News |
Chart |
Request a new note
C
A N
S L
I M


|
CACC
-
NASDAQ
Credit Acceptance Corp
FINANCIAL SERVICES - Credit Services
|
$82.51
|
-0.40
-0.48% |
$84.14
|
22,056
56.55% of 50 DAV
50 DAV is 39,000
|
$86.87
-5.02%
|
6/2/2011
|
$76.10
|
PP = $82.39
|
|
MB = $86.51
|
Most Recent Note - 7/21/2011 3:21:09 PM
Y - Today's 3rd consecutive gain on light volume continues its quiet consolidation above prior high closes that define support to watch above its 50 DMA line.
>>> The latest Featured Stock Update with an annotated graph appeared on 6/27/2011. Click here.
View all notes |
Alert me of new notes |
CANSLIM.net Company Profile |
SEC |
Zacks Reports |
StockTalk |
News |
Chart |
Request a new note
C
A N
S L
I M
|
CMG
-
NYSE
Chipotle Mexican Grill
LEISURE - Restaurants
|
$334.46
|
-1.06
-0.32% |
$337.32
|
541,040
66.42% of 50 DAV
50 DAV is 814,600
|
$336.71
-0.67%
|
4/1/2011
|
$274.00
|
PP = $275.10
|
|
MB = $288.86
|
Most Recent Note - 7/22/2011 12:55:26 PM
G - Churned above average volume while hovering at all-time highs this week. Reported earnings per share +12% on +22% sales revenues for the quarter ended June 30, 2011 versus the year ago period. Fundamentals have raised concern with its 2nd consecutive quarterly comparison with earnings below the +25% guideline. It is also extended from any sound base pattern.
>>> The latest Featured Stock Update with an annotated graph appeared on 7/8/2011. Click here.
View all notes |
Alert me of new notes |
CANSLIM.net Company Profile |
SEC |
Zacks Reports |
StockTalk |
News |
Chart |
Request a new note
C
A N
S L
I M
|
EZPW
-
NASDAQ
Ezcorp Inc Cl A
SPECIALTY RETAIL - Specialty Retail, Other
|
$33.81
|
-0.43
-1.26% |
$35.27
|
829,231
182.93% of 50 DAV
50 DAV is 453,300
|
$38.66
-12.55%
|
6/13/2011
|
$31.18
|
PP = $33.41
|
|
MB = $35.08
|
Most Recent Note - 7/25/2011 6:41:18 PM
G - Down again today with above average volume, slumping near its 50 DMA line and prior highs previously noted as a support level to watch.
>>> The latest Featured Stock Update with an annotated graph appeared on 7/5/2011. Click here.
View all notes |
Alert me of new notes |
CANSLIM.net Company Profile |
SEC |
Zacks Reports |
StockTalk |
News |
Chart |
Request a new note
C
A N
S L
I M
|
FCFS
-
NASDAQ
First Cash Financial Svs
SPECIALTY RETAIL - Specialty Retail, Other
|
$43.60
|
+0.49
1.14% |
$44.27
|
245,608
127.26% of 50 DAV
50 DAV is 193,000
|
$44.84
-2.77%
|
5/31/2011
|
$42.00
|
PP = $40.23
|
|
MB = $42.24
|
Most Recent Note - 7/25/2011 6:42:42 PM
G - Consolidating above prior highs in the $40-42 area that define support to watch along with its 50 DMA line.
>>> The latest Featured Stock Update with an annotated graph appeared on 7/18/2011. Click here.
View all notes |
Alert me of new notes |
CANSLIM.net Company Profile |
SEC |
Zacks Reports |
StockTalk |
News |
Chart |
Request a new note
C
A N
S L
I M
|
Symbol/Exchange
Company Name
Industry Group |
PRICE |
CHANGE
(%Change) |
Day High |
Volume
(% DAV)
(% 50 day avg vol) |
52 Wk Hi
% From Hi |
Featured
Date |
Price
Featured |
Pivot Featured |
|
Max Buy |
FOSL
-
NASDAQ
Fossil Inc
CONSUMER DURABLES - Recreational Goods, Other
|
$132.61
|
-0.40
-0.30% |
$134.50
|
386,822
54.48% of 50 DAV
50 DAV is 710,000
|
$134.98
-1.76%
|
2/1/2011
|
$73.30
|
PP = $74.44
|
|
MB = $78.16
|
Most Recent Note - 7/21/2011 5:44:42 PM
G - Quietly perched at its all-time high. It may produce more climactic gains but it is very extended from its 50 DMA line and prior highs in the $107 area that define support.
>>> The latest Featured Stock Update with an annotated graph appeared on 7/21/2011. Click here.
View all notes |
Alert me of new notes |
CANSLIM.net Company Profile |
SEC |
Zacks Reports |
StockTalk |
News |
Chart |
Request a new note
C
A N
S L
I M
|
HS
-
NYSE
Healthspring Inc
HEALTH SERVICES - Health Care Plans
|
$44.70
|
-0.57
-1.26% |
$45.52
|
682,020
82.24% of 50 DAV
50 DAV is 829,300
|
$48.95
-8.68%
|
6/16/2011
|
$42.44
|
PP = $45.21
|
|
MB = $47.47
|
Most Recent Note - 7/20/2011 6:30:09 PM
Y - Quietly consolidating above prior highs and its pivot point. Volume has been light behind all gains since 7/05/11. Prior resistance near $45 coinciding with its 50 DMA line defines an important support level to watch.
>>> The latest Featured Stock Update with an annotated graph appeared on 7/11/2011. Click here.
View all notes |
Alert me of new notes |
CANSLIM.net Company Profile |
SEC |
Zacks Reports |
StockTalk |
News |
Chart |
Request a new note
C
A N
S L
I M
|
IPCM
-
NASDAQ
I P C The Hospitalist Co
HEALTH SERVICES - Hospitals
|
$51.32
|
-0.62
-1.19% |
$52.23
|
194,254
230.98% of 50 DAV
50 DAV is 84,100
|
$52.25
-1.78%
|
7/25/2011
|
$51.40
|
PP = $52.35
|
|
MB = $54.97
|
Most Recent Note - 7/25/2011 8:11:08 PM
Y - Due to report earnings after the close on Thursday, July 28th. It has formed an orderly saucer shaped base, and in today's mid-day report its color code was changed to yellow with pivot point cited based on its 52-week high plus 10 cents. Small supply (S criteria) of only 16.4 million outstanding shares can contribute to greater volatility. See the latest FSU analysis for more details and an annotated graph.
>>> The latest Featured Stock Update with an annotated graph appeared on 7/25/2011. Click here.
View all notes |
Alert me of new notes |
CANSLIM.net Company Profile |
SEC |
Zacks Reports |
StockTalk |
News |
Chart |
Request a new note
C
A N
S L
I M
|
LULU
-
NASDAQ
Lululemon Athletica
MANUFACTURING - Textile Manufacturing
|
$61.90
|
-1.54
-2.43% |
$63.00
|
2,065,218
49.97% of 50 DAV
50 DAV is 4,132,800
|
$64.49
-4.02%
|
6/21/2011
|
$102.95
|
PP = $101.14
|
|
MB = $106.20
|
Most Recent Note - 7/25/2011 5:37:45 PM
G - Hovering near its all-time high with volume totals cooling, very extended from a sound base. A 2:1 split effective 7/12/11 impacted prices (prior Featured Price, Pivot Point, and Max Buy levels will soon be adjusted).
>>> The latest Featured Stock Update with an annotated graph appeared on 7/15/2011. Click here.
View all notes |
Alert me of new notes |
CANSLIM.net Company Profile |
SEC |
Zacks Reports |
StockTalk |
News |
Chart |
Request a new note
C
A N
S L
I M
|
MWIV
-
NASDAQ
M W I Veterinary Supply
HEALTH SERVICES - Medical Instruments and; Supplies
|
$81.33
|
-1.78
-2.14% |
$82.96
|
47,552
77.45% of 50 DAV
50 DAV is 61,400
|
$86.99
-6.51%
|
7/11/2011
|
$83.39
|
PP = $84.67
|
|
MB = $88.90
|
Most Recent Note - 7/25/2011 5:40:04 PM
Y - Enduring mild distribution while hovering near its 50 DMA line and perched within -6.5% of all-time highs. Volume-driven gains are needed to confirm a proper technical buy signal.
>>> The latest Featured Stock Update with an annotated graph appeared on 6/30/2011. Click here.
View all notes |
Alert me of new notes |
CANSLIM.net Company Profile |
SEC |
Zacks Reports |
StockTalk |
News |
Chart |
Request a new note
C
A N
S L
I M
|
Symbol/Exchange
Company Name
Industry Group |
PRICE |
CHANGE
(%Change) |
Day High |
Volume
(% DAV)
(% 50 day avg vol) |
52 Wk Hi
% From Hi |
Featured
Date |
Price
Featured |
Pivot Featured |
|
Max Buy |
OTEX
-
NASDAQ
Open Text Corp
INTERNET - Internet Software and Services
|
$68.86
|
-0.62
-0.89% |
$69.17
|
186,761
65.37% of 50 DAV
50 DAV is 285,700
|
$72.32
-4.78%
|
6/1/2011
|
$65.86
|
PP = $67.18
|
|
MB = $70.54
|
Most Recent Note - 7/25/2011 5:44:14 PM
Y - Quietly holding its ground above its pivot point yet below its "max buy" level. It stalled after its 7/13/11 technical buy signal, with volume totals cooling since its negative reversal at its all-time high. Prior resistance near $66 defines important chart support to watch above its 50 DMA line.
>>> The latest Featured Stock Update with an annotated graph appeared on 7/20/2011. Click here.
View all notes |
Alert me of new notes |
CANSLIM.net Company Profile |
SEC |
Zacks Reports |
StockTalk |
News |
Chart |
Request a new note
C
A N
S L
I M
|
PRGO
-
NASDAQ
Perrigo Co
DRUGS - Drug Related Products
|
$93.24
|
-0.44
-0.47% |
$94.42
|
332,190
73.30% of 50 DAV
50 DAV is 453,200
|
$94.61
-1.45%
|
7/13/2011
|
$92.89
|
PP = $92.40
|
|
MB = $97.02
|
Most Recent Note - 7/25/2011 5:55:58 PM
Y - A strong rally above the pivot point cited with sufficient volume has not yet confirmed a proper technical buy signal. It is considered a riskier late-stage setup that stalled after recently rallying to a new 52-week high. Some may have considered its 7/13/11 gain a technical breakout from a cup shaped base without a handle, but its close in the middle of the day's range left it short of its pivot point.
>>> The latest Featured Stock Update with an annotated graph appeared on 7/13/2011. Click here.
View all notes |
Alert me of new notes |
CANSLIM.net Company Profile |
SEC |
Zacks Reports |
StockTalk |
News |
Chart |
Request a new note
C
A N
S L
I M
|
PSMT
-
NASDAQ
Pricesmart Inc
RETAIL - Drug Stores
|
$60.86
|
-0.34
-0.56% |
$62.27
|
206,641
89.96% of 50 DAV
50 DAV is 229,700
|
$61.58
-1.17%
|
7/22/2011
|
$60.04
|
PP = $61.14
|
|
MB = $64.20
|
Most Recent Note - 7/25/2011 5:58:10 PM
Y - Volume was lighter than average today as it reversed after touching a new high and then closed back below its pivot point cited. Bullish action has continued since noted in the 6/27/11 mid-day report after rising from a 7-week base-on-base type pattern with no resistance due to overhead supply. See the latest FSU analysis for more details and an annotated graph.
>>> The latest Featured Stock Update with an annotated graph appeared on 7/22/2011. Click here.
View all notes |
Alert me of new notes |
CANSLIM.net Company Profile |
SEC |
Zacks Reports |
StockTalk |
News |
Chart |
Request a new note
C
A N
S L
I M
|
QSII
-
NASDAQ
Quality Systems Inc
COMPUTER SOFTWARE and SERVICES - Healthcare Information Service
|
$89.63
|
-1.16
-1.28% |
$90.57
|
130,657
55.62% of 50 DAV
50 DAV is 234,900
|
$92.38
-2.98%
|
7/6/2011
|
$91.26
|
PP = $91.67
|
|
MB = $96.25
|
Most Recent Note - 7/21/2011 3:01:34 PM
G - Small gap up gain today without great volume, rallying just -3% from its all-time high. Found support at its 50 DMA line during its recent consolidation after failing to trigger a technical buy signal.
>>> The latest Featured Stock Update with an annotated graph appeared on 7/6/2011. Click here.
View all notes |
Alert me of new notes |
CANSLIM.net Company Profile |
SEC |
Zacks Reports |
StockTalk |
News |
Chart |
Request a new note
C
A N
S L
I M
|
UA
-
NYSE
Under Armour Inc Cl A
CONSUMER NON-DURABLES - Textile - Apparel Clothing
|
$78.59
|
-1.08
-1.36% |
$79.70
|
1,637,951
136.25% of 50 DAV
50 DAV is 1,202,200
|
$82.95
-5.26%
|
7/19/2011
|
$81.33
|
PP = $81.52
|
|
MB = $85.60
|
Most Recent Note - 7/25/2011 6:34:53 PM
Y - Endured distributional pressure with a 4th consecutive loss today on ever increasing volume. Due to report earnings in the morning, Tuesday, July 26th. Its color code was changed to yellow in the 7/19/11 mid-day report with a new pivot point cited after forming a cup-with-handle base pattern, and subsequent gains have not yet confirmed a technical buy signal. UA found support near earlier lows in the $62 area after it was dropped from the Featured Stocks list on 5/03/11 and it has rebounded impressively.

>>> The latest Featured Stock Update with an annotated graph appeared on 4/29/2011. Click here.
View all notes |
Alert me of new notes |
CANSLIM.net Company Profile |
SEC |
Zacks Reports |
StockTalk |
News |
Chart |
Request a new note
C
A N
S L
I M
|
Symbol/Exchange
Company Name
Industry Group |
PRICE |
CHANGE
(%Change) |
Day High |
Volume
(% DAV)
(% 50 day avg vol) |
52 Wk Hi
% From Hi |
Featured
Date |
Price
Featured |
Pivot Featured |
|
Max Buy |
ULTA
-
NASDAQ
Ulta Salon Cosm & Frag
SPECIALTY RETAIL - Specialty Retail, Other
|
$65.09
|
-0.93
-1.41% |
$66.66
|
521,237
57.33% of 50 DAV
50 DAV is 909,200
|
$68.80
-5.39%
|
1/6/2011
|
$36.12
|
PP = $37.34
|
|
MB = $39.21
|
Most Recent Note - 7/25/2011 6:36:59 PM
G - Volume totals have been cooling in recent weeks while consolidating, but it is still extended from any sound base pattern and well above its 50 DMA line. It rallied +200% since first featured in yellow at $22.81 in the 3/12/10 mid-day report.
>>> The latest Featured Stock Update with an annotated graph appeared on 7/14/2011. Click here.
View all notes |
Alert me of new notes |
CANSLIM.net Company Profile |
SEC |
Zacks Reports |
StockTalk |
News |
Chart |
Request a new note
C
A N
S L
I M
|
ZAGG
-
NASDAQ
Zagg Inc
SPECIALTY RETAIL - Specialty Retail, Other
|
$16.28
|
+0.08
0.49% |
$16.43
|
1,095,907
45.13% of 50 DAV
50 DAV is 2,428,200
|
$16.90
-3.67%
|
6/1/2011
|
$10.92
|
PP = $10.59
|
|
MB = $11.12
|
Most Recent Note - 7/25/2011 6:38:19 PM
G - Small gain on light volume for a new best-ever close today, getting more extended. No overhead supply remains to act as resistance, however its short V shaped consolidation in recent weeks is not recognized as a sound base pattern. Its 50 DMA line and recent lows define chart support.
>>> The latest Featured Stock Update with an annotated graph appeared on 7/19/2011. Click here.
View all notes |
Alert me of new notes |
CANSLIM.net Company Profile |
SEC |
Zacks Reports |
StockTalk |
News |
Chart |
Request a new note
C
A N
S L
I M
|
|
|
|
THESE ARE NOT BUY RECOMMENDATIONS!
Comments contained in the body of this report are technical
opinions only. The material herein has been obtained
from sources believed to be reliable and accurate, however,
its accuracy and completeness cannot be guaranteed.
This site is not an investment advisor, hence it does
not endorse or recommend any securities or other investments.
Any recommendation contained in this report may not
be suitable for all investors and it is not to be deemed
an offer or solicitation on our part with respect to
the purchase or sale of any securities. All trademarks,
service marks and trade names appearing in this report
are the property of their respective owners, and are
likewise used for identification purposes only.
This report is a service available
only to active Paid Premium Members.
You may opt-out of receiving report notifications
at any time. Questions or comments may be submitted
by writing to Premium Membership Services 665 S.E. 10 Street, Suite 201 Deerfield Beach, FL 33441-5634 or by calling 1-800-965-8307
or 954-785-1121.
|
|
|

