You are not logged in.
This means you
CAN ONLY VIEW reports that were published prior to Monday, April 14, 2025.
You
MUST UPGRADE YOUR MEMBERSHIP if you want to see any current reports.
AFTER MARKET UPDATE - WEDNESDAY, JULY 23RD, 2014
Previous After Market Report Next After Market Report >>>
|
|
|
|
DOW |
-26.91 |
17,086.63 |
-0.16% |
|
Volume |
569,207,450 |
-0% |
|
Volume |
1,751,609,640 |
+10% |
|
NASDAQ |
+17.68 |
4,473.70 |
+0.40% |
|
Advancers |
1,759 |
56% |
|
Advancers |
1,362 |
48% |
|
S&P 500 |
+3.48 |
1,987.01 |
+0.18% |
|
Decliners |
1,279 |
41% |
|
Decliners |
1,378 |
48% |
|
Russell 2000 |
+1.99 |
1,158.14 |
+0.17% |
|
52 Wk Highs |
183 |
|
|
52 Wk Highs |
75 |
|
|
S&P 600 |
-0.68 |
666.00 |
-0.10% |
|
52 Wk Lows |
26 |
|
|
52 Wk Lows |
37 |
|
|
 |
S&P 500 Index Hit New Record High
Kenneth J. Gruneisen - Passed the CAN SLIM® Master's Exam
Stocks finished higher on Wednesday. The volume totals were mixed, slightly lower than the prior session volume totals on the NYSE and higher on the Nasdaq exchange. Breadth was positive as advancers led decliners by nearly a 3-2 margin on the NYSE while the mix was even on the Nasdaq exchange. There were 47 high-ranked companies from the CANSLIM.net Leaders List that made new 52-week highs and appeared on the CANSLIM.net BreakOuts Page, down from the prior session total of 49 stocks. New 52-week highs outnumbered new 52-week lows on the NYSE and on the Nasdaq exchange. There were gains for 11 of the 13 of the high-ranked companies currently included on the Featured Stocks Page. The market (M criteria) uptrend recently faced pressure, however the latest expansion in leadership has been reassuring. Disciplined investors limit losses and reduce market exposure during rough market periods by selling any stocks which fall more than -7% from their purchase price.
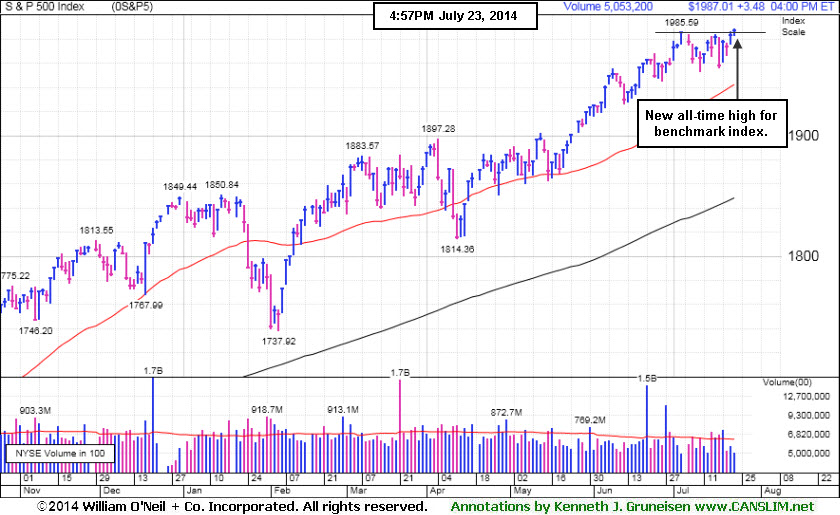
PICTURED: The S&P 500 Index rose to a new all-time high as it gained 3 points to 1,987.
The NASDAQ rose 17 points to 4,473. The Dow declined 26 points to 17,086. A large batch of earnings results helped lift the market and pushed geopolitical concerns to the back burner. Overall, sectors finished mixed. Health care and materials were among the best performing groups. Biogen (BIIB +11.17%) and Intuitive Surgical (ISRG +17.71%) rallied after both companies posted better-than-expected earnings results. Shares of Dow Chemical (DOW +3.04%) gained as the company's second-quarter sales topped analyst estimates amid growth in all of its operating segments.
Gains in technology added to the upside. Apple (AAPL +2.61%) signaled that the long wait for new products is nearing an end which pushed its shares up and overshadowed a smaller-than-expected rise in quarterly revenue. Facebook (FB +2.92%) rose ahead of its profit tally after the close. Industrials limited the session's gains and weighed on the Dow. Boeing (BA -2.34%) sank after posting lower-than-anticipated revenue. Consumer discretionary also declined as Time Warner (TWX -2.90%) fell.
Treasuries declined for the first time in three days. The 10-year note was off 1/32 to yield 2.47%. The 30-year bond fell 7/32 to yield 3.26%.
The CANSLIM.net Featured Stocks Page shows the most action-worthy candidates and their latest notes and a Headline Link directs members to the latest detailed analysis with data-packed graphs annotated by a Certified expert along with links to additional resources. The Premium Member Homepage includes "dynamic archives" to all prior pay reports published. Watch for an announcement via email concerning the next WEBCAST.
|
 Kenneth J. Gruneisen started out as a licensed stockbroker in August 1987, a couple of months prior to the historic stock market crash that took the Dow Jones Industrial Average down -22.6% in a single day. He has published daily fact-based fundamental and technical analysis on high-ranked stocks online for two decades. Through FACTBASEDINVESTING.COM, Kenneth provides educational articles, news, market commentary, and other information regarding proven investment systems that work in good times and bad.
Comments contained in the body of this report are technical opinions only and are not necessarily those of Gruneisen Growth Corp. The material herein has been obtained from sources believed to be reliable and accurate, however, its accuracy and completeness cannot be guaranteed. Our firm, employees, and customers may effect transactions, including transactions contrary to any recommendation herein, or have positions in the securities mentioned herein or options with respect thereto. Any recommendation contained in this report may not be suitable for all investors and it is not to be deemed an offer or solicitation on our part with respect to the purchase or sale of any securities. |
|
 |
Biotech, Retail, and Financial Indexes Rose
Kenneth J. Gruneisen - Passed the CAN SLIM® Master's Exam
The Biotechnology Index ($BTK +2.22%) was a standout gainer thanks to strong earnings from some key players in the group, meanwhile weakness in the rest of the tech sector created a drag on the market as the Semiconductor Index ($SOX -2.29%) and the Networking Index ($NWX -2.07%) both lost ground. The Retail Index ($RLX +0.33%) posted a modest gain and the Bank Index ($BKX +0.33%) and Broker/Dealer Index ($XBD +0.75%) also were positive influences. The Gold & Silver Index ($XAU -0.48%) edged lower while the Integrated Oil Index ($XOI +0.73%) outpaced the Oil Services Index ($OSX +0.17%).
Charts courtesy www.stockcharts.com
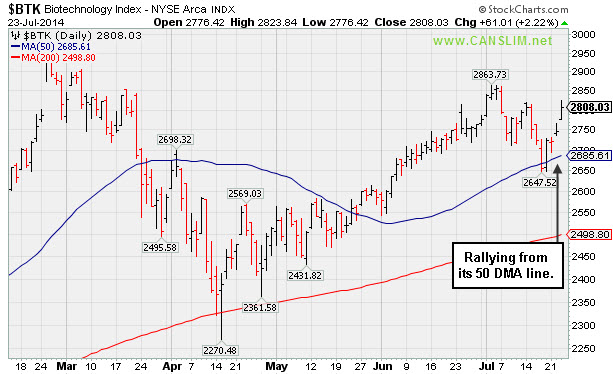
PICTURED: The Biotechnology Index ($BTK +2.22%) is rallying from support at its 50-day moving average (DMA) line.
| Oil Services |
$OSX |
308.25 |
+0.53 |
+0.17% |
+9.69% |
| Integrated Oil |
$XOI |
1,693.76 |
+12.21 |
+0.73% |
+12.68% |
| Semiconductor |
$SOX |
634.45 |
-14.90 |
-2.29% |
+18.58% |
| Networking |
$NWX |
331.02 |
-6.99 |
-2.07% |
+2.19% |
| Broker/Dealer |
$XBD |
159.40 |
+1.18 |
+0.75% |
-0.72% |
| Retail |
$RLX |
905.09 |
+3.00 |
+0.33% |
-3.69% |
| Gold & Silver |
$XAU |
100.31 |
-0.48 |
-0.48% |
+19.20% |
| Bank |
$BKX |
70.86 |
+0.23 |
+0.33% |
+2.31% |
| Biotech |
$BTK |
2,808.03 |
+61.01 |
+2.22% |
+20.49% |
|
|
|
 |
50-Day Moving Average Line Acted as Recent Resistance
Kenneth J. Gruneisen - Passed the CAN SLIM® Master's Exam
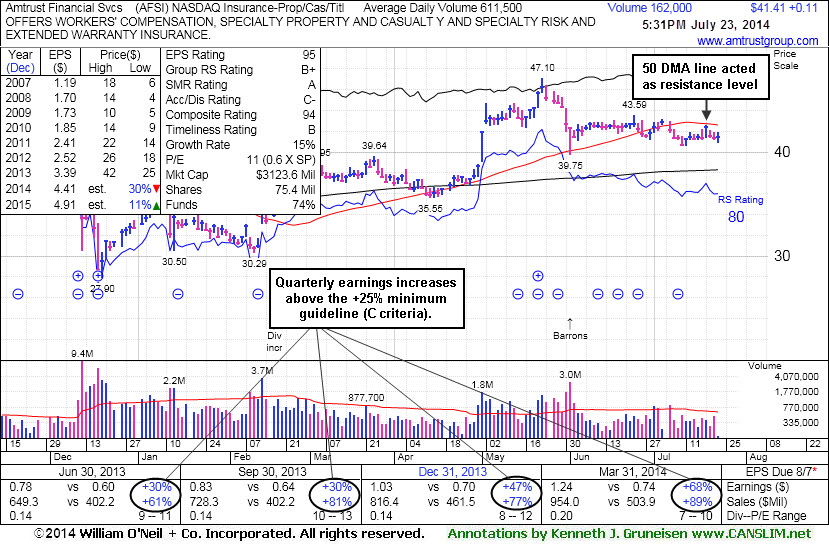
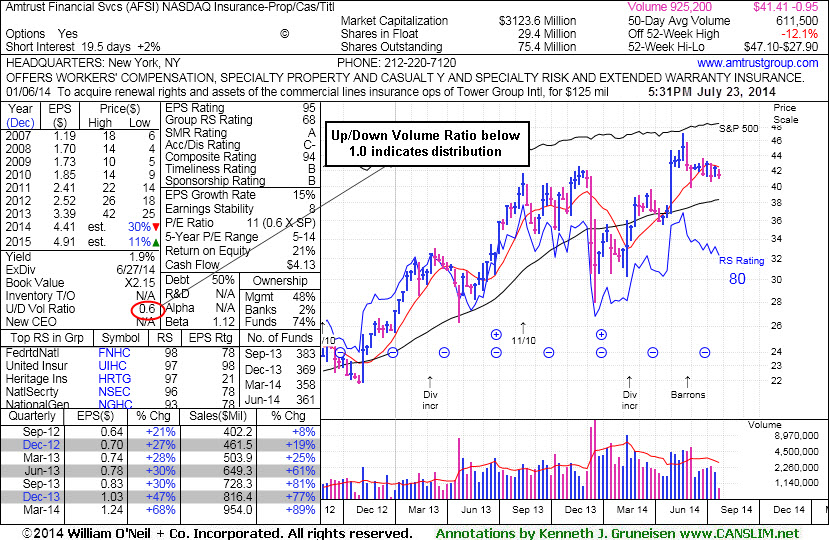
Amtrust Financial Svcs (AFSI +$0.11 or +0.27% to $41.41) is still sputtering below its 50-day moving average (DMA) line which recently acted as a resistance level. Its Relative Strength rating is right at the 80+ minimum guideline for buy candidates. Its current Up/Down Volume Ratio of 0.6 is an unbiased indication that its shares have been under distributional pressure over the past 50 days. Among concerns, we previously noted that the number of top-rated funds owning an interest has been reported lower. For now it faces resistance due to overhead supply up through the $47 level which may hinder its ability to rally. A convincing rebound above its 50 DMA line is needed for its outlook to improve.
The high-ranked Insurance - Property/Casualty/Title firm stalled and encountered distributional pressure soon after rising from an advanced "3-weeks tight" base. It was highlighted in yellow in the 5/21/14 mid-day report (read here) and the pivot point cited was based on its 5/13/14 high plus 10 cents. AFSI was last shown in this FSU section on 7/01/14 with detailed analysis and annotated graphs under the headline, "Found Support Near 50-Day Average and Relative Strength Slightly Improved", when a prompt rebound above the 50-day moving average (DMA) line helped its outlook improve. Disciplined investors always limit losses by selling any stock that falls more than -7% from their purchase price.
It reported earnings +68% on +89% sales revenues for the quarter ended Mar '14 quarter versus the year ago period, its 7th consecutive comparison above the +25% minimum earnings guideline (C criteria). It has a great annual earnings (A criteria) history and it has earned an impressive 95 Earnings Per Share rating, well above the 80+ minimum rating for buy candidates.
|
|
|
Color Codes Explained :
Y - Better candidates highlighted by our
staff of experts.
G - Previously featured
in past reports as yellow but may no longer be buyable under the
guidelines.
***Last / Change / Volume data in this table is the closing quote data***
Symbol/Exchange
Company Name
Industry Group |
PRICE |
CHANGE
(%Change) |
Day High |
Volume
(% DAV)
(% 50 day avg vol) |
52 Wk Hi
% From Hi |
Featured
Date |
Price
Featured |
Pivot Featured |
|
Max Buy |
ACT
-
NYSE
Actavis plc
Medical-Generic Drugs
|
$219.63
|
+3.26
1.51% |
$220.22
|
2,396,735
112.10% of 50 DAV
50 DAV is 2,138,000
|
$230.77
-4.83%
|
6/20/2014
|
$216.53
|
PP = $230.87
|
|
MB = $242.41
|
Most Recent Note - 7/22/2014 7:17:36 PM
Y - Found support while consolidating above its 50 DMA line ($214.40), still hovering within close striking distance of its 52-week high. Subsequent volume-driven gains to new highs may trigger a technical buy signal.
>>> FEATURED STOCK ARTICLE : Disciplined Investors Still Awaiting Technical Breakout - 7/16/2014
View all notes |
Set NEW NOTE alert |
CANSLIM.net Company Profile |
SEC
News |
Chart |
Request a new note
C
A N
S L
I M


|
AFSI
-
NASDAQ
Amtrust Financial Svcs
INSURANCE - Property and; Casualty Insurance
|
$41.41
|
+0.11
0.27% |
$41.94
|
161,560
26.42% of 50 DAV
50 DAV is 611,500
|
$47.10
-12.08%
|
5/21/2014
|
$44.85
|
PP = $44.85
|
|
MB = $47.09
|
 Most Recent Note - 7/23/2014 5:49:03 PM
G - Still sputtering below its 50 DMA line which recently acted as resistance. Faces resistance due to overhead supply up through the $47 level. See the latest FSU analysis for more details and new annotated graphs.
>>> FEATURED STOCK ARTICLE : 50-Day Moving Average Line Acted as Recent Resistance - 7/23/2014
View all notes |
Set NEW NOTE alert |
CANSLIM.net Company Profile |
SEC
News |
Chart |
Request a new note
C
A N
S L
I M
|
BITA
-
NYSE
Bitauto Hldgs Ltd Ads
Internet-Content
|
$56.71
|
+1.75
3.18% |
$57.05
|
644,706
69.62% of 50 DAV
50 DAV is 926,000
|
$56.35
0.64%
|
6/26/2014
|
$46.20
|
PP = $47.03
|
|
MB = $49.38
|
Most Recent Note - 7/23/2014 4:29:08 PM
G - Hit another new high with below average volume behind today's 4th consecutive gain, getting more extended from its prior base while wedging higher.
>>> FEATURED STOCK ARTICLE : Strength Returned After Shake-Out and Positive Reversal - 7/21/2014
View all notes |
Set NEW NOTE alert |
CANSLIM.net Company Profile |
SEC
News |
Chart |
Request a new note
C
A N
S L
I M
|
BWLD
-
NASDAQ
Buffalo Wild Wings Inc
LEISURE - Restaurants
|
$158.56
|
+0.91
0.58% |
$159.85
|
397,930
106.97% of 50 DAV
50 DAV is 372,000
|
$167.36
-5.26%
|
6/19/2014
|
$158.52
|
PP = $159.91
|
|
MB = $167.91
|
Most Recent Note - 7/22/2014 12:54:24 PM
Y - Rallying with higher volume after finding prompt support at its 50 DMA line, and its color code is changed to yellow. Faces some resistance due to overhead supply up through the $167 level.
>>> FEATURED STOCK ARTICLE : Slump Into Prior Base Negated Recent Breakout - 7/14/2014
View all notes |
Set NEW NOTE alert |
CANSLIM.net Company Profile |
SEC
News |
Chart |
Request a new note
C
A N
S L
I M
|
EQM
-
NYSE
E Q T Midstream Partners
ENERGY - Oil and Gas Pipelines
|
$95.09
|
+0.44
0.46% |
$95.58
|
267,702
84.45% of 50 DAV
50 DAV is 317,000
|
$102.51
-7.24%
|
12/12/2013
|
$53.17
|
PP = $56.51
|
|
MB = $59.34
|
Most Recent Note - 7/23/2014 4:11:34 PM
G - Still consolidating in an orderly fashion well above its 50 DMA line. Strength has continued despite fundamental flaws repeatedly noted.
>>> FEATURED STOCK ARTICLE : Volume Totals Cooling While Consolidating Near Highs - 7/17/2014
View all notes |
Set NEW NOTE alert |
CANSLIM.net Company Profile |
SEC
News |
Chart |
Request a new note
C
A N
S L
I M
|
Symbol/Exchange
Company Name
Industry Group |
PRICE |
CHANGE
(%Change) |
Day High |
Volume
(% DAV)
(% 50 day avg vol) |
52 Wk Hi
% From Hi |
Featured
Date |
Price
Featured |
Pivot Featured |
|
Max Buy |
GRFS
-
NASDAQ
Grifols Sa Cl B Ads
Medical-Ethical Drugs
|
$41.79
|
+0.26
0.63% |
$41.90
|
354,307
52.65% of 50 DAV
50 DAV is 673,000
|
$46.66
-10.44%
|
5/15/2014
|
$41.14
|
PP = $43.55
|
|
MB = $45.73
|
Most Recent Note - 7/22/2014 7:16:10 PM
G - Encountered resistance at its 50 DMA line, and a rebound above that important short-term average is needed for its outlook to improve. A subsequent violation of its recent low ($39.86 on 7/10/14) would raise more serious concerns and trigger more worrisome sell signals. Faces resistance due to overhead supply up through the $46 area.
>>> FEATURED STOCK ARTICLE : Violation of 50-Day Moving Average Triggered Technical Sell Signal - 7/9/2014
View all notes |
Set NEW NOTE alert |
CANSLIM.net Company Profile |
SEC
News |
Chart |
Request a new note
C
A N
S L
I M
|
HF
-
NYSE
H F F Inc Cl A
REAL ESTATE - Property Management/Developmen
|
$34.50
|
-0.41
-1.17% |
$34.97
|
95,764
48.37% of 50 DAV
50 DAV is 198,000
|
$38.23
-9.76%
|
6/20/2014
|
$34.60
|
PP = $36.16
|
|
MB = $37.97
|
Most Recent Note - 7/23/2014 4:17:02 PM
Y - Still testing support at its 50 DMA line ($34.21) and recent lows ($33.91 on 7/18/14) where further deterioration would raise greater concerns.
>>> FEATURED STOCK ARTICLE : Slump Into Prior Base Negated Recent Breakout - 7/15/2014
View all notes |
Set NEW NOTE alert |
CANSLIM.net Company Profile |
SEC
News |
Chart |
Request a new note
C
A N
S L
I M
|
ICON
-
NASDAQ
Iconix Brand Group Inc
CONSUMER NON-DURABLES - Textile - Apparel Footwear
|
$42.54
|
+0.40
0.95% |
$42.56
|
1,042,951
221.90% of 50 DAV
50 DAV is 470,000
|
$44.81
-5.07%
|
6/5/2014
|
$43.54
|
PP = $43.44
|
|
MB = $45.61
|
Most Recent Note - 7/23/2014 4:25:27 PM
G - Up today with heavy volume, rising to its 50 DMA line. Faces some additional resistance due to overhead supply up through the $44 level.
>>> FEATURED STOCK ARTICLE : Slump Below 50-Day Moving Average Line Hurt Outlook - 7/11/2014
View all notes |
Set NEW NOTE alert |
CANSLIM.net Company Profile |
SEC
News |
Chart |
Request a new note
C
A N
S L
I M
|
PANW
-
NYSE
Palo Alto Networks
Computer Sftwr-Security
|
$81.49
|
-0.26
-0.32% |
$82.15
|
817,843
45.54% of 50 DAV
50 DAV is 1,796,000
|
$85.78
-5.00%
|
5/29/2014
|
$75.95
|
PP = $72.50
|
|
MB = $76.13
|
Most Recent Note - 7/22/2014 7:11:21 PM
G - Found support above its 50 DMA line and prior highs defining important support where a subsequent violation would raise serious concerns and trigger technical sell signals. See the latest FSU analysis for more details and new annotated graphs.
>>> FEATURED STOCK ARTICLE : Found Support Above 50-Day Average Near Prior Highs - 7/22/2014
View all notes |
Set NEW NOTE alert |
CANSLIM.net Company Profile |
SEC
News |
Chart |
Request a new note
C
A N
S L
I M
|
TARO
-
NYSE
Taro Pharmaceutical Inds
DRUGS - Drug Manufacturers - Other
|
$145.80
|
+0.29
0.20% |
$149.79
|
40,520
58.72% of 50 DAV
50 DAV is 69,000
|
$149.89
-2.73%
|
6/26/2014
|
$117.31
|
PP = $118.90
|
|
MB = $124.85
|
Most Recent Note - 7/23/2014 4:27:29 PM
G - Stubbornly holding its ground after tallying big gains following its recent breakout, an encouraging sign. Disciplined investors avoid chasing stocks more than +5% above prior highs.
>>> FEATURED STOCK ARTICLE : Big Gains in First 2-3 Weeks After Breakout an Encouraging Sign - 7/18/2014
View all notes |
Set NEW NOTE alert |
CANSLIM.net Company Profile |
SEC
News |
Chart |
Request a new note
C
A N
S L
I M
|
Symbol/Exchange
Company Name
Industry Group |
PRICE |
CHANGE
(%Change) |
Day High |
Volume
(% DAV)
(% 50 day avg vol) |
52 Wk Hi
% From Hi |
Featured
Date |
Price
Featured |
Pivot Featured |
|
Max Buy |
TRN
-
NYSE
Trinity Industries Inc
TRANSPORTATION - Railroads
|
$45.12
|
+0.10
0.22% |
$46.29
|
4,873,299
162.61% of 50 DAV
50 DAV is 2,997,000
|
$46.00
-1.91%
|
4/30/2014
|
$37.79
|
PP = $38.03
|
|
MB = $39.93
|
Most Recent Note - 7/23/2014 4:31:08 PM
G - Touched a new 52-week high today then erased most of its gain to close near the session low. It is extended from its prior base. Its 50 DMA line defines important near-term support to watch.
>>> FEATURED STOCK ARTICLE : Bullish Up/Down Volume and Increasing Institutional Ownership - 7/8/2014
View all notes |
Set NEW NOTE alert |
CANSLIM.net Company Profile |
SEC
News |
Chart |
Request a new note
C
A N
S L
I M
|
UA
-
NYSE
Under Armour Inc Cl A
CONSUMER NON-DURABLES - Textile - Apparel Clothing
|
$60.63
|
+0.37
0.61% |
$60.68
|
2,700,182
107.71% of 50 DAV
50 DAV is 2,507,000
|
$62.40
-2.83%
|
7/10/2014
|
$58.50
|
PP = $60.79
|
|
MB = $63.83
|
Most Recent Note - 7/22/2014 1:02:38 PM
Y - Rising today near its pivot point following a previously noted "cup-with-handle" base. Gains above the pivot point backed by at least +40% above average volume may trigger a proper technical buy signal.
>>> FEATURED STOCK ARTICLE : Forming Handle on Cup-With-Handle Base Pattern - 7/10/2014
View all notes |
Set NEW NOTE alert |
CANSLIM.net Company Profile |
SEC
News |
Chart |
Request a new note
C
A N
S L
I M
|
WLK
-
NYSE
Westlake Chemical Corp
CHEMICALS - Specialty Chemicals
|
$89.68
|
+1.08
1.22% |
$89.75
|
700,030
127.51% of 50 DAV
50 DAV is 549,000
|
$88.76
1.04%
|
4/29/2014
|
$72.79
|
PP = $69.31
|
|
MB = $72.78
|
Most Recent Note - 7/21/2014 6:21:09 PM
G - Hit another new 52-week high with today's 4th consecutive gain, getting more extended from any sound base pattern. Its 50 DMA line ($81.60) defines important near-term support to watch on pullbacks.
>>> FEATURED STOCK ARTICLE : Great Ranks and Reassuring Leadership in Chemical Group - 7/7/2014
View all notes |
Set NEW NOTE alert |
CANSLIM.net Company Profile |
SEC
News |
Chart |
Request a new note
C
A N
S L
I M
|
|
|
|
THESE ARE NOT BUY RECOMMENDATIONS!
Comments contained in the body of this report are technical
opinions only. The material herein has been obtained
from sources believed to be reliable and accurate, however,
its accuracy and completeness cannot be guaranteed.
This site is not an investment advisor, hence it does
not endorse or recommend any securities or other investments.
Any recommendation contained in this report may not
be suitable for all investors and it is not to be deemed
an offer or solicitation on our part with respect to
the purchase or sale of any securities. All trademarks,
service marks and trade names appearing in this report
are the property of their respective owners, and are
likewise used for identification purposes only.
This report is a service available
only to active Paid Premium Members.
You may opt-out of receiving report notifications
at any time. Questions or comments may be submitted
by writing to Premium Membership Services 665 S.E. 10 Street, Suite 201 Deerfield Beach, FL 33441-5634 or by calling 1-800-965-8307
or 954-785-1121.
|
|
|

