You are not logged in.
This means you
CAN ONLY VIEW reports that were published prior to Monday, April 14, 2025.
You
MUST UPGRADE YOUR MEMBERSHIP if you want to see any current reports.
AFTER MARKET UPDATE - TUESDAY, JULY 22ND, 2014
Previous After Market Report Next After Market Report >>>
|
|
|
|
DOW |
+61.81 |
17,113.54 |
+0.36% |
|
Volume |
570,639,300 |
+8% |
|
Volume |
1,594,657,290 |
+10% |
|
NASDAQ |
+31.32 |
4,456.02 |
+0.71% |
|
Advancers |
2,090 |
66% |
|
Advancers |
1,900 |
66% |
|
S&P 500 |
+9.90 |
1,983.53 |
+0.50% |
|
Decliners |
950 |
30% |
|
Decliners |
904 |
31% |
|
Russell 2000 |
+9.49 |
1,156.15 |
+0.83% |
|
52 Wk Highs |
176 |
|
|
52 Wk Highs |
94 |
|
|
S&P 600 |
+5.85 |
666.68 |
+0.89% |
|
52 Wk Lows |
17 |
|
|
52 Wk Lows |
31 |
|
|
 |
Leadership Expanded as Major Averages Rose With Better Volume
Kenneth J. Gruneisen - Passed the CAN SLIM® Master's Exam
The major averages finished higher at the market close on Tuesday. The volume totals were higher than the prior session volume totals on the NYSE and on the Nasdaq exchange, and encouraging sign of institutional buying demand on the rise. Breadth was positive as advancers led decliners by more than a 2-1 margin on the Nasdaq exchange and on the NYSE. There were 49 high-ranked companies from the CANSLIM.net Leaders List that made new 52-week highs and appeared on the CANSLIM.net BreakOuts Page, more than doubling the prior session total of 24 stocks. New 52-week highs outnumbered new 52-week lows on the NYSE and on the Nasdaq exchange. There were gains for 12 of the 13 of the high-ranked companies currently included on the Featured Stocks Page. The market (M criteria) uptrend recently faced pressure, however the latest expansion in leadership has been reassuring. Disciplined investors limit losses and reduce market exposure during rough market periods by selling any stocks which fall more than -7% from their purchase price.
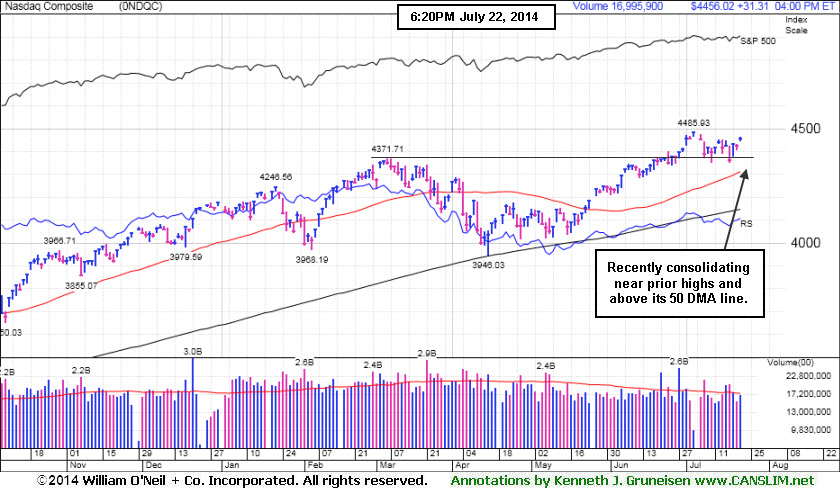
PICTURED: The tech-heavy Nasdaq Composite Index has been consolidating well above its 50-day moving average (DMA) line. It found support well above that important short-term average, near its prior highs.
Positive economic data and strong earnings results helped to lift stocks for the day. Inflation data remained tame. The Consumer Price Index rose 0.3% and is up 2.1% for the 12 months ended in June. While in-line with expectations, it did spur optimism that the Fed will continue to suppress rates well into 2015. The Richmond Fed reported that Mid-Atlantic manufacturing activity rose to 7 from a prior reading of 3, and existing home sales in June surprised investors with a 2.6% increase month-over-month.
Earnings were mixed. Netflix (NFLX -4.62%) slumped after its report. Information technology and Health care were the best performing groups. Qualcomm (QCOM +2.35%), F5 Networks (FFIV +2.62%) and Apple Computer (AAPL +0.83%) rallied ahead of their earnings tallies. Biotech and pharmaceuticals also showed to advantage with Amgen (AMGN +1.75%), Celgene (CELG +1.58%) and Johnson & Johnson (JNJ +1.18%) rallying. Consumer staples were hurt by earnings. Kimberly-Clark (KMP -3.09%) fell after the company missed estimates and revised full-year earnings guidance lower.
Treasuries were flat. The 10-year note finished at 2.46%.
The CANSLIM.net Featured Stocks Page shows the most action-worthy candidates and their latest notes and a Headline Link directs members to the latest detailed analysis with data-packed graphs annotated by a Certified expert along with links to additional resources. The Premium Member Homepage includes "dynamic archives" to all prior pay reports published. Watch for an announcement via email concerning the next WEBCAST.
|
 Kenneth J. Gruneisen started out as a licensed stockbroker in August 1987, a couple of months prior to the historic stock market crash that took the Dow Jones Industrial Average down -22.6% in a single day. He has published daily fact-based fundamental and technical analysis on high-ranked stocks online for two decades. Through FACTBASEDINVESTING.COM, Kenneth provides educational articles, news, market commentary, and other information regarding proven investment systems that work in good times and bad.
Comments contained in the body of this report are technical opinions only and are not necessarily those of Gruneisen Growth Corp. The material herein has been obtained from sources believed to be reliable and accurate, however, its accuracy and completeness cannot be guaranteed. Our firm, employees, and customers may effect transactions, including transactions contrary to any recommendation herein, or have positions in the securities mentioned herein or options with respect thereto. Any recommendation contained in this report may not be suitable for all investors and it is not to be deemed an offer or solicitation on our part with respect to the purchase or sale of any securities. |
|
 |
Tech, Financial, Retail and Energy-Related Groups Rose
Kenneth J. Gruneisen - Passed the CAN SLIM® Master's Exam
The Networking Index ($NWX +1.40%) led the tech sector higher as the Biotechnology Index ($BTK +0.93%) and the Semiconductor Index ($SOX +0.67%) posted smaller gains. The Broker/Dealer Index ($XBD +0.70%) outpaced the Bank Index ($BKX +0.17%) and the Retail Index ($RLX +0.14%). A positive bias also boosted energy-related shares as the Integrated Oil Index ($XOI +0.69%) and the Oil Services Index ($OSX +0.94%) both rose, meanwhile the Gold & Silver Index ($XAU -1.11%) was a standout decliner.
Charts courtesy www.stockcharts.com
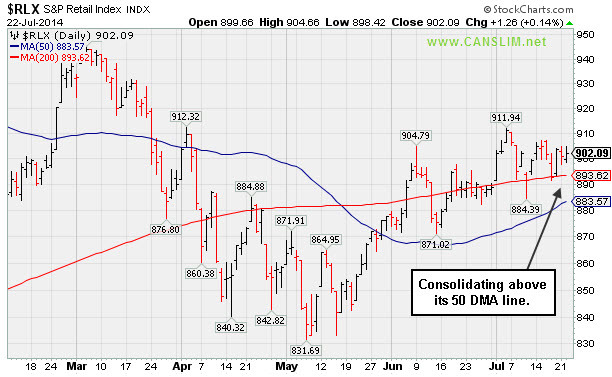
PICTURED: The Retail Index ($RLX +0.14%) is consolidating above its 50-day moving average (DMA) line.
| Oil Services |
$OSX |
307.72 |
+2.86 |
+0.94% |
+9.50% |
| Integrated Oil |
$XOI |
1,681.55 |
+11.49 |
+0.69% |
+11.87% |
| Semiconductor |
$SOX |
649.35 |
+4.33 |
+0.67% |
+21.37% |
| Networking |
$NWX |
338.01 |
+4.67 |
+1.40% |
+4.34% |
| Broker/Dealer |
$XBD |
158.22 |
+1.10 |
+0.70% |
-1.46% |
| Retail |
$RLX |
902.09 |
+1.26 |
+0.14% |
-4.01% |
| Gold & Silver |
$XAU |
100.79 |
-1.13 |
-1.11% |
+19.77% |
| Bank |
$BKX |
70.63 |
+0.12 |
+0.17% |
+1.98% |
| Biotech |
$BTK |
2,747.02 |
+25.43 |
+0.93% |
+17.88% |
|
|
|
 |
Found Support Above 50-Day Average Near Prior Highs
Kenneth J. Gruneisen - Passed the CAN SLIM® Master's Exam
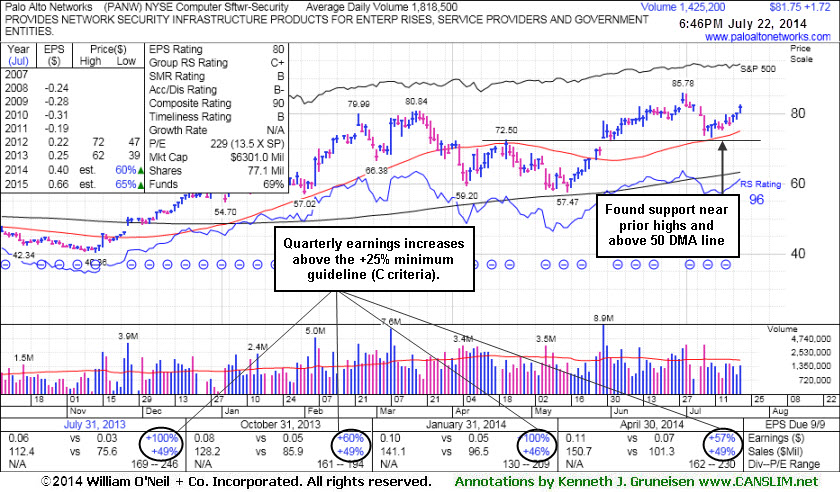
Palo Alto Networks (PANW +$1.72 or +2.15% to $81.75) rose again with today's 3rd consecutive gain on below average volume. Its 50-day moving average (DMA) line defines important support and a violation would raise serious concerns and trigger a technical sell signal. The high-ranked leader hailing from the Computer Software - Security industry group stalled after it was last shown in this FSU section with annotated graphs on 6/30/14 under the headline, "Gap Up Gain on Above Average Volume for New Highs".
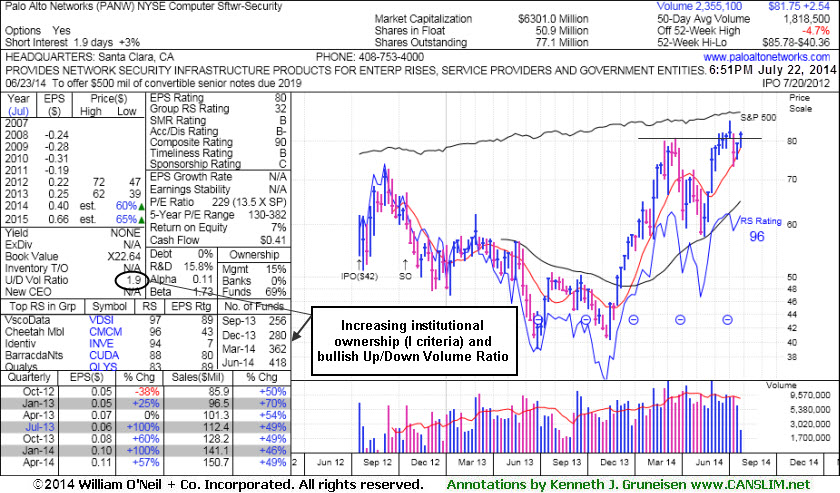
PANW was first highlighted in yellow at $75.95 with pivot point cited based on its 4/22/14 high in the 5/29/14 mid-day report (read here). The gap up gain was backed by 5 times average volume as it completed a bullish "double bottom" base and triggered a technical buy signal. Strong sales revenues increases and earnings through the Apr '14 quarter above the +25% minimum guideline satisfy the C criteria. Its annual earnings (A criteria) history is a bit limited, but growth has been strong since its July 2012 IPO at $42. The number of top-rated funds owning its shares rose from 246 in Jun '13 to 418 in Jun '14, a reassuring sign concerning the I criteria. Its small supply (S criteria) of only 50.9 million shares in the public float is another favorable characteristic.
|
|
|
Color Codes Explained :
Y - Better candidates highlighted by our
staff of experts.
G - Previously featured
in past reports as yellow but may no longer be buyable under the
guidelines.
***Last / Change / Volume data in this table is the closing quote data***
Symbol/Exchange
Company Name
Industry Group |
PRICE |
CHANGE
(%Change) |
Day High |
Volume
(% DAV)
(% 50 day avg vol) |
52 Wk Hi
% From Hi |
Featured
Date |
Price
Featured |
Pivot Featured |
|
Max Buy |
ACT
-
NYSE
Actavis plc
Medical-Generic Drugs
|
$216.37
|
+0.24
0.11% |
$218.47
|
1,479,963
68.52% of 50 DAV
50 DAV is 2,160,000
|
$230.77
-6.24%
|
6/20/2014
|
$216.53
|
PP = $230.87
|
|
MB = $242.41
|
 Most Recent Note - 7/22/2014 7:17:36 PM
Y - Found support while consolidating above its 50 DMA line ($214.40), still hovering within close striking distance of its 52-week high. Subsequent volume-driven gains to new highs may trigger a technical buy signal.
>>> FEATURED STOCK ARTICLE : Disciplined Investors Still Awaiting Technical Breakout - 7/16/2014
View all notes |
Set NEW NOTE alert |
CANSLIM.net Company Profile |
SEC
News |
Chart |
Request a new note
C
A N
S L
I M


|
AFSI
-
NASDAQ
Amtrust Financial Svcs
INSURANCE - Property and; Casualty Insurance
|
$41.30
|
-0.20
-0.48% |
$41.91
|
478,887
77.91% of 50 DAV
50 DAV is 614,700
|
$47.10
-12.31%
|
5/21/2014
|
$44.85
|
PP = $44.85
|
|
MB = $47.09
|
Most Recent Note - 7/21/2014 6:19:06 PM
G - Still sputtering below its 50 DMA line and its Relative Strength rating has slipped to 79, below the 80+ minimum guideline for buy candidates. Faces resistance due to overhead supply up through the $47 level.
>>> FEATURED STOCK ARTICLE : Found Support Near 50-Day Average and Relative Strength Slightly Improved - 7/1/2014
View all notes |
Set NEW NOTE alert |
CANSLIM.net Company Profile |
SEC
News |
Chart |
Request a new note
C
A N
S L
I M
|
BITA
-
NYSE
Bitauto Hldgs Ltd Ads
Internet-Content
|
$54.96
|
+0.91
1.68% |
$56.35
|
733,628
79.40% of 50 DAV
50 DAV is 924,000
|
$54.72
0.44%
|
6/26/2014
|
$46.20
|
PP = $47.03
|
|
MB = $49.38
|
Most Recent Note - 7/21/2014 6:14:34 PM
G - Consolidating above its "max buy" level, extended from its prior base. See the latest FSU analysis for more details and annotated graphs.
>>> FEATURED STOCK ARTICLE : Strength Returned After Shake-Out and Positive Reversal - 7/21/2014
View all notes |
Set NEW NOTE alert |
CANSLIM.net Company Profile |
SEC
News |
Chart |
Request a new note
C
A N
S L
I M
|
BWLD
-
NASDAQ
Buffalo Wild Wings Inc
LEISURE - Restaurants
|
$157.65
|
+6.52
4.31% |
$158.00
|
484,914
130.35% of 50 DAV
50 DAV is 372,000
|
$167.36
-5.80%
|
6/19/2014
|
$158.52
|
PP = $159.91
|
|
MB = $167.91
|
Most Recent Note - 7/22/2014 12:54:24 PM
Y - Rallying with higher volume after finding prompt support at its 50 DMA line, and its color code is changed to yellow. Faces some resistance due to overhead supply up through the $167 level.
>>> FEATURED STOCK ARTICLE : Slump Into Prior Base Negated Recent Breakout - 7/14/2014
View all notes |
Set NEW NOTE alert |
CANSLIM.net Company Profile |
SEC
News |
Chart |
Request a new note
C
A N
S L
I M
|
EQM
-
NYSE
E Q T Midstream Partners
ENERGY - Oil and Gas Pipelines
|
$94.65
|
+0.05
0.05% |
$95.24
|
122,856
38.63% of 50 DAV
50 DAV is 318,000
|
$102.51
-7.67%
|
12/12/2013
|
$53.17
|
PP = $56.51
|
|
MB = $59.34
|
Most Recent Note - 7/17/2014 9:38:36 PM
G - Volume totals have been cooling in recent weeks while consolidating well above its 50 DMA line. Strength has continued despite fundamental flaws repeatedly noted. See the latest FSU analysis for more details and new annotated graphs.
>>> FEATURED STOCK ARTICLE : Volume Totals Cooling While Consolidating Near Highs - 7/17/2014
View all notes |
Set NEW NOTE alert |
CANSLIM.net Company Profile |
SEC
News |
Chart |
Request a new note
C
A N
S L
I M
|
Symbol/Exchange
Company Name
Industry Group |
PRICE |
CHANGE
(%Change) |
Day High |
Volume
(% DAV)
(% 50 day avg vol) |
52 Wk Hi
% From Hi |
Featured
Date |
Price
Featured |
Pivot Featured |
|
Max Buy |
GRFS
-
NASDAQ
Grifols Sa Cl B Ads
Medical-Ethical Drugs
|
$41.53
|
+0.58
1.42% |
$41.88
|
262,919
38.61% of 50 DAV
50 DAV is 681,000
|
$46.66
-10.99%
|
5/15/2014
|
$41.14
|
PP = $43.55
|
|
MB = $45.73
|
Most Recent Note - 7/22/2014 7:16:10 PM
G - Encountered resistance at its 50 DMA line, and a rebound above that important short-term average is needed for its outlook to improve. A subsequent violation of its recent low ($39.86 on 7/10/14) would raise more serious concerns and trigger more worrisome sell signals. Faces resistance due to overhead supply up through the $46 area.
>>> FEATURED STOCK ARTICLE : Violation of 50-Day Moving Average Triggered Technical Sell Signal - 7/9/2014
View all notes |
Set NEW NOTE alert |
CANSLIM.net Company Profile |
SEC
News |
Chart |
Request a new note
C
A N
S L
I M
|
HF
-
NYSE
H F F Inc Cl A
REAL ESTATE - Property Management/Developmen
|
$34.91
|
+0.20
0.58% |
$35.53
|
184,209
93.03% of 50 DAV
50 DAV is 198,000
|
$38.23
-8.68%
|
6/20/2014
|
$34.60
|
PP = $36.16
|
|
MB = $37.97
|
Most Recent Note - 7/17/2014 3:44:25 PM
Y - Undercutting prior highs in the $35 area and negating its recent breakout with today's 4th consecutive loss on ever-increasing volume. Testing its 50 DMA line ($34.05) where further deterioration would raise greater concerns.
>>> FEATURED STOCK ARTICLE : Slump Into Prior Base Negated Recent Breakout - 7/15/2014
View all notes |
Set NEW NOTE alert |
CANSLIM.net Company Profile |
SEC
News |
Chart |
Request a new note
C
A N
S L
I M
|
ICON
-
NASDAQ
Iconix Brand Group Inc
CONSUMER NON-DURABLES - Textile - Apparel Footwear
|
$42.14
|
+0.11
0.26% |
$42.56
|
487,875
104.47% of 50 DAV
50 DAV is 467,000
|
$44.81
-5.96%
|
6/5/2014
|
$43.54
|
PP = $43.44
|
|
MB = $45.61
|
Most Recent Note - 7/17/2014 3:45:36 PM
G - Still sputtering below its 50 DMA line, and a rebound above that important short-term average is needed to help its outlook improve.
>>> FEATURED STOCK ARTICLE : Slump Below 50-Day Moving Average Line Hurt Outlook - 7/11/2014
View all notes |
Set NEW NOTE alert |
CANSLIM.net Company Profile |
SEC
News |
Chart |
Request a new note
C
A N
S L
I M
|
PANW
-
NYSE
Palo Alto Networks
Computer Sftwr-Security
|
$81.75
|
+1.72
2.15% |
$82.50
|
1,425,238
78.40% of 50 DAV
50 DAV is 1,818,000
|
$85.78
-4.70%
|
5/29/2014
|
$75.95
|
PP = $72.50
|
|
MB = $76.13
|
Most Recent Note - 7/22/2014 7:11:21 PM
G - Found support above its 50 DMA line and prior highs defining important support where a subsequent violation would raise serious concerns and trigger technical sell signals. See the latest FSU analysis for more details and new annotated graphs.
>>> FEATURED STOCK ARTICLE : Found Support Above 50-Day Average Near Prior Highs - 7/22/2014
View all notes |
Set NEW NOTE alert |
CANSLIM.net Company Profile |
SEC
News |
Chart |
Request a new note
C
A N
S L
I M
|
TARO
-
NYSE
Taro Pharmaceutical Inds
DRUGS - Drug Manufacturers - Other
|
$145.51
|
+2.00
1.39% |
$148.44
|
47,533
68.89% of 50 DAV
50 DAV is 69,000
|
$149.89
-2.92%
|
6/26/2014
|
$117.31
|
PP = $118.90
|
|
MB = $124.85
|
Most Recent Note - 7/18/2014 6:45:47 PM
G - Tallied big gains after recent breakout, an encouraging sign. Disciplined investors avoid chasing stocks more than +5% above prior highs. See latest FSU analysis for more details and annotated graphs.
>>> FEATURED STOCK ARTICLE : Big Gains in First 2-3 Weeks After Breakout an Encouraging Sign - 7/18/2014
View all notes |
Set NEW NOTE alert |
CANSLIM.net Company Profile |
SEC
News |
Chart |
Request a new note
C
A N
S L
I M
|
Symbol/Exchange
Company Name
Industry Group |
PRICE |
CHANGE
(%Change) |
Day High |
Volume
(% DAV)
(% 50 day avg vol) |
52 Wk Hi
% From Hi |
Featured
Date |
Price
Featured |
Pivot Featured |
|
Max Buy |
TRN
-
NYSE
Trinity Industries Inc
TRANSPORTATION - Railroads
|
$45.02
|
+0.53
1.19% |
$45.33
|
2,055,378
68.17% of 50 DAV
50 DAV is 3,015,000
|
$46.00
-2.13%
|
4/30/2014
|
$37.79
|
PP = $38.03
|
|
MB = $39.93
|
Most Recent Note - 7/22/2014 12:57:04 PM
G - Quietly perched within close striking distance of its 52-week high, extended from its prior base. Its 50 DMA line defines important near-term support to watch.
>>> FEATURED STOCK ARTICLE : Bullish Up/Down Volume and Increasing Institutional Ownership - 7/8/2014
View all notes |
Set NEW NOTE alert |
CANSLIM.net Company Profile |
SEC
News |
Chart |
Request a new note
C
A N
S L
I M
|
UA
-
NYSE
Under Armour Inc Cl A
CONSUMER NON-DURABLES - Textile - Apparel Clothing
|
$60.26
|
+1.30
2.20% |
$60.63
|
2,169,949
86.73% of 50 DAV
50 DAV is 2,502,000
|
$62.40
-3.42%
|
7/10/2014
|
$58.50
|
PP = $60.79
|
|
MB = $63.83
|
Most Recent Note - 7/22/2014 1:02:38 PM
Y - Rising today near its pivot point following a previously noted "cup-with-handle" base. Gains above the pivot point backed by at least +40% above average volume may trigger a proper technical buy signal.
>>> FEATURED STOCK ARTICLE : Forming Handle on Cup-With-Handle Base Pattern - 7/10/2014
View all notes |
Set NEW NOTE alert |
CANSLIM.net Company Profile |
SEC
News |
Chart |
Request a new note
C
A N
S L
I M
|
WLK
-
NYSE
Westlake Chemical Corp
CHEMICALS - Specialty Chemicals
|
$88.60
|
+1.65
1.90% |
$88.76
|
733,967
132.72% of 50 DAV
50 DAV is 553,000
|
$87.34
1.44%
|
4/29/2014
|
$72.79
|
PP = $69.31
|
|
MB = $72.78
|
Most Recent Note - 7/21/2014 6:21:09 PM
G - Hit another new 52-week high with today's 4th consecutive gain, getting more extended from any sound base pattern. Its 50 DMA line ($81.60) defines important near-term support to watch on pullbacks.
>>> FEATURED STOCK ARTICLE : Great Ranks and Reassuring Leadership in Chemical Group - 7/7/2014
View all notes |
Set NEW NOTE alert |
CANSLIM.net Company Profile |
SEC
News |
Chart |
Request a new note
C
A N
S L
I M
|
|
|
|
THESE ARE NOT BUY RECOMMENDATIONS!
Comments contained in the body of this report are technical
opinions only. The material herein has been obtained
from sources believed to be reliable and accurate, however,
its accuracy and completeness cannot be guaranteed.
This site is not an investment advisor, hence it does
not endorse or recommend any securities or other investments.
Any recommendation contained in this report may not
be suitable for all investors and it is not to be deemed
an offer or solicitation on our part with respect to
the purchase or sale of any securities. All trademarks,
service marks and trade names appearing in this report
are the property of their respective owners, and are
likewise used for identification purposes only.
This report is a service available
only to active Paid Premium Members.
You may opt-out of receiving report notifications
at any time. Questions or comments may be submitted
by writing to Premium Membership Services 665 S.E. 10 Street, Suite 201 Deerfield Beach, FL 33441-5634 or by calling 1-800-965-8307
or 954-785-1121.
|
|
|

