You are not logged in.
This means you
CAN ONLY VIEW reports that were published prior to Monday, April 14, 2025.
You
MUST UPGRADE YOUR MEMBERSHIP if you want to see any current reports.
AFTER MARKET UPDATE - MONDAY, JULY 22ND, 2013
Previous After Market Report Next After Market Report >>>
|
|
|
|
DOW |
+1.81 |
15,545.55 |
+0.01% |
|
Volume |
584,587,660 |
-33% |
|
Volume |
1,455,712,040 |
-15% |
|
NASDAQ |
+12.78 |
3,600.39 |
+0.36% |
|
Advancers |
1,715 |
55% |
|
Advancers |
1,476 |
57% |
|
S&P 500 |
+3.44 |
1,695.53 |
+0.20% |
|
Decliners |
1,278 |
41% |
|
Decliners |
994 |
38% |
|
Russell 2000 |
+2.93 |
1,053.41 |
+0.28% |
|
52 Wk Highs |
323 |
|
|
52 Wk Highs |
284 |
|
|
S&P 600 |
+1.62 |
591.87 |
+0.27% |
|
52 Wk Lows |
65 |
|
|
52 Wk Lows |
9 |
|
|
 |
Major Averages Inch Higher on Lighter Volume Totals
Kenneth J. Gruneisen - Passed the CAN SLIM® Master's Exam
The major averages finished Monday's session with modest gains. Volume totals were reported lighter than the prior session on the NYSE and on the Nasdaq exchange. Advancers led decliners by almost a 3-2 margin on the NYSE and on the Nasdaq exchange. There were 82 high-ranked companies from the CANSLIM.net Leaders List made new 52-week highs and appeared on the CANSLIM.net BreakOuts Page, down from the prior session total of 89 stocks. The list of stocks hitting new 52-week highs expanded and easily outnumbered new 52-week lows on both the NYSE and the Nasdaq exchange. The new lows total on the Nasdaq exchange was in the single digits. There were gains for 8 of the 12 high-ranked companies currently included on the Featured Stocks Page.

Stocks traded in a narrow range throughout the session as investors digested a batch of weaker-than-expected earnings and a disappointing housing report. Sector action on the S&P was mixed. Financials were the best performing group as Bank of America Corp (BAC +1.1%) rose. Home builders Toll Brothers (TOL -1.2%) and KB Home (KBH -2.5%) were under pressure after June existing home sales unexpectedly declined -1.2%. On the earnings front, McDonald's Corp (MCD -2.7%) fell after the company posted earnings and revenues below analysts' estimates. In other news, shares of Yahoo! Inc (YHOO -4.3%) fell on news that the company was repurchasing over $1.1 billion in shares owned by Third Point.
Turning to fixed income markets, Treasuries were modestly higher along the curve. The benchmark 10-year note was up 3/32 to yield 2.49% and the 30-year bond was higher by 1/16 of a point to yield 3.55%.
The market (M criteria) has flashed substantial strength and leadership. Now in a confirmed rally, odds are considered favorable for investors' success with new buying efforts. Investors should be disciplined and selective while looking to be proactive and focused exclusively on the individual leaders best matching the winning models of the fact-based investment system. Study the companies on the CANSLIM.net Featured Stocks Page - a page showing the most action-worthy candidates' latest notes and links to additional resources including detailed analysis with data-packed graphs which are annotated by a Certified expert. The Premium Member Homepage - includes "dynamic archives" to all prior pay reports published. Watch for an announcement via email concerning the next WEBCAST.
PICTURED: The S&P 600 Small Cap Index is perched at all-time high after 4 consecutive weekly gains. The Small Cap Index is up +24.2% year-to-date.
|
 Kenneth J. Gruneisen started out as a licensed stockbroker in August 1987, a couple of months prior to the historic stock market crash that took the Dow Jones Industrial Average down -22.6% in a single day. He has published daily fact-based fundamental and technical analysis on high-ranked stocks online for two decades. Through FACTBASEDINVESTING.COM, Kenneth provides educational articles, news, market commentary, and other information regarding proven investment systems that work in good times and bad.
Comments contained in the body of this report are technical opinions only and are not necessarily those of Gruneisen Growth Corp. The material herein has been obtained from sources believed to be reliable and accurate, however, its accuracy and completeness cannot be guaranteed. Our firm, employees, and customers may effect transactions, including transactions contrary to any recommendation herein, or have positions in the securities mentioned herein or options with respect thereto. Any recommendation contained in this report may not be suitable for all investors and it is not to be deemed an offer or solicitation on our part with respect to the purchase or sale of any securities. |
|
 |
Gold & Silver Index Rallied Above 50-Day Average With Standout Gain
Kenneth J. Gruneisen - Passed the CAN SLIM® Master's Exam
The Bank Index ($BKX +0.98%) underpinned the major averages and the Healthcare Index ($HMO +0.76%) posted a small gain on Monday. The Retail Index ($RLX +0.19%) and Biotechnology Index ($BTK +0.19%) each also edged higher, meanwhile there was a slightly negative bias for rest of the tech sector with small losses from the Internet Index ($IIX -0.24%), Semiconductor Index ($SOX -0.21%), and the Networking Index ($NWX -0.05%). The Oil Services Index ($OSX -0.26%) and the Integrated Oil Index ($XOI -0.08%) inched lower and the Broker/Dealer Index ($XBD +0.04%) finished flat.
Charts courtesy www.stockcharts.com
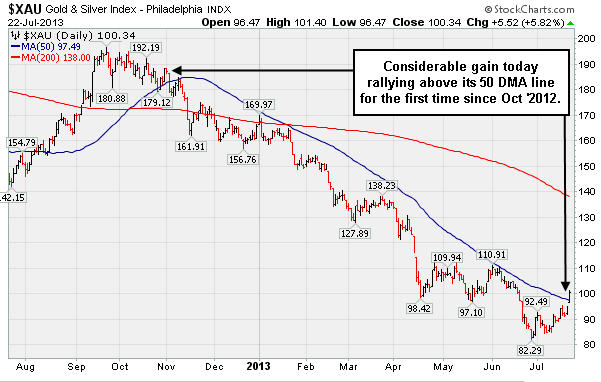
PICTURED: The Gold & Silver Index ($XAU +5.82%) was a standout gainer on Monday as it blasted above its 50-day moving average (DMA) line for the first time since October 2012.
| Oil Services |
$OSX |
271.33 |
-0.72 |
-0.26% |
+23.24% |
| Healthcare |
$HMO |
3,446.41 |
+26.15 |
+0.76% |
+37.08% |
| Integrated Oil |
$XOI |
1,405.87 |
-1.14 |
-0.08% |
+13.21% |
| Semiconductor |
$SOX |
485.15 |
-1.02 |
-0.21% |
+26.32% |
| Networking |
$NWX |
284.22 |
-0.13 |
-0.05% |
+25.46% |
| Internet |
$IIX |
403.43 |
-0.96 |
-0.24% |
+23.37% |
| Broker/Dealer |
$XBD |
134.37 |
+0.05 |
+0.04% |
+42.45% |
| Retail |
$RLX |
839.33 |
+1.55 |
+0.19% |
+28.52% |
| Gold & Silver |
$XAU |
100.34 |
+5.52 |
+5.82% |
-39.41% |
| Bank |
$BKX |
66.70 |
+0.65 |
+0.98% |
+30.07% |
| Biotech |
$BTK |
2,171.68 |
+4.05 |
+0.19% |
+40.38% |
|
|
|
 |
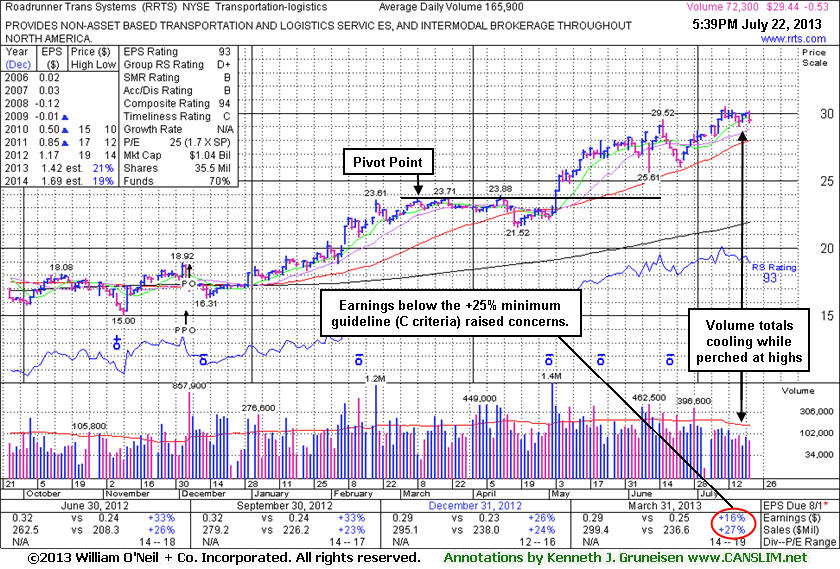
Perched Near High With Volume Totals Cooling
Kenneth J. Gruneisen - Passed the CAN SLIM® Master's Exam
Roadrunner Transportation Systems Inc (RRTS $-0.53 or -1.77% to 29.44) recently wedged higher without great volume conviction and it is perched near its 52-week high extended from any sound base. Volume totals have been cooling in recent weeks while holding its ground, a sign that few investors have been heading for the exit since last shown in this FSU section on 7/03/13 with an annotated graph under the headline, "Found Recent Support at 50-Day Moving Average Line".
Fundamental concerns were raised by earnings +16% on +27% sales revenues for the quarter ended March 31, 2013 versus the year ago period, below the +25% minimum earnings guideline (C criteria). It is more ideal when a company shows accelerating sales revenues and earnings increases. Often a bullish price/volume chart anticipates strong earnings results in the coming quarter, while bearish price/volume chart patterns frequently predict weaker earnings in the future. Time will say if it can resume growth above the +25% rate. Consensus estimates are currently calling for +21% and +19% earnings growth in FY '13 and '14, respectively. Earnings growth is crucial to the fact-based investment approach and obviously weighs into the newspaper's Earnings Per Share (EPS) rating system. Its current EPS rank of 93 is still well above the 80+ guideline for buy candidates.
Because the fact-based system suggests watching for technical sell signals before exiting profitable position it was previously noted - "Investors who may own it might choose to give the stock the benefit of the doubt unless it flashes any weak action, however a disciplined investor following the fact-based system would usually avoid making new buying efforts in any companies failing to solidly satisfy the fundamental guidelines."
The number of top-rated funds owning its shares rose from 168 in Jun '12 to 214 in Jun '13, a reassuring sign concerning the I criteria. The company completed a new Public Offering on 12/06/12 and, technically, it broke out above previously stubborn resistance in $19 area with volume-driven gains in January.
|
|
|
Color Codes Explained :
Y - Better candidates highlighted by our
staff of experts.
G - Previously featured
in past reports as yellow but may no longer be buyable under the
guidelines.
***Last / Change / Volume data in this table is the closing quote data***
Symbol/Exchange
Company Name
Industry Group |
PRICE |
CHANGE
(%Change) |
Day High |
Volume
(% DAV)
(% 50 day avg vol) |
52 Wk Hi
% From Hi |
Featured
Date |
Price
Featured |
Pivot Featured |
|
Max Buy |
AMBA
-
NASDAQ
Ambarella Inc
ELECTRONICS - Semiconductor - Specialized
|
$19.24
|
+0.28
1.48% |
$19.33
|
933,632
75.17% of 50 DAV
50 DAV is 1,242,000
|
$19.44
-1.03%
|
7/15/2013
|
$17.87
|
PP = $18.68
|
|
MB = $19.61
|
Most Recent Note - 7/18/2013 12:28:44 PM
Y - Reversed into the red after early gains into new high territory today. On the prior session it broke out from its latest base pattern with +65% above average volume triggering a new (or add-on) technical buy signal. See the latest FSU analysis for more details and a new annotated graph.
>>> The latest Featured Stock Update with an annotated graph appeared on 7/17/2013. Click here.
View all notes |
Alert me of new notes |
CANSLIM.net Company Profile |
SEC |
Zacks Reports |
StockTalk |
News |
Chart |
Request a new note
C
A N
S L
I M


|
CELG
-
NASDAQ
Celgene Corp
DRUGS - Drug Manufacturers - Major
|
$138.08
|
+2.19
1.61% |
$138.67
|
2,224,432
73.71% of 50 DAV
50 DAV is 3,017,700
|
$137.80
0.20%
|
7/11/2013
|
$133.25
|
PP = $131.92
|
|
MB = $138.52
|
Most Recent Note - 7/18/2013 12:40:33 PM
Y - Up from earlier lows after a small gap down today. Prior highs define initial support to watch. Breakaway gap and solid gain with twice average volume on 7/11/13 triggered a technical buy signal. Disciplined investors always limit losses by selling if any stock falls more than -7% from their purchase price.
>>> The latest Featured Stock Update with an annotated graph appeared on 7/11/2013. Click here.
View all notes |
Alert me of new notes |
CANSLIM.net Company Profile |
SEC |
Zacks Reports |
StockTalk |
News |
Chart |
Request a new note
C
A N
S L
I M
|
FLT
-
NYSE
Fleetcor Technologies
DIVERSIFIED SERVICES - Business/Management Services
|
$87.61
|
+0.74
0.85% |
$88.08
|
568,460
72.63% of 50 DAV
50 DAV is 782,700
|
$89.75
-2.38%
|
5/29/2013
|
$86.02
|
PP = $85.66
|
|
MB = $89.94
|
Most Recent Note - 7/18/2013 5:51:55 PM
G- Recently found support near its 50 DMA line with gains lacking volume conviction. Prior low ($80.28 on 6/21/13) defines the next important near-term support where a violation would raise more serious concerns. See the latest FSU analysis for more details and a new annotated graph.
>>> The latest Featured Stock Update with an annotated graph appeared on 7/18/2013. Click here.
View all notes |
Alert me of new notes |
CANSLIM.net Company Profile |
SEC |
Zacks Reports |
StockTalk |
News |
Chart |
Request a new note
C
A N
S L
I M
|
LOPE
-
NASDAQ
Grand Canyon Education
DIVERSIFIED SERVICES - Education and; Training Services
|
$34.88
|
+0.12
0.35% |
$35.10
|
297,085
69.94% of 50 DAV
50 DAV is 424,800
|
$36.45
-4.31%
|
6/19/2013
|
$31.47
|
PP = $34.17
|
|
MB = $35.88
|
 Most Recent Note - 7/22/2013 6:04:45 PM
Y - Consolidating quietly below its "max buy" level and its color code is changed to yellow. Prior highs in the $34 area define initial support above its 50 DMA line. Reports its second quarter results after market close on Tuesday, July 30, 2013.
>>> The latest Featured Stock Update with an annotated graph appeared on 7/19/2013. Click here.
View all notes |
Alert me of new notes |
CANSLIM.net Company Profile |
SEC |
Zacks Reports |
StockTalk |
News |
Chart |
Request a new note
C
A N
S L
I M
|
PCLN
-
NASDAQ
Priceline.Com Inc
INTERNET - Internet Software and Services
|
$900.48
|
+4.19
0.47% |
$908.00
|
468,762
61.97% of 50 DAV
50 DAV is 756,400
|
$926.40
-2.80%
|
7/8/2013
|
$878.28
|
PP = $847.43
|
|
MB = $889.80
|
Most Recent Note - 7/19/2013 5:54:01 PM
G - Endured mild distributional pressure this week while consolidating after getting extended from its prior base. Prior highs in the $847 area define initial support to watch on pullbacks.
>>> The latest Featured Stock Update with an annotated graph appeared on 7/9/2013. Click here.
View all notes |
Alert me of new notes |
CANSLIM.net Company Profile |
SEC |
Zacks Reports |
StockTalk |
News |
Chart |
Request a new note
C
A N
S L
I M
|
Symbol/Exchange
Company Name
Industry Group |
PRICE |
CHANGE
(%Change) |
Day High |
Volume
(% DAV)
(% 50 day avg vol) |
52 Wk Hi
% From Hi |
Featured
Date |
Price
Featured |
Pivot Featured |
|
Max Buy |
PRLB
-
NYSE
Proto Labs Inc
MANUFACTURING - Small Tools and Accessories
|
$63.74
|
-0.39
-0.61% |
$65.90
|
514,155
115.54% of 50 DAV
50 DAV is 445,000
|
$67.40
-5.43%
|
6/17/2013
|
$59.37
|
PP = $59.94
|
|
MB = $62.94
|
Most Recent Note - 7/19/2013 5:55:47 PM
G - Still holding its ground in a tight rage with volume totals cooling. Prior highs near $59 coincide with its 50 DMA line defining important support.
>>> The latest Featured Stock Update with an annotated graph appeared on 7/15/2013. Click here.
View all notes |
Alert me of new notes |
CANSLIM.net Company Profile |
SEC |
Zacks Reports |
StockTalk |
News |
Chart |
Request a new note
C
A N
S L
I M
|
RRTS
-
NYSE
Roadrunner Trans Systems
TRANSPORTATION - Air Delivery and Freight Service
|
$29.44
|
-0.53
-1.77% |
$30.20
|
72,342
43.61% of 50 DAV
50 DAV is 165,900
|
$30.50
-3.48%
|
4/3/2013
|
$22.77
|
PP = $23.75
|
|
MB = $24.94
|
Most Recent Note - 7/22/2013 6:02:05 PM
G - Perched near its 52-week high with volume totals cooling while extended from any sound base. Reports results for the Jun '13 quarter on Wednesday, July 31, 2013 after market close. See the latest FSU analysis for more details and a new annotated graph.
>>> The latest Featured Stock Update with an annotated graph appeared on 7/22/2013. Click here.
View all notes |
Alert me of new notes |
CANSLIM.net Company Profile |
SEC |
Zacks Reports |
StockTalk |
News |
Chart |
Request a new note
C
A N
S L
I M
|
SFUN
-
NYSE
Soufun Hldgs Ltd Ads A
INTERNET - Internet Information Providers
|
$30.32
|
-1.18
-3.75% |
$32.28
|
387,403
123.42% of 50 DAV
50 DAV is 313,900
|
$33.03
-8.20%
|
7/16/2013
|
$29.54
|
PP = $27.90
|
|
MB = $29.30
|
Most Recent Note - 7/22/2013 6:08:43 PM
G - Fell for a 4th consecutive loss today, yet it is still extended from its latest base. Prior highs in the $28-29 area define initial support to watch.
>>> The latest Featured Stock Update with an annotated graph appeared on 7/16/2013. Click here.
View all notes |
Alert me of new notes |
CANSLIM.net Company Profile |
SEC |
Zacks Reports |
StockTalk |
News |
Chart |
Request a new note
C
A N
S L
I M
|
SSNC
-
NASDAQ
S S & C Technologies
COMPUTER SOFTWARE and SERVICES - Application Software
|
$36.94
|
-0.06
-0.16% |
$37.57
|
253,253
54.89% of 50 DAV
50 DAV is 461,400
|
$38.47
-3.98%
|
7/11/2013
|
$35.80
|
PP = $34.54
|
|
MB = $36.27
|
Most Recent Note - 7/19/2013 5:58:50 PM
G - Holding its ground in a tight range near its all-time high with volume totals cooling. Extended from its prior base, and prior highs in the $34 area define initial support to watch on pullbacks.
>>> The latest Featured Stock Update with an annotated graph appeared on 7/12/2013. Click here.
View all notes |
Alert me of new notes |
CANSLIM.net Company Profile |
SEC |
Zacks Reports |
StockTalk |
News |
Chart |
Request a new note
C
A N
S L
I M
|
SSYS
-
NASDAQ
Stratasys Ltd
COMPUTER HARDWARE - Computer Peripherals
|
$90.27
|
+0.20
0.22% |
$92.18
|
437,873
51.56% of 50 DAV
50 DAV is 849,200
|
$96.44
-6.40%
|
7/8/2013
|
$91.44
|
PP = $95.00
|
|
MB = $99.75
|
Most Recent Note - 7/22/2013 6:06:33 PM
Y - Perched within close striking distance of its 52-week high and previously stubborn resistance in the $92-94 area. Did not yet rally for a close above the pivot point based on its 5/14/13 high plus 10 cents with sufficient volume to clinch a proper technical buy signal.
>>> The latest Featured Stock Update with an annotated graph appeared on 7/8/2013. Click here.
View all notes |
Alert me of new notes |
CANSLIM.net Company Profile |
SEC |
Zacks Reports |
StockTalk |
News |
Chart |
Request a new note
C
A N
S L
I M
|
Symbol/Exchange
Company Name
Industry Group |
PRICE |
CHANGE
(%Change) |
Day High |
Volume
(% DAV)
(% 50 day avg vol) |
52 Wk Hi
% From Hi |
Featured
Date |
Price
Featured |
Pivot Featured |
|
Max Buy |
VRX
-
NYSE
Valeant Pharmaceuticals
DRUGS - Drug Manufacturers - Other
|
$90.81
|
+0.01
0.01% |
$91.53
|
1,184,103
57.36% of 50 DAV
50 DAV is 2,064,200
|
$96.25
-5.65%
|
4/30/2013
|
$60.24
|
PP = $76.66
|
|
MB = $80.49
|
Most Recent Note - 7/19/2013 6:03:48 PM
Y- Completed a new Public Offering on 6/18/13 following recent M&A news. Formed a cup-with-handle base over the past 8 weeks, however no new pivot point is being cited. Concerns were raised by its Mar '13 earnings report with only a +14% earnings increase, below the +25% minimum guideline (C criteria) for buy candidates.
>>> The latest Featured Stock Update with an annotated graph appeared on 7/5/2013. Click here.
View all notes |
Alert me of new notes |
CANSLIM.net Company Profile |
SEC |
Zacks Reports |
StockTalk |
News |
Chart |
Request a new note
C
A N
S L
I M
|
YNDX
-
NASDAQ
Yandex N V Class A
INTERNET - Internet Information Providers
|
$31.46
|
+0.26
0.83% |
$31.57
|
2,407,525
101.25% of 50 DAV
50 DAV is 2,377,900
|
$31.46
0.00%
|
7/10/2013
|
$29.29
|
PP = $29.59
|
|
MB = $31.07
|
Most Recent Note - 7/17/2013 6:42:03 PM
Y - Posted a solid gain today for a new high close following a bout of distribution on the prior session. Found prompt support near prior highs in the $28-29 area defining initial support to watch on pullbacks.
>>> The latest Featured Stock Update with an annotated graph appeared on 7/10/2013. Click here.
View all notes |
Alert me of new notes |
CANSLIM.net Company Profile |
SEC |
Zacks Reports |
StockTalk |
News |
Chart |
Request a new note
C
A N
S L
I M
|
|
|
|
THESE ARE NOT BUY RECOMMENDATIONS!
Comments contained in the body of this report are technical
opinions only. The material herein has been obtained
from sources believed to be reliable and accurate, however,
its accuracy and completeness cannot be guaranteed.
This site is not an investment advisor, hence it does
not endorse or recommend any securities or other investments.
Any recommendation contained in this report may not
be suitable for all investors and it is not to be deemed
an offer or solicitation on our part with respect to
the purchase or sale of any securities. All trademarks,
service marks and trade names appearing in this report
are the property of their respective owners, and are
likewise used for identification purposes only.
This report is a service available
only to active Paid Premium Members.
You may opt-out of receiving report notifications
at any time. Questions or comments may be submitted
by writing to Premium Membership Services 665 S.E. 10 Street, Suite 201 Deerfield Beach, FL 33441-5634 or by calling 1-800-965-8307
or 954-785-1121.
|
|
|

