You are not logged in.
This means you
CAN ONLY VIEW reports that were published prior to Monday, April 14, 2025.
You
MUST UPGRADE YOUR MEMBERSHIP if you want to see any current reports.
AFTER MARKET UPDATE - WEDNESDAY, JULY 22ND, 2009
Previous After Market Report Next After Market Report >>>
|
|
|
|
DOW |
-34.68 |
8,881.26 |
-0.39% |
|
Volume |
1,079,561,330 |
-11% |
|
Volume |
2,388,947,610 |
+4% |
|
NASDAQ |
+10.18 |
1,926.38 |
+0.53% |
|
Advancers |
1,698 |
55% |
|
Advancers |
1,638 |
58% |
|
S&P 500 |
-0.51 |
954.07 |
-0.05% |
|
Decliners |
1,296 |
42% |
|
Decliners |
1,029 |
37% |
|
Russell 2000 |
+3.48 |
528.70 |
+0.66% |
|
52 Wk Highs |
59 |
|
|
52 Wk Highs |
61 |
|
|
S&P 600 |
+1.30 |
281.00 |
+0.46% |
|
52 Wk Lows |
2 |
|
|
52 Wk Lows |
15 |
|
|
 |
Nasdaq Composite Posts 11th Consecutive Gain
Kenneth J. Gruneisen - Passed the CAN SLIM® Master's Exam
The Dow Jones Industrial Average's small loss on Wednesday ended its 7 session winning streak, however the Nasdaq Composite made its 11th straight advance. The volume total on the NYSE was reported lighter than the prior session total while the Nasdaq exchange's volume total rose. Advancers led decliners on the NYSE by about a 4-to-3 ratio and by an 8-to-5 ratio on the Nasdaq exchange. There were 36 high-ranked companies from the CANSLIM.net Leaders List that made a new 52-week high and appeared on the CANSLIM.net BreakOuts Page, down from the 42 issues that appeared on the prior session. New 52-week highs again greatly outnumbered new lows.
Ben Bernanke continued his two-day address to Congress on Wednesday, speaking in front of the Senate Banking Committee. The Federal Reserve Chairman again warned that high unemployment is "the most pressing issue" as the country tries to recover from the longest recession since World War II. Mr. Bernanke also put himself at odds with the Obama administration by resisting its plan to create a U.S consumer protection agency for risky financial products. The Fed plans Thursday to issue a proposal to boost disclosures on mortgages and home equity lines of credit. It will include new rules covering the compensation of mortgage originators.
Of the approximately 100 companies in the S&P 500 Index that have reported earnings, 62% have topped analysts' forecasts, according to Standard & Poor's. Despite better-than-expected results from many banks, however, analysts are worried about deteriorating credit and messy balance sheets.
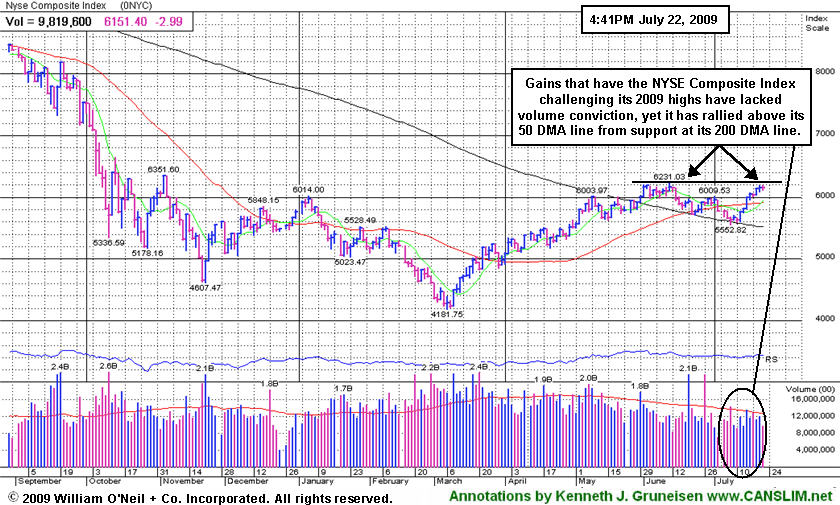
PICTURED: The NYSE Composite Index is challenging its 2009 high, however recent gains that helped it rally above its 50-day moving average (DMA) line from support near its 200 DMA line have lacked volume conviction.
|
 Kenneth J. Gruneisen started out as a licensed stockbroker in August 1987, a couple of months prior to the historic stock market crash that took the Dow Jones Industrial Average down -22.6% in a single day. He has published daily fact-based fundamental and technical analysis on high-ranked stocks online for two decades. Through FACTBASEDINVESTING.COM, Kenneth provides educational articles, news, market commentary, and other information regarding proven investment systems that work in good times and bad.
Comments contained in the body of this report are technical opinions only and are not necessarily those of Gruneisen Growth Corp. The material herein has been obtained from sources believed to be reliable and accurate, however, its accuracy and completeness cannot be guaranteed. Our firm, employees, and customers may effect transactions, including transactions contrary to any recommendation herein, or have positions in the securities mentioned herein or options with respect thereto. Any recommendation contained in this report may not be suitable for all investors and it is not to be deemed an offer or solicitation on our part with respect to the purchase or sale of any securities. |
|
 |
Retail Index Climbs Near 2009 Highs
Kenneth J. Gruneisen - Passed the CAN SLIM® Master's Exam
The Semiconductor Index ($SOX +2.65%) was a standout tech leader on Wednesday while the Internet Index ($IIX +0.31%) and Networking Index ($NWX +0.52%) each posted only modest gains and the Biotechnology Index ($BTK -0.41%) edged lower. The influential Bank Index ($BKX +0.95%) and Broker/Dealer Index ($XBD +0.99%) rose, helping somewhat to offset losses from the Oil Services Index ($OSX -1.59%) and Integrated Oil Index ($XOI -0.76%). The Healthcare Index ($HMO +0.57%) posted a small gain while the Gold & Silver Index ($XAU -0.01%) ended flat.
Charts courtesy www.stockcharts.com
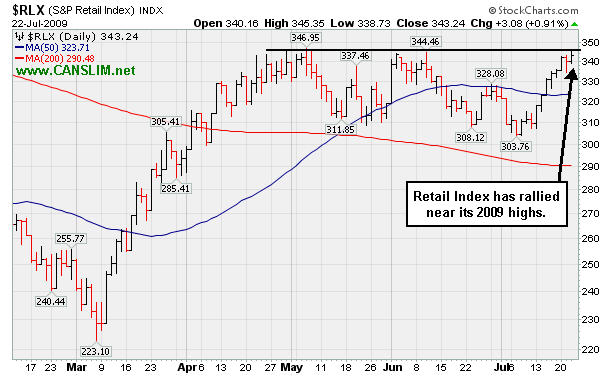
PICTURED: The Retail Index ($RLX +0.91%) has rallied near its 2009 chart highs after consolidating for the past 3 months above and below its 50-day moving average line. A rally to new 2009 highs from the influential RLX in the near-term would bode better for the broader market outlook.
| Oil Services |
$OSX |
166.72 |
-2.70 |
-1.59% |
+37.34% |
| Healthcare |
$HMO |
1,077.31 |
+6.07 |
+0.57% |
+12.20% |
| Integrated Oil |
$XOI |
936.77 |
-7.19 |
-0.76% |
-4.38% |
| Semiconductor |
$SOX |
301.77 |
+7.80 |
+2.65% |
+42.23% |
| Networking |
$NWX |
194.25 |
+1.00 |
+0.52% |
+35.00% |
| Internet |
$IIX |
199.21 |
+0.62 |
+0.31% |
+48.92% |
| Broker/Dealer |
$XBD |
101.27 |
+0.99 |
+0.99% |
+30.72% |
| Retail |
$RLX |
343.24 |
+3.08 |
+0.91% |
+22.91% |
| Gold & Silver |
$XAU |
148.14 |
-0.02 |
-0.01% |
+19.61% |
| Bank |
$BKX |
36.25 |
+0.34 |
+0.95% |
-18.21% |
| Biotech |
$BTK |
810.69 |
-3.34 |
-0.41% |
+25.27% |
|
|
|
 |
Relative Strength Has Slumped While Trading Under 50 Day Average
Kenneth J. Gruneisen - Passed the CAN SLIM® Master's Exam
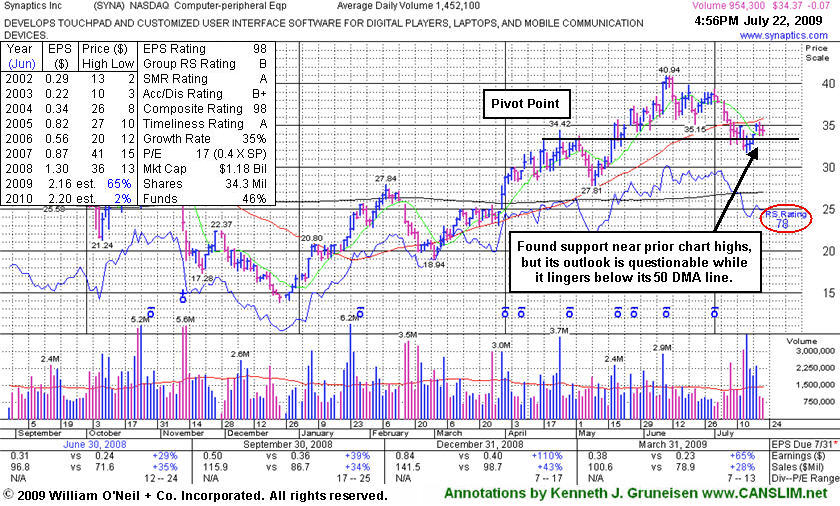
Synaptics Inc. (SYNA -$0.07 or -0.20% to $34.37) remains trading under its 50-day moving average (DMA) line after finding support near prior chart highs. Several recent gains on above average volume helped it rally back above its prior pivot point, but leave its rebound still short of its important short-term average which may now act as a stubborn resistance level. Its Relative Strength rank has slumped to 78 (see red circle), down from 88 on July 10th when it made its last appearance in this Featured Stock Update section under the headline, "50 Day Average and Upward Trendline Violations This Week Raised Concerns" (read here). For its outlook to improve, technically, it still needs to repair the 50 DMA violation and show signs of institutional demand. It found support near prior chart highs after 7 session losing streak and a worrisome gap down on 7/14/09. Deterioration under its $31.75 low on July 15th would raise raise more serious concerns and trigger additional technical sell signals. For now it should remain on an active watch list in the event it shows strength and completes a new sound base.
SYNA was first featured in yellow in the May 18, 2009 Mid-Day BreakOuts Report (read here). The number of top-rated funds owning its shares rose from 123 in June '08 to 201 in March '09, which is good news concerning the I criteria. Strong earnings and sales revenues growth in the 4 latest quarterly comparisons satisfies the C criteria. Its annual earnings (the A criteria) history showed a downturn in 2006, leaving concerns, but it followed that up with strong growth the next 2 years.
|
|
|
Color Codes Explained :
Y - Better candidates highlighted by our
staff of experts.
G - Previously featured
in past reports as yellow but may no longer be buyable under the
guidelines.
***Last / Change / Volume quote data in this table corresponds with the timestamp on the note***
Symbol/Exchange
Company Name
Industry Group |
Last |
Chg. |
Vol
% DAV |
Date Featured |
Price Featured |
Latest Pivot Point
Featured |
Status |
| Latest Max Buy Price |
CPLA
- NASDAQ
Capella Education Co
DIVERSIFIED SERVICES - Education and Training Services
|
$62.28
|
+0.15
|
301,428
141% DAV
213,062
|
7/9/2009
(Date
Featured) |
$59.69
(Price
Featured) |
PP = $62.06 |
Y |
| MB = $65.16 |
Most Recent Note - 7/22/2009 5:31:53 PM
Y - Hit a new 52-week high today while posting a 6th consecutive gain, yet volume behind its recent gains has not met or exceeded the +50% above average volume guideline as it has edged above its pivot point. Featured in yellow in the 7/09/09 Mid-Day BreakOuts Report (read here). The group has shown some leadership, yet currently has a E for a Relative Strength Rating. CPLA is a high-ranked leader in the Commercial Services-Schools Group. Its small supply of only 13.9 million shares in the float could contribute to greater price volatility in the event of institutional accumulation or distribution. The number of top-rated funds owning an interest rose from 91 in Sept '08, to 132 as of March '09, which is reassuring with respect to the I criteria. It has a very good earnings history that satisfies the C & A criteria, while recent quarters showed steady sales revenues increases in the +17-18% range.
>>> The latest Featured Stock Update with an annotated graph appeared on 7/20/2009. click here.
|
|
C
A
S
I |
News |
Chart |
SEC
View all notes Alert
me of new notes
Company
Profile
|
GMCR
- NASDAQ
Green Mtn Coffee Roastrs
FOOD & BEVERAGE - Processed & Packaged Goods
|
$65.74
|
-0.35
|
771,377
60% DAV
1,287,401
|
7/17/2009
(Date
Featured) |
$60.15
(Price
Featured) |
PP = $63.79 |
Y |
| MB = $66.98 |
Most Recent Note - 7/22/2009 5:42:26 PM
Y - Consolidating quietly in a tight range after a considerable rally above its pivot point on 7/20/09 to a new all-time high with three times average volume triggered a technical buy signal. Its recent chart highs may now be viewed as initial support to watch above its 50 DMA line. On 6/09/09 a 3:2 stock split took effect. GMCR traded up more than +158% since appearing with an annotated graph under the headline "It May Soon Be Time To Go Green" when featured in the January 2009 CANSLIM.net News (read here).
>>> The latest Featured Stock Update with an annotated graph appeared on 7/16/2009. click here.
|
|
C
A
S
I |
News |
Chart |
SEC
View all notes Alert
me of new notes
Company
Profile
|
HMSY
- NASDAQ
H M S Holdings Corp
COMPUTER SOFTWARE & SERVICES - Healthcare Information Service
|
$40.59
|
-1.33
|
332,628
104% DAV
318,882
|
2/20/2009
(Date
Featured) |
$34.08
(Price
Featured) |
PP = $38.38 |
G |
| MB = $40.30 |
Most Recent Note - 7/22/2009 5:46:00 PM
G - Loss today on near average volume, pulling back near its previously cited "max buy" level. No overhead supply is left to hinder the progress for this high-ranked Commercial Services - Healthcare firm. Recently tested prior highs in the $38 area which are a very important initial support level above its 50 DMA line. A gap up gain on 6/16/09 with heavy volume triggered a technical buy signal.
>>> The latest Featured Stock Update with an annotated graph appeared on 7/13/2009. click here.
|
|
C
A
S
I |
News |
Chart |
SEC
View all notes Alert
me of new notes
Company
Profile
|
NTES
- NASDAQ
Netease Inc Adr
INTERNET - Internet Information Providers
|
$43.60
|
+1.98
|
3,804,780
151% DAV
2,520,683
|
7/17/2009
(Date
Featured) |
$39.29
(Price
Featured) |
PP = $38.74 |
G |
| MB = $40.68 |
Most Recent Note - 7/22/2009 6:46:22 PM
G - Considerable gain today on heavy volume for a 10th consecutive gain, rising well above its max buy level. It is extended from its lastest base. On 7/17/09 it broke out from a 5-week flat base with +44% above average volume behind its gain. First featured at $26.75 in the 3/31/09 CANSLIM.net Mid-Day Breakouts Report (read here). This high-ranked Chinese Internet - Content firm was also summarized in greater detail including an annotated graph in the April 2009 issue of CANSLIM.net News (read here).
>>> The latest Featured Stock Update with an annotated graph appeared on 7/14/2009. click here.
|
|
C
A
S
I |
News |
Chart |
SEC
View all notes Alert
me of new notes
Company
Profile
|
NVEC
- NASDAQ
N V E Corp
ELECTRONICS - Semiconductor - Specialized
|
$48.78
|
+0.73
|
105,855
115% DAV
91,979
|
3/13/2009
(Date
Featured) |
$33.85
(Price
Featured) |
PP = $45.50 |
G |
| MB = $47.78 |
Most Recent Note - 7/22/2009 7:03:26 PM
G - Gain today with slightly above average volume for its second best close ever. Its 50 DMA line is important support to watch, where a violation would raise concerns and trigger a technical sell signal. Color code is changed to green, as it currently needs more time to form a new sound base within guidelines. Sales increases in recent comparisons have been under the +25% guideline and still rather minuscule, leaving concerns, especially in the event of any hiccups. This is a reason to be especially disciplined about proper entries and exits.
>>> The latest Featured Stock Update with an annotated graph appeared on 7/17/2009. click here.
|
|
C
A
S
I |
News |
Chart |
SEC
View all notes Alert
me of new notes
Company
Profile
|
SNDA
-
|
$61.93
|
+4.16
|
2,048,140
148% DAV
1,379,502
|
5/31/2009
(Date
Featured) |
$57.62
(Price
Featured) |
PP = $65.10 |
Y |
| MB = $68.36 |
Most Recent Note - 7/22/2009 7:11:37 PM
Y - Considerable gain today with above average volume, rallying well above its 50 DMA line toward prior chart highs. Color code was changed to yellow with new pivot point and max buy levels noted. Detailed analysis was included when recently featured in the June 2009 issue of CANSLIM.net News. Be sure to review the "What to Look Out For" section and entire detailed summary - read here).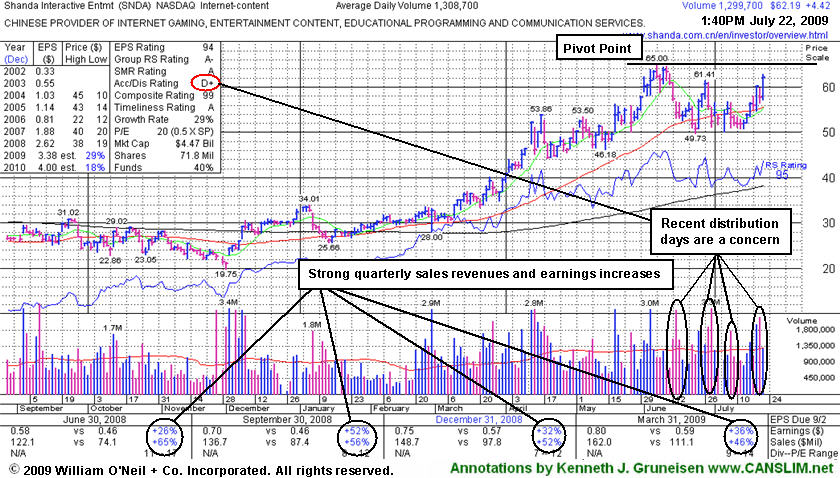
>>> The latest Featured Stock Update with an annotated graph appeared on 7/15/2009. click here.
|
|
C
A
S
I |
News |
Chart |
SEC
View all notes Alert
me of new notes
Company
Profile
|
SYNA
- NASDAQ
Synaptics Inc
COMPUTER SOFTWARE & SERVICES - Information Technology Service
|
$34.37
|
-0.07
|
964,556
66% DAV
1,451,962
|
5/18/2009
(Date
Featured) |
$32.58
(Price
Featured) |
PP = $34.52 |
G |
| MB = $36.25 |
Most Recent Note - 7/22/2009 7:14:40 PM
G - Small loss on light volume today, remaining below its 50 DMA line. Its outlook would improve if it rises back above that short-term average. First featured in yellow in the May 18, 2009 mid-day report (read here). The number of top-rated funds owning its shares rose from 123 in June '08 to 201 in March '09, which is good news concerning the I criteria. Its annual earnings (the A criteria) history showed a dowturn in 2006, leaving concerns, but it followed that up with strong growth the next 2 years. Its small supply of shares (the S criteria) outstanding could contribute to especially great volatility in the event of institutional accumulation or distribution.
>>> The latest Featured Stock Update with an annotated graph appeared on 7/22/2009. click here.
|
|
C
A
S
I |
News |
Chart |
SEC
View all notes Alert
me of new notes
Company
Profile
|
TNDM
- NASDAQ
Tandem Diabetes Care Inc
TELECOMMUNICATIONS - Wireless Communications
|
$30.70
|
-0.05
|
370,359
39% DAV
950,296
|
3/2/2009
(Date
Featured) |
$18.89
(Price
Featured) |
PP = $29.85 |
G |
| MB = $31.34 |
Most Recent Note - 7/22/2009 7:18:30 PM
G - Quietly consolidating just -5.7% off its all-time high, above its 50 DMA line, building on a choppy base since its June 2nd high of $32.57 was reached. Subsequent deterioration below that short-term average and recent lows would raise concerns and trigger sell signals. It traded up as much as +72.42% since first featured at $18.89 in the 3/02/09 Mid-Day BreakOuts Report (read here).
>>> The latest Featured Stock Update with an annotated graph appeared on 7/21/2009. click here.
|
|
C
A
S
I |
News |
Chart |
SEC
View all notes Alert
me of new notes
Company
Profile
|
|
|
|
THESE ARE NOT BUY RECOMMENDATIONS!
Comments contained in the body of this report are technical
opinions only. The material herein has been obtained
from sources believed to be reliable and accurate, however,
its accuracy and completeness cannot be guaranteed.
This site is not an investment advisor, hence it does
not endorse or recommend any securities or other investments.
Any recommendation contained in this report may not
be suitable for all investors and it is not to be deemed
an offer or solicitation on our part with respect to
the purchase or sale of any securities. All trademarks,
service marks and trade names appearing in this report
are the property of their respective owners, and are
likewise used for identification purposes only.
This report is a service available
only to active Paid Premium Members.
You may opt-out of receiving report notifications
at any time. Questions or comments may be submitted
by writing to Premium Membership Services 665 S.E. 10 Street, Suite 201 Deerfield Beach, FL 33441-5634 or by calling 1-800-965-8307
or 954-785-1121.
|
|
|

