You are not logged in.
This means you
CAN ONLY VIEW reports that were published prior to Monday, March 10, 2025.
You
MUST UPGRADE YOUR MEMBERSHIP if you want to see any current reports.
AFTER MARKET UPDATE - TUESDAY, JULY 21ST, 2009
Previous After Market Report Next After Market Report >>>
|
|
|
|
DOW |
+67.79 |
8,915.94 |
+0.77% |
|
Volume |
1,207,021,290 |
+7% |
|
Volume |
2,296,367,240 |
+10% |
|
NASDAQ |
+6.91 |
1,916.20 |
+0.36% |
|
Advancers |
1,615 |
52% |
|
Advancers |
1,164 |
41% |
|
S&P 500 |
+3.45 |
954.58 |
+0.36% |
|
Decliners |
1,382 |
44% |
|
Decliners |
1,499 |
53% |
|
Russell 2000 |
-1.74 |
525.22 |
-0.33% |
|
52 Wk Highs |
75 |
|
|
52 Wk Highs |
58 |
|
|
S&P 600 |
-0.75 |
279.70 |
-0.27% |
|
52 Wk Lows |
3 |
|
|
52 Wk Lows |
15 |
|
|
 |
Stocks Extend Best Winning Streak in Years
Kenneth J. Gruneisen - Passed the CAN SLIM® Master's Exam
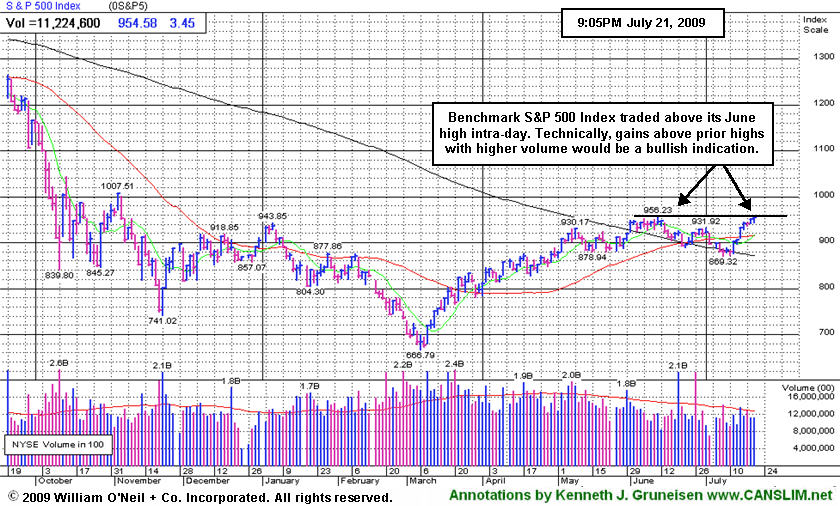
Dow Jones Industrial Average rose above its June highs as it posted a 7th straight gain, its longest rally in two years, while the Nasdaq Composite made its 10th straight advance. The reported volume total on the NYSE and on the Nasdaq exchange rose above the prior session total. Advancers and decliners were fairly evenly mixed, but showed a slightly positive bias on the NYSE and a slightly negative bias on the Nasdaq exchange. There were 42 high-ranked companies from the CANSLIM.net Leaders List that made a new 52-week high and appeared on the CANSLIM.net BreakOuts Page, up a couple of notches from the 40 issues that appeared on the prior session. New 52-week highs again greatly outnumbered new lows.
Federal Reserve Chairman Ben S. Bernanke said the economy is showing “tentative signs of stabilization,” and that “limited inflation pressures” will allow policy makers to keep interest rates near zero for an “extended period.” White House National Economic Council Director Lawrence Summers chastised some banks that received government aid for not doing enough to reduce foreclosures. Summers said President Obama had not consulted him on the potential reappointment of Federal Reserve Chairman Ben S. Bernanke. Summers is regarded by Fed watchers as a potential candidate if Bernanke is not given a second 4-year term.
The US dollar climbed from a six-week low versus the euro on and the yen. Crude oil for August delivery rose +1.2% to $64.72 a barrel on the New York Mercantile Exchange, the highest settlement since July 2nd. Speculation swirled about CIT Group (CIT -21.60%), which just raised $3 billion in loans from a group of bondholders, eventually up filing bankruptcy. After General Motors recently received billions in bailout funds and raised capital, yet ultimately filed bankruptcy, there is a well-established precedent firmly in place.
PICTURED: The Benchmark S&P 500 Index traded above its June high intra-day. Technically, gains above prior highs with higher volume would be a very bullish indication which would help the near-erm market outlook improve further.
|
 Kenneth J. Gruneisen started out as a licensed stockbroker in August 1987, a couple of months prior to the historic stock market crash that took the Dow Jones Industrial Average down -22.6% in a single day. He has published daily fact-based fundamental and technical analysis on high-ranked stocks online for two decades. Through FACTBASEDINVESTING.COM, Kenneth provides educational articles, news, market commentary, and other information regarding proven investment systems that work in good times and bad.
Comments contained in the body of this report are technical opinions only and are not necessarily those of Gruneisen Growth Corp. The material herein has been obtained from sources believed to be reliable and accurate, however, its accuracy and completeness cannot be guaranteed. Our firm, employees, and customers may effect transactions, including transactions contrary to any recommendation herein, or have positions in the securities mentioned herein or options with respect thereto. Any recommendation contained in this report may not be suitable for all investors and it is not to be deemed an offer or solicitation on our part with respect to the purchase or sale of any securities. |
|
 |
Bank Index Retreats From 200 Day Average
Kenneth J. Gruneisen - Passed the CAN SLIM® Master's Exam
The Biotechnology Index ($BTK +2.75%) was one of the standout gainers on Tuesday as it added to the prior session's huge gain -which was shown in this report with an annotated graph illustrating its breakout and earlier 50 & 200 DMA bullish crossover (read here). Energy related shares rose, helping the Integrated Oil Index ($XOI +0.70%) and Oil Services Index ($OSX +1.05%) each post modest gains. The Internet Index ($IIX +0.31%) and Networking Index ($NWX +0.46%) posted modest gains while the Retail Index ($RLX -0.61%) and defensive Healthcare Index ($HMO -0.41%) and Gold & Silver Index ($XAU -0.77%) both pulled back. The Broker/Dealer Index ($XBD -0.02%) and Semiconductor Index ($SOX -0.05%) ended little changed on the day.
Charts courtesy www.stockcharts.com
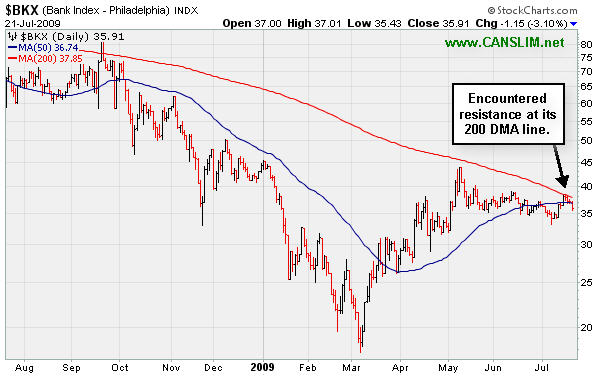
PICTURED: The Bank Index ($BKX -3.10%) has slumped back under its 50-day moving average (DMA) line after encountering resistance at its 200 DMA line. Its 50 DMA line remains under its 200 DMA line, but is coming closer to crossing over in a bullish fashion like the above mentioned BTK.
| Oil Services |
$OSX |
169.42 |
+1.76 |
+1.05% |
+39.57% |
| Healthcare |
$HMO |
1,071.24 |
-4.44 |
-0.41% |
+11.57% |
| Integrated Oil |
$XOI |
943.96 |
+6.57 |
+0.70% |
-3.65% |
| Semiconductor |
$SOX |
293.97 |
-0.16 |
-0.05% |
+38.55% |
| Networking |
$NWX |
193.25 |
+0.88 |
+0.46% |
+34.30% |
| Internet |
$IIX |
198.59 |
+0.61 |
+0.31% |
+48.46% |
| Broker/Dealer |
$XBD |
100.28 |
-0.02 |
-0.02% |
+29.44% |
| Retail |
$RLX |
340.16 |
-2.08 |
-0.61% |
+21.81% |
| Gold & Silver |
$XAU |
148.16 |
-1.15 |
-0.77% |
+19.63% |
| Bank |
$BKX |
35.91 |
-1.15 |
-3.10% |
-18.98% |
| Biotech |
$BTK |
814.03 |
+21.79 |
+2.75% |
+25.78% |
|
|
|
 |
Recent Gains Lacking Volume As Choppy Consolidation Continues
Kenneth J. Gruneisen - Passed the CAN SLIM® Master's Exam
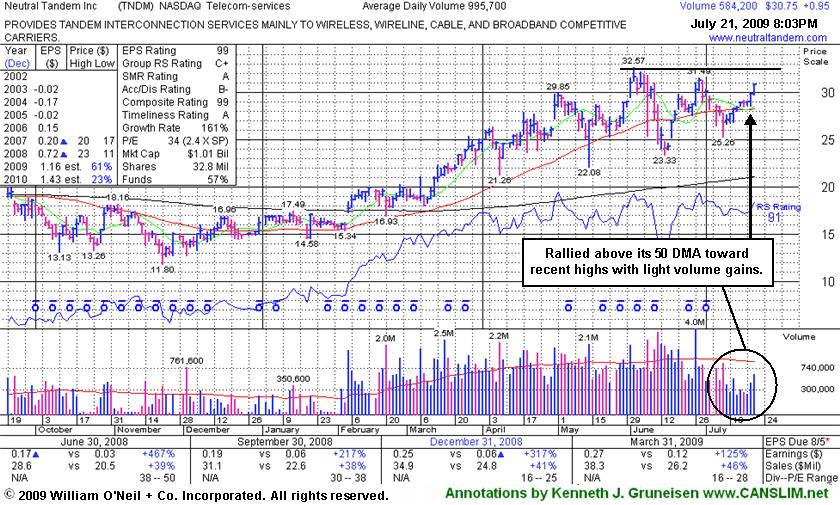
Neutral Tandem Inc (TNDM +$0.95 or +3.19% to $30.75) has recently rallied above its 50-day moving average (DMA) line, rising toward recent highs with light volume gains. Its prior rebound above the 50 DMA line ran out of steam short of its prior chart highs. TNDM had traded up as much as +72.42% since first featured at $18.89 in the 3/02/09 Mid-Day BreakOuts Report (read here).
Technical sell signals and heavy distribution completely negated its latest breakout above the previously cited pivot point of $29.85 based upon the stock's May 1st high. Its choppy consolidation over the past 6-weeks since it reached an all-time high of $32.57 is not a very sound looking base. This high-ranked leader should remain on an active watch list until a sound new base has formed. Technically, a gain above its most recent chart high ($31.49 on 6/29/09) with volume conviction would help improve its near-term outlook. Meanwhile, any subsequent deterioration below its 50 DMA line would raise more serious concerns.
|
|
|
Color Codes Explained :
Y - Better candidates highlighted by our
staff of experts.
G - Previously featured
in past reports as yellow but may no longer be buyable under the
guidelines.
***Last / Change / Volume quote data in this table corresponds with the timestamp on the note***
Symbol/Exchange
Company Name
Industry Group |
Last |
Chg. |
Vol
% DAV |
Date Featured |
Price Featured |
Latest Pivot Point
Featured |
Status |
| Latest Max Buy Price |
CPLA
- NASDAQ
Capella Education Co
DIVERSIFIED SERVICES - Education and Training Services
|
$62.13
|
+0.10
|
159,692
75% DAV
213,062
|
7/9/2009
(Date
Featured) |
$59.69
(Price
Featured) |
PP = $62.06 |
Y |
| MB = $65.16 |
Most Recent Note - 7/21/2009 8:30:50 PM
Y - Hovering near its 52-week high, it posted a 5th consecutive gain today on below average volume, closing near its pivot point. Featured in yellow in the 7/09/09 Mid-Day BreakOuts Report (read here). Color code was changed to yellow based on its resilience. The group has shown some leadership, yet currently has a E for a Relative Strength Rating. CPLA is a high-ranked leader in the Commercial Services-Schools Group. Its small supply of only 13.9 million shares in the float could contribute to greater price volatility in the event of institutional accumulation or distribution. The number of top-rated funds owning an interest rose from 91 in Sept '08, to 132 as of March '09, which is reassuring with respect to the I criteria. It has a very good earnings history that satisfies the C & A criteria, while recent quarters showed steady sales revenues increases in the +17-18% range.
>>> The latest Featured Stock Update with an annotated graph appeared on 7/20/2009. click here.
|
|
C
A
S
I |
News |
Chart |
SEC
View all notes Alert
me of new notes
Company
Profile
|
GMCR
- NASDAQ
Green Mtn Coffee Roastrs
FOOD & BEVERAGE - Processed & Packaged Goods
|
$65.51
|
-1.50
|
1,023,330
79% DAV
1,287,401
|
7/17/2009
(Date
Featured) |
$60.15
(Price
Featured) |
PP = $63.79 |
Y |
| MB = $66.98 |
Most Recent Note - 7/21/2009 1:05:53 PM
Y - Consolidating after a rally above its pivot point to a new all-time high with three times average volume triggered a technical buy signal on the prior session. Its recent chart highs may now be viewed as initial support to watch above its 50 DMA line. On 6/09/09 a 3:2 stock split took effect. GMCR traded up more than +158% since appearing with an annotated graph under the headline "It May Soon Be Time To Go Green" when featured in the January 2009 CANSLIM.net News (read here).
>>> The latest Featured Stock Update with an annotated graph appeared on 7/16/2009. click here.
|
|
C
A
S
I |
News |
Chart |
SEC
View all notes Alert
me of new notes
Company
Profile
|
HMSY
- NASDAQ
H M S Holdings Corp
COMPUTER SOFTWARE & SERVICES - Healthcare Information Service
|
$41.92
|
+0.30
|
135,925
N/A
|
2/20/2009
(Date
Featured) |
$34.08
(Price
Featured) |
PP = $38.38 |
G |
| MB = $40.30 |
Most Recent Note - 7/21/2009 8:32:54 PM
G - Hovering near all-time highs, extended from its last sound base. No overhead supply is left to hinder the progress for this Commercial Services - Healthcare firm. Recently tested prior highs in the $38 area which are a very important initial support level above its 50 DMA line. A gap up gain on 6/16/09 with heavy volume triggered a technical buy signal.
>>> The latest Featured Stock Update with an annotated graph appeared on 7/13/2009. click here.
|
|
C
A
S
I |
News |
Chart |
SEC
View all notes Alert
me of new notes
Company
Profile
|
NTES
- NASDAQ
Netease Inc Adr
INTERNET - Internet Information Providers
|
$41.62
|
+0.64
|
2,497,959
N/A
|
7/17/2009
(Date
Featured) |
$39.29
(Price
Featured) |
PP = $38.74 |
G |
| MB = $40.68 |
Most Recent Note - 7/21/2009 8:37:03 PM
G - Today was its 9th consecutive gain, rising above its max buy level with average volume. Its color code is changed to green. On 7/17/09 it broke out from a 5-week flat base with +44% above average volume behind its gain. Remember that volume should be at least +50% above average to confirm a sound breakout. It found support and promptly repaired its 7/08/09 violation of its 50 DMA line which had triggered a technical sell signal. First featured at $26.75 in the 3/31/09 CANSLIM.net Mid-Day Breakouts Report (read here). This high-ranked Chinese Internet - Content firm was also summarized in greater detail including an annotated graph in the April 2009 issue of CANSLIM.net News (read here).
>>> The latest Featured Stock Update with an annotated graph appeared on 7/14/2009. click here.
|
|
C
A
S
I |
News |
Chart |
SEC
View all notes Alert
me of new notes
Company
Profile
|
NVEC
- NASDAQ
N V E Corp
ELECTRONICS - Semiconductor - Specialized
|
$48.05
|
+0.01
|
61,948
N/A
|
3/13/2009
(Date
Featured) |
$33.85
(Price
Featured) |
PP = $45.50 |
Y |
| MB = $47.78 |
Most Recent Note - 7/21/2009 8:36:13 PM
Y - Perched near its 52-week high after yet another light volume gain today. Its 50 DMA line is important support to watch, where a violation would raise concerns and trigger a technical sell signal. Color code was changed to yellow based its resilience near its 50 DMA after its 6/19/09 breakout from an "ascending base" type pattern was negated. Sales increases in recent comparisons have been under the +25% guideline and still rather minuscule, leaving concerns, especially in the event of any hiccups. This is a reason to be especially disciplined about proper entries and exits.
>>> The latest Featured Stock Update with an annotated graph appeared on 7/17/2009. click here.
|
|
C
A
S
I |
News |
Chart |
SEC
View all notes Alert
me of new notes
Company
Profile
|
SNDA
-
|
$57.77
|
-2.42
|
2,166,734
N/A
|
5/31/2009
(Date
Featured) |
$57.62
(Price
Featured) |
PP = $53.95 |
G |
| MB = $56.65 |
Most Recent Note - 7/21/2009 6:23:01 PM
G - Gapped down today for a loss on higher volume than the prior session, erasing a large part of the prior session's gain that had helped it rally well above its 50 DMA line. Detailed analysis was included when recently featured in the June 2009 issue of CANSLIM.net News. Be sure to review the "What to Look Out For" section and entire detailed summary - read here).
>>> The latest Featured Stock Update with an annotated graph appeared on 7/15/2009. click here.
|
|
C
A
S
I |
News |
Chart |
SEC
View all notes Alert
me of new notes
Company
Profile
|
SYNA
- NASDAQ
Synaptics Inc
COMPUTER SOFTWARE & SERVICES - Information Technology Service
|
$34.44
|
-0.49
|
1,034,819
N/A
|
5/18/2009
(Date
Featured) |
$32.58
(Price
Featured) |
PP = $34.52 |
G |
| MB = $36.25 |
Most Recent Note - 7/21/2009 6:24:30 PM
G - Small loss on light volume today, remaining below its 50 DMA line. Its outlook would improve if it rises back above that short-term average. First featured in yellow in the May 18, 2009 mid-day report (read here). The number of top-rated funds owning its shares rose from 123 in June '08 to 201 in March '09, which is good news concerning the I criteria. Its annual earnings (the A criteria) history showed a dowturn in 2006, leaving concerns, but it followed that up with strong growth the next 2 years. Its small supply of shares (the S criteria) outstanding could contribute to especially great volatility in the event of institutional accumulation or distribution.
>>> The latest Featured Stock Update with an annotated graph appeared on 7/10/2009. click here.
|
|
C
A
S
I |
News |
Chart |
SEC
View all notes Alert
me of new notes
Company
Profile
|
TNDM
- NASDAQ
Tandem Diabetes Care Inc
TELECOMMUNICATIONS - Wireless Communications
|
$30.75
|
+0.95
|
586,389
N/A
|
3/2/2009
(Date
Featured) |
$18.89
(Price
Featured) |
PP = $29.85 |
G |
| MB = $31.34 |
Most Recent Note - 7/21/2009 6:39:03 PM
G - A third consecutive gain on below average volume helped it rise further above its 50 DMA line today, closing just -5.6% off its all-time high. Subsequent deterioration below that short-term average and recent lows would raise concerns and trigger sell signals. Its choppy chart offers no sound base per the investment system's guidelines. It traded up as much as +72.42% since first featured at $18.89 in the 3/02/09 Mid-Day BreakOuts Report (read here).
>>> The latest Featured Stock Update with an annotated graph appeared on 7/21/2009. click here.
|
|
C
A
S
I |
News |
Chart |
SEC
View all notes Alert
me of new notes
Company
Profile
|
|
|
|
THESE ARE NOT BUY RECOMMENDATIONS!
Comments contained in the body of this report are technical
opinions only. The material herein has been obtained
from sources believed to be reliable and accurate, however,
its accuracy and completeness cannot be guaranteed.
This site is not an investment advisor, hence it does
not endorse or recommend any securities or other investments.
Any recommendation contained in this report may not
be suitable for all investors and it is not to be deemed
an offer or solicitation on our part with respect to
the purchase or sale of any securities. All trademarks,
service marks and trade names appearing in this report
are the property of their respective owners, and are
likewise used for identification purposes only.
This report is a service available
only to active Paid Premium Members.
You may opt-out of receiving report notifications
at any time. Questions or comments may be submitted
by writing to Premium Membership Services 665 S.E. 10 Street, Suite 201 Deerfield Beach, FL 33441-5634 or by calling 1-800-965-8307
or 954-785-1121.
|
|
|

