You are not logged in.
This means you
CAN ONLY VIEW reports that were published prior to Monday, April 14, 2025.
You
MUST UPGRADE YOUR MEMBERSHIP if you want to see any current reports.
AFTER MARKET UPDATE - TUESDAY, JULY 20TH, 2010
Previous After Market Report Next After Market Report >>>
|
|
|
|
DOW |
+75.53 |
10,229.96 |
+0.74% |
|
Volume |
1,126,322,940 |
+18% |
|
Volume |
1,891,655,800 |
+12% |
|
NASDAQ |
+24.26 |
2,222.49 |
+1.10% |
|
Advancers |
2,476 |
79% |
|
Advancers |
1,855 |
67% |
|
S&P 500 |
+12.23 |
1,083.48 |
+1.14% |
|
Decliners |
563 |
18% |
|
Decliners |
771 |
28% |
|
Russell 2000 |
+11.16 |
624.24 |
+1.82% |
|
52 Wk Highs |
128 |
|
|
52 Wk Highs |
21 |
|
|
S&P 600 |
+5.86 |
336.71 |
+1.77% |
|
52 Wk Lows |
41 |
|
|
52 Wk Lows |
76 |
|
|
 |
Volume Totals Rise as Leadership Improves Amid Earnings News
Adam Sarhan, Contributing Writer,
The major averages erased earlier losses and ended near their intra-day highs as investors digested the latest round of economic and earnings data. Volume, an important indicator of institutional sponsorship, was higher than Monday's level on both exchanges. There were 18 high-ranked companies from the CANSLIM.net Leaders List that made a new 52-week high and appeared on the CANSLIM.net BreakOuts Page, higher from the 7 issues that appeared on the prior session. Advancers led decliners by over a 4-to-1 ratio on the NYSE and by over a 2-to-1 ratio on the Nasdaq exchange. New 52-week highs solidly outnumbered new 52-week lows on the NYSE but trailed on the Nasdaq exchange. For the rally to have ongoing success it will be critical for a healthy crop of leaders to continue showing up hitting new 52-week highs.
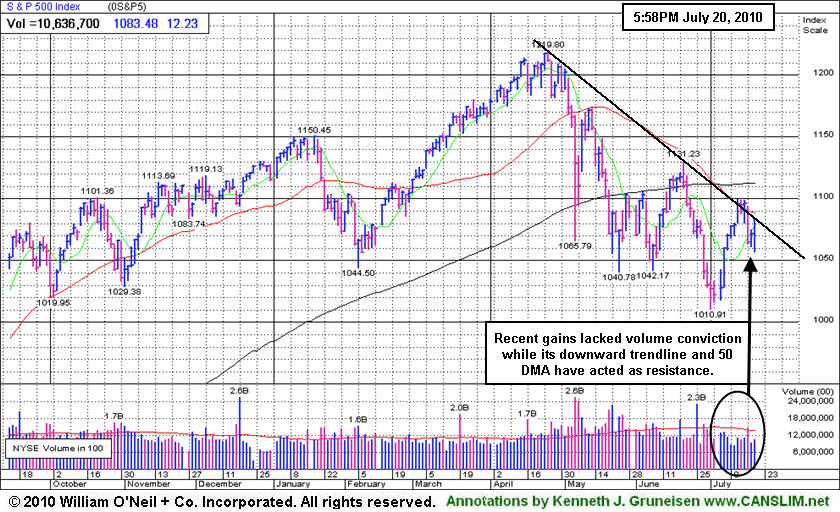
International Business Machines Corp. (IBM -2.50%), Texas Instruments Inc. (TXN -3.05%), Johnson & Johnson (JNJ -1.66%), and Goldman Sachs Inc (GS +2.22%) were among the high profile companies that reported earnings since Monday's close. Initially, stocks opened lower due to a general disappointment with their numbers but the bulls showed up in the second half of the session which was an encouraging sign. A slew of housing stocks rallied after building permits rose last month. However, housing starts, which measure new production, fell in June to their lowest level since October after the government tax incentive expired. After Tuesday's close, Yahoo Inc. (YHOO +0.66%) and Apple Inc. (AAPL +2.57%) released their latest quarterly results. As always, it will be very interesting to see how the market reacts to the latest earnings reports and guidance.
Looking forward, the window remains open for disciplined investors to carefully buy high-ranked stocks. Since the current rally began on July 1, the major averages have rallied on suspiciously light volume for the most part. It is ideal to see volume expand as the major averages break above resistance and see a new batch of high-ranked leaders trigger fresh technical buy signals. These latest improvements are helping to confirm this nascent rally and provide a reassurance that odds are more favorable for successful investing using the fact-based system.
PICTURED: The S&P 500 Index's chart shows that recent gains lacked volume conviction while its downward trendline and 50-day moving average (DMA) line have acted as resistance.
|
|
|
 |
Retail and Commodity-Linked Groups Led Gainers
Kenneth J. Gruneisen - Passed the CAN SLIM® Master's Exam
The Retail Index ($RLX +1.95%) and commodity-linked groups were among Tuesday's best gainers as the Gold & Silver Index ($XAU +2.32%), Integrated Oil Index ($XOI +1.17%), and Oil Services Index ($OSX +3.40%) posted solid gains. The tech sector posted modest gains across the board in the Biotechnology Index ($BTK +0.30%), Networking Index ($NWX +0.58%), and the Internet Index ($IIX +1.10%). Meanwhile, the Semiconductor Index ($SOX +0.05%), Healthcare Index ($HMO -0.08%) and the influential Bank Index ($BKX -0.17%) and Broker/Dealer Index ($XBD +0.06%) each held their ground.
Charts courtesy www.stockcharts.com
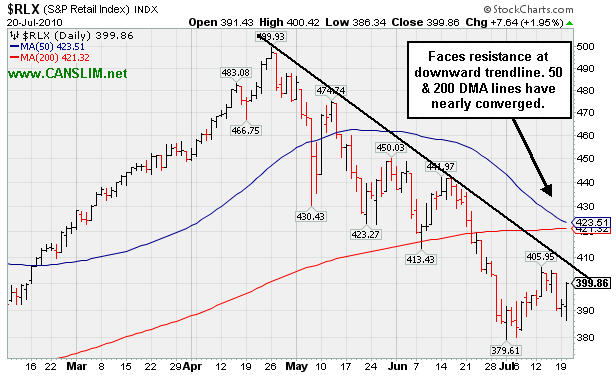
PICTURED: The Retail Index ($RLX +1.95%) faces resistance at a downward trendline. Its 50-day and 200-day moving average (DMA) lines have nearly converged.
| Oil Services |
$OSX |
181.65 |
+5.97 |
+3.40% |
-6.81% |
| Healthcare |
$HMO |
1,433.61 |
-1.21 |
-0.08% |
-2.67% |
| Integrated Oil |
$XOI |
953.87 |
+11.05 |
+1.17% |
-10.70% |
| Semiconductor |
$SOX |
358.13 |
+0.19 |
+0.05% |
-0.49% |
| Networking |
$NWX |
240.78 |
+1.39 |
+0.58% |
+4.21% |
| Internet |
$IIX |
240.15 |
+2.60 |
+1.10% |
+2.69% |
| Broker/Dealer |
$XBD |
102.46 |
+0.07 |
+0.06% |
-10.94% |
| Retail |
$RLX |
399.86 |
+7.64 |
+1.95% |
-2.74% |
| Gold & Silver |
$XAU |
169.08 |
+3.83 |
+2.32% |
+0.49% |
| Bank |
$BKX |
46.96 |
-0.08 |
-0.17% |
+9.95% |
| Biotech |
$BTK |
1,023.51 |
+3.07 |
+0.30% |
+8.64% |
|
|
|
 |
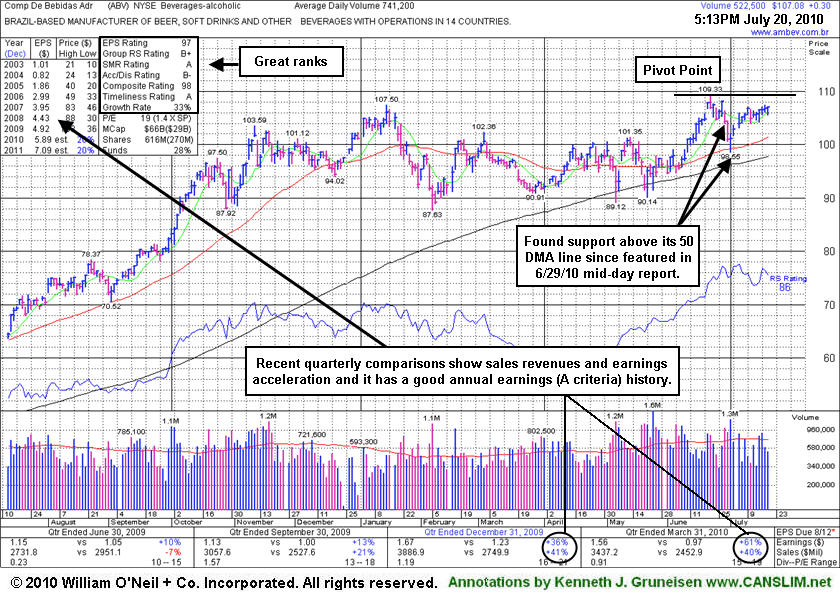
Consolidating After Support Found At 50-Day Moving Average
Kenneth J. Gruneisen - Passed the CAN SLIM® Master's Exam
Often, when a leading stock is setting up to breakout of a solid base it is highlighted in CANSLIM.net's Mid-Day Breakouts Report. The most relevant factors are noted in the report which allows prudent CANSLIM oriented investors to place the issue in their watch list. After doing any necessary backup research, the investor is prepared to act if and when the stock triggers a technical buy signal (breaks above its pivot point on more than +50% average turnover). In the event the stock fails to trigger a technical buy signal and its price declines then it will simply be removed from the watch list.
Comp De Bebidas Adr (ABV +$0.30 or +0.28% to $107.08) is a Brazil-based beverage firm trading in a tight range, quietly perched within close striking distance of its 52-week high. It found support near its 50 DMA line recently and has not yet traded above its pivot point cited when featured in the 6/29/10 mid-day report (read here). That evening an annotated graph showed its cup-with-handle type pattern being formed under the headline "High-Ranked Beverage Firm From Brazil Perched Near High" with notes while - "perched near all-time highs after building an orderly base pattern and finding impressive support near its 200 DMA line in recent months. It has a great annual earnings (A criteria) history and its recent quarterly earnings and sales revenues increases have shown acceleration. A gain above its pivot point with heavy volume still needed to confirm a proper new technical buy signal."
|
|
|
Color Codes Explained :
Y - Better candidates highlighted by our
staff of experts.
G - Previously featured
in past reports as yellow but may no longer be buyable under the
guidelines.
***Last / Change / Volume data in this table is the closing quote data***
Symbol/Exchange
Company Name
Industry Group |
PRICE |
CHANGE
(%Change) |
Day High |
Volume
(% DAV)
(% 50 day avg vol) |
52 Wk Hi
% From Hi |
Featured
Date |
Price
Featured |
Pivot Featured |
|
Max Buy |
AAPL
-
NASDAQ
Apple Inc
COMPUTER HARDWARE - Personal Computers
|
$251.89
|
+6.31
2.57% |
$252.86
|
37,969,230
128.82% of 50 DAV
50 DAV is 29,475,700
|
$279.01
-9.72%
|
6/17/2010
|
$270.95
|
PP = $272.56
|
|
MB = $286.19
|
 Most Recent Note - 7/20/2010 4:10:37 PM
G - Today's gain followed a streak of 3 losses with above average volume in a span of 5 sessions since slumping under its 50 DMA line again. It closed in the upper half of its intra-day range again today after it dipped below the $242-243 area on the prior session.
>>> The latest Featured Stock Update with an annotated graph appeared on 7/12/2010. Click here.
View all notes |
Alert me of new notes |
CANSLIM.net Company Profile |
SEC |
Zacks Reports |
StockTalk |
News |
Chart |
Request a new note
C
A N
S L
I M


|
ABV
-
NYSE
Comp De Bebidas Adr
FOOD and BEVERAGE - Beverages - Brewers
|
$107.08
|
+0.30
0.28% |
$107.17
|
522,936
69.36% of 50 DAV
50 DAV is 753,900
|
$109.33
-2.06%
|
6/29/2010
|
$104.74
|
PP = $109.33
|
|
MB = $114.80
|
Most Recent Note - 7/20/2010 4:12:42 PM
Y - This Brazil-based beverage firm is trading in a tight range, quietly perched within close striking distance of its 52-week high. It found support near its 50 DMA line recently and has not yet traded above its pivot point since featured in the 6/29/10 mid-day report (read here).
>>> The latest Featured Stock Update with an annotated graph appeared on 7/20/2010. Click here.
View all notes |
Alert me of new notes |
CANSLIM.net Company Profile |
SEC |
Zacks Reports |
StockTalk |
News |
Chart |
Request a new note
C
A N
S L
I M
|
BIDU
-
NASDAQ
Baidu Inc Ads
INTERNET - Internet Information Providers
|
$74.04
|
+1.14
1.56% |
$74.23
|
9,702,869
67.86% of 50 DAV
50 DAV is 14,297,700
|
$82.29
-10.03%
|
7/14/2010
|
$75.03
|
PP = $78.59
|
|
MB = $82.52
|
Most Recent Note - 7/20/2010 4:15:04 PM
Y - Gain today with light volume helped it close above its 50 DMA line near the session high. Disciplined investors avoid the temptation to get in "early" and watch for a proper technical buy signal.
>>> The latest Featured Stock Update with an annotated graph appeared on 7/14/2010. Click here.
View all notes |
Alert me of new notes |
CANSLIM.net Company Profile |
SEC |
Zacks Reports |
StockTalk |
News |
Chart |
Request a new note
C
A N
S L
I M
|
CRM
-
NYSE
Salesforce.Com Inc
INTERNET - Internet Software and Services
|
$93.12
|
+0.49
0.53% |
$93.28
|
1,626,669
55.01% of 50 DAV
50 DAV is 2,957,000
|
$97.94
-4.92%
|
6/2/2010
|
$88.44
|
PP = $89.60
|
|
MB = $94.08
|
Most Recent Note - 7/20/2010 4:18:52 PM
G - Gapped down today then positively reversed and closed near the session high for a small gain on light volume.
>>> The latest Featured Stock Update with an annotated graph appeared on 7/15/2010. Click here.
View all notes |
Alert me of new notes |
CANSLIM.net Company Profile |
SEC |
Zacks Reports |
StockTalk |
News |
Chart |
Request a new note
C
A N
S L
I M
|
FFIV
-
NASDAQ
F 5 Networks Inc
INTERNET - Internet Software and Services
|
$76.79
|
+0.54
0.71% |
$76.97
|
1,234,832
73.07% of 50 DAV
50 DAV is 1,690,000
|
$79.21
-3.06%
|
6/16/2010
|
$74.50
|
PP = $74.10
|
|
MB = $77.81
|
Most Recent Note - 7/20/2010 4:21:11 PM
Y - Gapped down today and then positively reversed and closed near the session high with a small gain on light volume. Prior highs in the $74-77 area may now serve as chart support levels above its 50 DMA line.
>>> The latest Featured Stock Update with an annotated graph appeared on 7/7/2010. Click here.
View all notes |
Alert me of new notes |
CANSLIM.net Company Profile |
SEC |
Zacks Reports |
StockTalk |
News |
Chart |
Request a new note
C
A N
S L
I M
|
Symbol/Exchange
Company Name
Industry Group |
PRICE |
CHANGE
(%Change) |
Day High |
Volume
(% DAV)
(% 50 day avg vol) |
52 Wk Hi
% From Hi |
Featured
Date |
Price
Featured |
Pivot Featured |
|
Max Buy |
MELI
-
NASDAQ
Mercadolibre Inc
INTERNET - Internet Software and; Services
|
$60.00
|
+0.10
0.17% |
$60.19
|
720,499
74.42% of 50 DAV
50 DAV is 968,200
|
$62.46
-3.94%
|
5/13/2010
|
$54.21
|
PP = $55.85
|
|
MB = $58.64
|
Most Recent Note - 7/20/2010 4:29:53 PM
G - Gains with lighter volume have followed a considerable 7/16/10 loss with above average volume. Recently it was noted as it wedged to new 52-week high territory with quiet volume behind its gains.
>>> The latest Featured Stock Update with an annotated graph appeared on 6/30/2010. Click here.
View all notes |
Alert me of new notes |
CANSLIM.net Company Profile |
SEC |
Zacks Reports |
StockTalk |
News |
Chart |
Request a new note
C
A N
S L
I M
|
NEM
-
NYSE
Newmont Mining Corp
METALS and MINING - Gold
|
$58.99
|
+0.97
1.67% |
$59.26
|
7,597,355
76.37% of 50 DAV
50 DAV is 9,948,500
|
$63.38
-6.93%
|
6/22/2010
|
$59.60
|
PP = $59.67
|
|
MB = $62.65
|
Most Recent Note - 7/20/2010 4:32:12 PM
G - Posted a small gain today with lighter volume, sputtering near its 50 DMA line and prior chart highs that define support to watch.
>>> The latest Featured Stock Update with an annotated graph appeared on 7/9/2010. Click here.
View all notes |
Alert me of new notes |
CANSLIM.net Company Profile |
SEC |
Zacks Reports |
StockTalk |
News |
Chart |
Request a new note
C
A N
S L
I M
|
ROVI
-
NASDAQ
Rovi Corp
COMPUTER SOFTWARE andamp; SERVICES - Security Software andamp; Services
|
$42.49
|
+0.14
0.33% |
$42.60
|
919,389
63.56% of 50 DAV
50 DAV is 1,446,600
|
$43.67
-2.70%
|
6/3/2010
|
$38.70
|
PP = $40.16
|
|
MB = $42.17
|
Most Recent Note - 7/19/2010 5:40:40 PM
Y - Holding its ground stubbornly, it closed the session -3% off its 52-week high. Support is defined by prior resistance in the $40 area above its 50 DMA line.
>>> The latest Featured Stock Update with an annotated graph appeared on 6/28/2010. Click here.
View all notes |
Alert me of new notes |
CANSLIM.net Company Profile |
SEC |
Zacks Reports |
StockTalk |
News |
Chart |
Request a new note
C
A N
S L
I M
|
THOR
-
NASDAQ
Thoratec Corp
HEALTH SERVICES - Medical Instruments and Supplies
|
$42.59
|
-0.19
-0.44% |
$42.64
|
396,545
39.37% of 50 DAV
50 DAV is 1,007,300
|
$47.93
-11.14%
|
6/3/2010
|
$44.38
|
PP = $45.35
|
|
MB = $47.62
|
Most Recent Note - 7/20/2010 4:51:11 PM
G - Tallied its 3rd consecutive loss on light volume yet it closed near the session high today. During the slump it violated its 50 DMA line while testing near a prior low ($41.27 on 7/01/10) that defines an important chart support level.
>>> The latest Featured Stock Update with an annotated graph appeared on 7/16/2010. Click here.
View all notes |
Alert me of new notes |
CANSLIM.net Company Profile |
SEC |
Zacks Reports |
StockTalk |
News |
Chart |
Request a new note
C
A N
S L
I M
|
ULTA
-
NASDAQ
Ulta Salon Cosm & Frag
SPECIALTY RETAIL - Specialty Retail, Other
|
$23.15
|
+0.25
1.09% |
$23.24
|
445,729
63.60% of 50 DAV
50 DAV is 700,800
|
$26.75
-13.46%
|
5/28/2010
|
$25.58
|
PP = $25.86
|
|
MB = $27.15
|
Most Recent Note - 7/20/2010 4:52:32 PM
G - Holding its ground in a tight trading range with light volume. Its 50 DMA line has acted as resistance recently, meanwhile its May - June chart lows in the $21 area define the next support level just above its 200 DMA line.
>>> The latest Featured Stock Update with an annotated graph appeared on 7/19/2010. Click here.
View all notes |
Alert me of new notes |
CANSLIM.net Company Profile |
SEC |
Zacks Reports |
StockTalk |
News |
Chart |
Request a new note
C
A N
S L
I M
|
Symbol/Exchange
Company Name
Industry Group |
PRICE |
CHANGE
(%Change) |
Day High |
Volume
(% DAV)
(% 50 day avg vol) |
52 Wk Hi
% From Hi |
Featured
Date |
Price
Featured |
Pivot Featured |
|
Max Buy |
VIT
-
NYSE
Vanceinfo Tech Inc Ads
COMPUTER SOFTWARE and SERVICES - Business Software and Services
|
$25.36
|
+0.64
2.59% |
$25.38
|
441,211
68.12% of 50 DAV
50 DAV is 647,700
|
$26.90
-5.72%
|
7/8/2010
|
$25.20
|
PP = $26.58
|
|
MB = $27.91
|
Most Recent Note - 7/20/2010 4:58:34 PM
Y - Gapped down and then closed near the session high with a small gain on light volume, making a "positive reversal" today. It did not yet trigger a technical buy signal with respect to the pivot point cited after gapping up on 7/08/10, when it briefly matched its all-time high and appeared in the mid-day report (read here).
>>> The latest Featured Stock Update with an annotated graph appeared on 7/8/2010. Click here.
View all notes |
Alert me of new notes |
CANSLIM.net Company Profile |
SEC |
Zacks Reports |
StockTalk |
News |
Chart |
Request a new note
C
A N
S L
I M
|
|
|
|
THESE ARE NOT BUY RECOMMENDATIONS!
Comments contained in the body of this report are technical
opinions only. The material herein has been obtained
from sources believed to be reliable and accurate, however,
its accuracy and completeness cannot be guaranteed.
This site is not an investment advisor, hence it does
not endorse or recommend any securities or other investments.
Any recommendation contained in this report may not
be suitable for all investors and it is not to be deemed
an offer or solicitation on our part with respect to
the purchase or sale of any securities. All trademarks,
service marks and trade names appearing in this report
are the property of their respective owners, and are
likewise used for identification purposes only.
This report is a service available
only to active Paid Premium Members.
You may opt-out of receiving report notifications
at any time. Questions or comments may be submitted
by writing to Premium Membership Services 665 S.E. 10 Street, Suite 201 Deerfield Beach, FL 33441-5634 or by calling 1-800-965-8307
or 954-785-1121.
|
|
|


