You are not logged in.
This means you
CAN ONLY VIEW reports that were published prior to Tuesday, April 15, 2025.
You
MUST UPGRADE YOUR MEMBERSHIP if you want to see any current reports.
AFTER MARKET UPDATE - MONDAY, JULY 19TH, 2010
Previous After Market Report Next After Market Report >>>
|
|
|
|
DOW |
+56.53 |
10,154.43 |
+0.56% |
|
Volume |
955,512,670 |
-36% |
|
Volume |
1,687,779,600 |
-21% |
|
NASDAQ |
+19.18 |
2,198.23 |
+0.88% |
|
Advancers |
1,963 |
63% |
|
Advancers |
1,552 |
56% |
|
S&P 500 |
+6.37 |
1,071.25 |
+0.60% |
|
Decliners |
1,041 |
33% |
|
Decliners |
1,083 |
39% |
|
Russell 2000 |
+2.69 |
613.08 |
+0.44% |
|
52 Wk Highs |
95 |
|
|
52 Wk Highs |
11 |
|
|
S&P 600 |
+1.79 |
330.85 |
+0.54% |
|
52 Wk Lows |
43 |
|
|
52 Wk Lows |
79 |
|
|
 |
Major Indices Rise With Lighter Volume Behind Gains
Adam Sarhan, Contributing Writer,
The major averages ended higher on Monday after getting smacked on Friday. As expected, volume was reported lower than Friday's session on both exchanges due to options expirations. There were only 7 high-ranked companies from the CANSLIM.net Leaders List that made a new 52-week high and appeared on the CANSLIM.net BreakOuts Page, up from 4 issues that appeared on the prior session. Advancers led decliners by almost a 2-to-1 ratio on the NYSE and by a 3-to-2 ratio on the Nasdaq exchange. New 52-week highs solidly outnumbered new 52-week lows on the NYSE but trailed on the Nasdaq exchange. For the rally to have ongoing success it will be critical for a healthy crop of leaders to continue showing up hitting new 52-week highs.
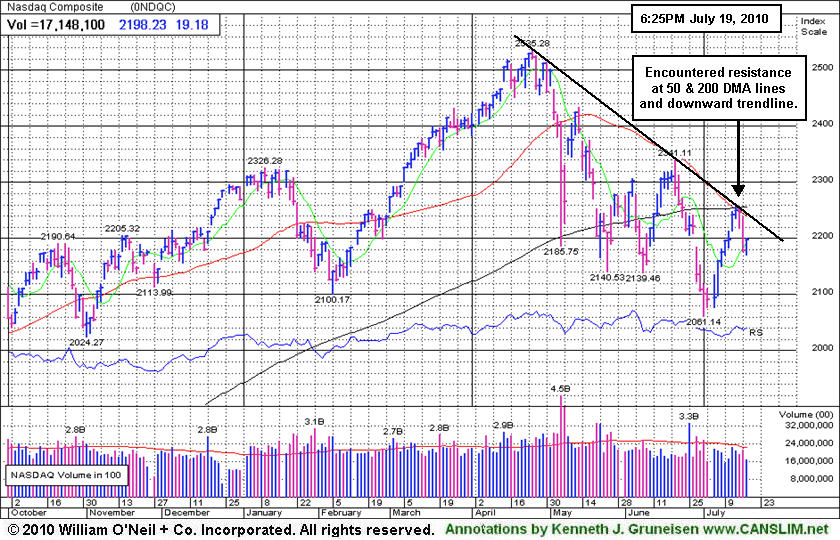
The National Association of Home Builders/Wells Fargo confidence index slid to 14 in July which is the the lowest reading since April 2009 and down from last month's reading of 16. Any reading below 50 means that respondents consider the current environment as poor. Later this week housing starts and existing home sales are slated to be released which will give the latest read on the ailing housing market. The major averages continue to face stubborn resistance near last week's highs and their respective multi month downward trendline and moving averages. Over the next few weeks, it will be very interesting to see how companies fared last quarter and, equally important, to see how the market reacts to the numbers. Analysts believe that Q2 earnings for S&P 500 companies rose +34%.
Looking forward, the window remains open for disciplined investors to carefully buy high-ranked stocks. Since the current rally began on July 1, the major averages have rallied on suspiciously light volume for the most part. It is ideal to see volume expand as the major averages break above resistance and see a new batch of high-ranked leaders trigger fresh technical buy signals. These latest improvements are helping to confirm this nascent rally and provide a reassurance that odds are more favorable for successful investing using the fact-based system.
PICTURED: The Nasdaq Composite Index recently encountered resistance at its 50-day and 200-day moving average lines and downward trendline.
|
|
|
 |
Semiconductor Index Led Tech Sector Gains
Kenneth J. Gruneisen - Passed the CAN SLIM® Master's Exam
The tech-heavy Nasdaq Composite Index outpaced its peers as strength in the tech sector was led by the Semiconductor Index ($SOX +2.51%), meanwhile the Internet Index ($IIX +1.12%), Networking Index ($NWX +0.77%), and Biotechnology Index ($BTK +0.47%) posted unanimous gains. The Retail Index ($RLX +0.42%) and Broker/Dealer Index ($XBD +0.78%) were also among the positive influences while the Bank Index ($BKX -0.04%) finished virtually unchanged. The Integrated Oil Index ($XOI -0.27%) edged lower while the Oil Services Index ($OSX +1.55%) and Healthcare Index ($HMO +0.90%) were also on the rise. Meanwhile, the Gold & Silver Index ($XAU -1.28%) was one of the day's laggard groups.
Charts courtesy www.stockcharts.com
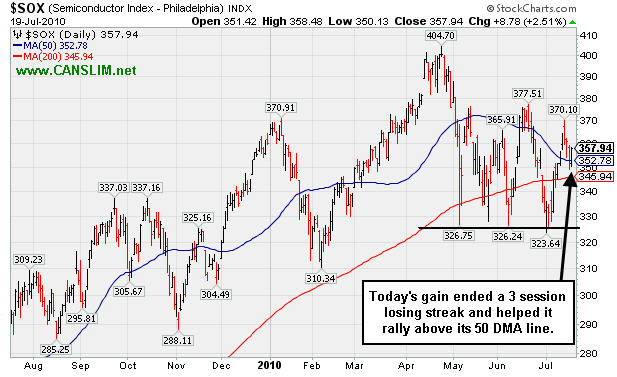
PICTURED: The Semiconductor Index ($SOX +2.51%) posted a solid gain that ended a 3 session losing streak and helped it rally above its 50-day moving average (DMA) line.
| Oil Services |
$OSX |
175.68 |
+2.68 |
+1.55% |
-9.87% |
| Healthcare |
$HMO |
1,434.83 |
+12.85 |
+0.90% |
-2.59% |
| Integrated Oil |
$XOI |
942.82 |
-2.55 |
-0.27% |
-11.74% |
| Semiconductor |
$SOX |
357.94 |
+8.78 |
+2.51% |
-0.55% |
| Networking |
$NWX |
239.39 |
+1.83 |
+0.77% |
+3.61% |
| Internet |
$IIX |
237.55 |
+2.64 |
+1.12% |
+1.58% |
| Broker/Dealer |
$XBD |
102.40 |
+0.80 |
+0.78% |
-11.00% |
| Retail |
$RLX |
392.22 |
+1.64 |
+0.42% |
-4.60% |
| Gold & Silver |
$XAU |
165.25 |
-2.14 |
-1.28% |
-1.78% |
| Bank |
$BKX |
47.04 |
-0.02 |
-0.04% |
+10.14% |
| Biotech |
$BTK |
1,020.44 |
+4.80 |
+0.47% |
+8.31% |
|
|
|
 |
50 DMA Line Recently Acted As Resistance
Kenneth J. Gruneisen - Passed the CAN SLIM® Master's Exam
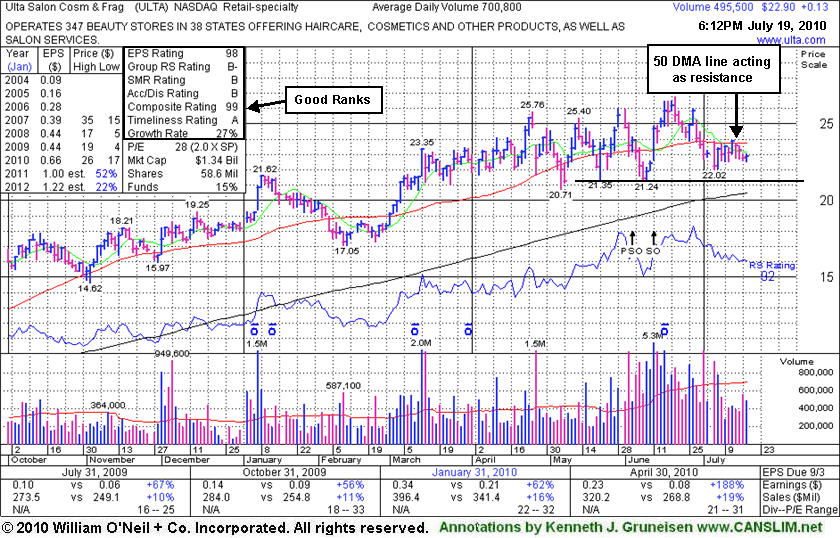
Ulta Salon Cosmetics & Fragrance, Inc. (ULTA +$0.13 or +0.57% to $22.90) held its ground today after 3 consecutive losses on light volume. Its 50-day moving average (DMA) line has acted as resistance after recent distributional pressure sent it below that important short-term average. While it has been consolidating since a negative reversal from an all-time high on 6/21/10, its May - June chart lows in the $21 area define the next support level just above its 200 DMA line.
On 6/11/10 it completed a Secondary Offering which we previously noted may hinder upward price progress for the near-term. For now it remains an ideal candidate for investors' watch lists, awaiting a rebound above its 50 DMA line and confirming gains for a new high close with heavy volume for a fresh technical buy signal.
This high-ranked leader in the Retail - Misc group which has shown accelerating sales revenues increases with strong quarterly earnings increases above the +25% guideline in the 4 latest comparisons (satisfies the C criteria). The number of top-rated funds with an ownership interest has grown from 49 funds in March '09 to 81 funds as of Jun '10 which is an encouraging sign of increasing institutional interest (the I criteria). Management's 36% ownership stake (after the latest offering) still keeps the company's directors very motivated to look after and build shareholder value.
|
|
|
Color Codes Explained :
Y - Better candidates highlighted by our
staff of experts.
G - Previously featured
in past reports as yellow but may no longer be buyable under the
guidelines.
***Last / Change / Volume data in this table is the closing quote data***
Symbol/Exchange
Company Name
Industry Group |
PRICE |
CHANGE
(%Change) |
Day High |
Volume
(% DAV)
(% 50 day avg vol) |
52 Wk Hi
% From Hi |
Featured
Date |
Price
Featured |
Pivot Featured |
|
Max Buy |
AAPL
-
NASDAQ
Apple Inc
COMPUTER HARDWARE - Personal Computers
|
$245.58
|
-4.32
-1.73% |
$249.88
|
36,558,614
124.03% of 50 DAV
50 DAV is 29,475,700
|
$279.01
-11.98%
|
6/17/2010
|
$270.95
|
PP = $272.56
|
|
MB = $286.19
|
 Most Recent Note - 7/19/2010 5:21:00 PM
G - Today marked its 3rd loss with above average volume in a span of 5 sessions since slumping under its 50 DMA line again. It closed in the upper half of its intra-day range after trading below the $242-243 area defining important chart support.
>>> The latest Featured Stock Update with an annotated graph appeared on 7/12/2010. Click here.
View all notes |
Alert me of new notes |
CANSLIM.net Company Profile |
SEC |
Zacks Reports |
StockTalk |
News |
Chart |
Request a new note
C
A N
S L
I M


|
ABV
-
NYSE
Comp De Bebidas Adr
FOOD and BEVERAGE - Beverages - Brewers
|
$106.78
|
+0.22
0.21% |
$107.37
|
588,414
78.05% of 50 DAV
50 DAV is 753,900
|
$109.33
-2.33%
|
6/29/2010
|
$104.74
|
PP = $109.33
|
|
MB = $114.80
|
Most Recent Note - 7/16/2010 12:41:35 PM
Y - This Brazil-based beverage firm is quietly perched within close striking distance of its 52-week high. It found support near its 50 DMA line recently and has not yet traded above its pivot point since featured in the 6/29/10 mid-day report (read here).
>>> The latest Featured Stock Update with an annotated graph appeared on 6/29/2010. Click here.
View all notes |
Alert me of new notes |
CANSLIM.net Company Profile |
SEC |
Zacks Reports |
StockTalk |
News |
Chart |
Request a new note
C
A N
S L
I M
|
BIDU
-
NASDAQ
Baidu Inc Ads
INTERNET - Internet Information Providers
|
$72.90
|
-0.63
-0.86% |
$73.39
|
15,393,704
107.67% of 50 DAV
50 DAV is 14,297,700
|
$82.29
-11.41%
|
7/14/2010
|
$75.03
|
PP = $78.59
|
|
MB = $82.52
|
Most Recent Note - 7/19/2010 5:26:58 PM
Y - Gapped down today and then rallied to close above its 50 DMA line near the session high. Disciplined investors avoid the temptation to get in "early" and watch for a proper technical buy signal. Color code was changed to yellow with new pivot point cited based on 6/21/10 high after a proper double-bottom pattern of sufficient length.
>>> The latest Featured Stock Update with an annotated graph appeared on 7/14/2010. Click here.
View all notes |
Alert me of new notes |
CANSLIM.net Company Profile |
SEC |
Zacks Reports |
StockTalk |
News |
Chart |
Request a new note
C
A N
S L
I M
|
CRM
-
NYSE
Salesforce.Com Inc
INTERNET - Internet Software and Services
|
$92.63
|
+0.58
0.63% |
$93.55
|
1,999,313
67.61% of 50 DAV
50 DAV is 2,957,000
|
$97.94
-5.42%
|
6/2/2010
|
$88.44
|
PP = $89.60
|
|
MB = $94.08
|
Most Recent Note - 7/19/2010 5:31:22 PM
G - Holding its ground and working on building a new base with volume totals cooling in recent weeks.
>>> The latest Featured Stock Update with an annotated graph appeared on 7/15/2010. Click here.
View all notes |
Alert me of new notes |
CANSLIM.net Company Profile |
SEC |
Zacks Reports |
StockTalk |
News |
Chart |
Request a new note
C
A N
S L
I M
|
FFIV
-
NASDAQ
F 5 Networks Inc
INTERNET - Internet Software and Services
|
$76.25
|
-0.12
-0.16% |
$77.01
|
1,825,300
108.01% of 50 DAV
50 DAV is 1,690,000
|
$79.21
-3.74%
|
6/16/2010
|
$74.50
|
PP = $74.10
|
|
MB = $77.81
|
Most Recent Note - 7/19/2010 5:32:28 PM
Y - Consolidating below its "max buy" level now, its color code was changed to yellow. Prior highs in the $74-77 area may now serve as chart support levels above its 50 DMA line.
>>> The latest Featured Stock Update with an annotated graph appeared on 7/7/2010. Click here.
View all notes |
Alert me of new notes |
CANSLIM.net Company Profile |
SEC |
Zacks Reports |
StockTalk |
News |
Chart |
Request a new note
C
A N
S L
I M
|
Symbol/Exchange
Company Name
Industry Group |
PRICE |
CHANGE
(%Change) |
Day High |
Volume
(% DAV)
(% 50 day avg vol) |
52 Wk Hi
% From Hi |
Featured
Date |
Price
Featured |
Pivot Featured |
|
Max Buy |
MELI
-
NASDAQ
Mercadolibre Inc
INTERNET - Internet Software and; Services
|
$59.90
|
+1.80
3.10% |
$60.02
|
843,328
87.10% of 50 DAV
50 DAV is 968,200
|
$62.46
-4.10%
|
5/13/2010
|
$54.21
|
PP = $55.85
|
|
MB = $58.64
|
Most Recent Note - 7/19/2010 5:34:36 PM
G - Gain today with lighter volume followed a considerable 7/16/10 loss with above average volume. Recently it was noted as it wedged to new 52-week high territory with quiet volume behind its gains.
>>> The latest Featured Stock Update with an annotated graph appeared on 6/30/2010. Click here.
View all notes |
Alert me of new notes |
CANSLIM.net Company Profile |
SEC |
Zacks Reports |
StockTalk |
News |
Chart |
Request a new note
C
A N
S L
I M
|
NEM
-
NYSE
Newmont Mining Corp
METALS and MINING - Gold
|
$58.02
|
-0.88
-1.49% |
$58.60
|
10,850,514
109.07% of 50 DAV
50 DAV is 9,948,500
|
$63.38
-8.46%
|
6/22/2010
|
$59.60
|
PP = $59.67
|
|
MB = $62.65
|
Most Recent Note - 7/19/2010 5:38:07 PM
G - Color code is changed to green based on distributional action and technical weakness. It rebounded today from session lows below its 50 DMA and prior chart highs that define support to watch.
>>> The latest Featured Stock Update with an annotated graph appeared on 7/9/2010. Click here.
View all notes |
Alert me of new notes |
CANSLIM.net Company Profile |
SEC |
Zacks Reports |
StockTalk |
News |
Chart |
Request a new note
C
A N
S L
I M
|
ROVI
-
NASDAQ
Rovi Corp
COMPUTER SOFTWARE andamp; SERVICES - Security Software andamp; Services
|
$42.35
|
+0.33
0.79% |
$42.72
|
600,241
41.49% of 50 DAV
50 DAV is 1,446,600
|
$43.67
-3.02%
|
6/3/2010
|
$38.70
|
PP = $40.16
|
|
MB = $42.17
|
Most Recent Note - 7/19/2010 5:40:40 PM
Y - Holding its ground stubbornly, it closed the session -3% off its 52-week high. Support is defined by prior resistance in the $40 area above its 50 DMA line.
>>> The latest Featured Stock Update with an annotated graph appeared on 6/28/2010. Click here.
View all notes |
Alert me of new notes |
CANSLIM.net Company Profile |
SEC |
Zacks Reports |
StockTalk |
News |
Chart |
Request a new note
C
A N
S L
I M
|
THOR
-
NASDAQ
Thoratec Corp
HEALTH SERVICES - Medical Instruments and Supplies
|
$42.78
|
-0.25
-0.58% |
$43.15
|
297,510
29.54% of 50 DAV
50 DAV is 1,007,300
|
$47.93
-10.74%
|
6/3/2010
|
$44.38
|
PP = $45.35
|
|
MB = $47.62
|
Most Recent Note - 7/19/2010 5:43:46 PM
G - Color code is changed to green today as a loss on light volume followed the 50 DMA line violation noted on 7/16/10. Recent low ($41.27 on 7/01/10) defines the next important chart support level.
>>> The latest Featured Stock Update with an annotated graph appeared on 7/16/2010. Click here.
View all notes |
Alert me of new notes |
CANSLIM.net Company Profile |
SEC |
Zacks Reports |
StockTalk |
News |
Chart |
Request a new note
C
A N
S L
I M
|
ULTA
-
NASDAQ
Ulta Salon Cosm & Frag
SPECIALTY RETAIL - Specialty Retail, Other
|
$22.90
|
+0.13
0.57% |
$23.00
|
495,557
70.71% of 50 DAV
50 DAV is 700,800
|
$26.75
-14.39%
|
5/28/2010
|
$25.58
|
PP = $25.86
|
|
MB = $27.15
|
Most Recent Note - 7/19/2010 6:08:27 PM
G - Held its ground today after 3 consecutive losses on light volume. Its 50 DMA line has acted as resistance recently. Its May - June chart lows in the $21 area define the next support level just above its 200 DMA line.
>>> The latest Featured Stock Update with an annotated graph appeared on 7/19/2010. Click here.
View all notes |
Alert me of new notes |
CANSLIM.net Company Profile |
SEC |
Zacks Reports |
StockTalk |
News |
Chart |
Request a new note
C
A N
S L
I M
|
Symbol/Exchange
Company Name
Industry Group |
PRICE |
CHANGE
(%Change) |
Day High |
Volume
(% DAV)
(% 50 day avg vol) |
52 Wk Hi
% From Hi |
Featured
Date |
Price
Featured |
Pivot Featured |
|
Max Buy |
VIT
-
NYSE
Vanceinfo Tech Inc Ads
COMPUTER SOFTWARE and SERVICES - Business Software and Services
|
$24.72
|
-0.28
-1.12% |
$25.00
|
583,810
90.14% of 50 DAV
50 DAV is 647,700
|
$26.90
-8.10%
|
7/8/2010
|
$25.20
|
PP = $26.58
|
|
MB = $27.91
|
Most Recent Note - 7/16/2010 4:05:56 PM
Y - Held its ground today after a positive reversal on the prior session. It has formed a handle on the right side of its 11-week cup shaped pattern now. It did not trigger a buy signal with respect to the pivot point cited after gapping up on 7/08/10, when it briefly matched its all-time high and appeared in the mid-day report (read here).
>>> The latest Featured Stock Update with an annotated graph appeared on 7/8/2010. Click here.
View all notes |
Alert me of new notes |
CANSLIM.net Company Profile |
SEC |
Zacks Reports |
StockTalk |
News |
Chart |
Request a new note
C
A N
S L
I M
|
|
|
|
THESE ARE NOT BUY RECOMMENDATIONS!
Comments contained in the body of this report are technical
opinions only. The material herein has been obtained
from sources believed to be reliable and accurate, however,
its accuracy and completeness cannot be guaranteed.
This site is not an investment advisor, hence it does
not endorse or recommend any securities or other investments.
Any recommendation contained in this report may not
be suitable for all investors and it is not to be deemed
an offer or solicitation on our part with respect to
the purchase or sale of any securities. All trademarks,
service marks and trade names appearing in this report
are the property of their respective owners, and are
likewise used for identification purposes only.
This report is a service available
only to active Paid Premium Members.
You may opt-out of receiving report notifications
at any time. Questions or comments may be submitted
by writing to Premium Membership Services 665 S.E. 10 Street, Suite 201 Deerfield Beach, FL 33441-5634 or by calling 1-800-965-8307
or 954-785-1121.
|
|
|


