You are not logged in.
This means you
CAN ONLY VIEW reports that were published prior to Monday, April 14, 2025.
You
MUST UPGRADE YOUR MEMBERSHIP if you want to see any current reports.
AFTER MARKET UPDATE - MONDAY, JULY 20TH, 2009
Previous After Market Report Next After Market Report >>>
|
|
|
|
DOW |
+104.21 |
8,848.15 |
+1.19% |
|
Volume |
1,126,780,260 |
-13% |
|
Volume |
2,081,865,550 |
+8% |
|
NASDAQ |
+22.68 |
1,909.29 |
+1.20% |
|
Advancers |
2,316 |
74% |
|
Advancers |
1,847 |
65% |
|
S&P 500 |
+10.75 |
951.13 |
+1.14% |
|
Decliners |
703 |
23% |
|
Decliners |
869 |
31% |
|
Russell 2000 |
+7.74 |
526.96 |
+1.49% |
|
52 Wk Highs |
67 |
|
|
52 Wk Highs |
80 |
|
|
S&P 600 |
+2.65 |
280.45 |
+0.95% |
|
52 Wk Lows |
2 |
|
|
52 Wk Lows |
10 |
|
|
 |
Dow Back In Positive Territory For 2009 As Major Averages Rise
Kenneth J. Gruneisen - Passed the CAN SLIM® Master's Exam
The Dow Jones Industrial Average posted a 6th straight gain while the Nasdaq Composite made its 9th straight advance, the tech-heavy index closing the session up +21% year-to-date. The reported volume total on the NYSE was slightly lower while the volume on the Nasdaq exchange actually rose above the prior session total. Advancers led declines by a 3-to-1 ratio on the NYSE and by more than a 2-to-1 ratio on the Nasdaq. There were 40 high-ranked companies from the CANSLIM.net Leaders List that made a new 52-week high and appeared on the CANSLIM.net BreakOuts Page, up solidly from the 30 issues that appeared on the prior session. New 52-week highs greatly outnumbered new lows.
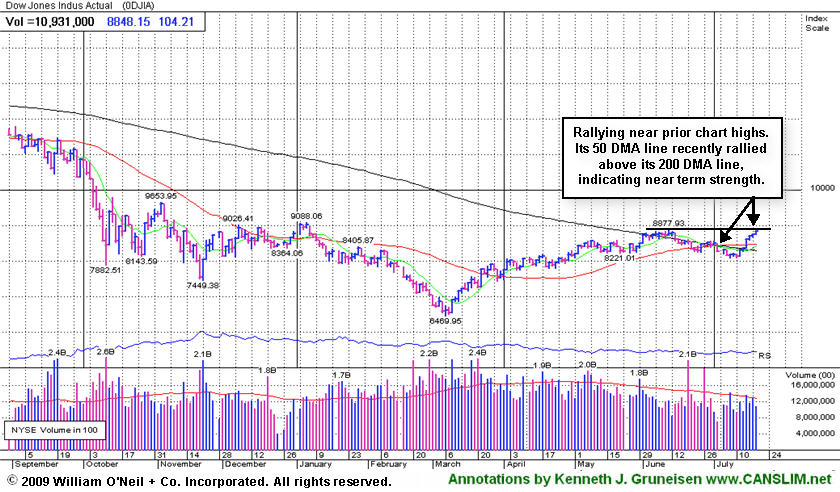
Stocks carried over their upward momentum after the prior week's big gains, rising across the board on Monday. A majority of the overseas markets posted strong gains, and Goldman Sachs (GS +2.03%) raised the firm's 2009 target for the S&P 500 Index to 1,060. Incidentally, the S&P 500 closed at its best level of the year.
Weakness in the U.S. dollar helped commodity linked groups. A slew of companies are set to report earnings news, and volume and volatility can be expected as surprises create certain hotbeds of activity. The noticeable increase in the number of stocks hitting new highs continued to show signs of meaningful technical improvement in the market's (the M criteria) health.
PICTURED: The blue chip Dow Jones Industrial Average rose on light volume and got back into positive territory for the year (+0.82%), approaching its June chart high. Volume totals have been light or average behind its streak of 6 consecutive gains. It would be encouraging to see heavier volume behind gains, as heavy volume would be indicative of institutional buying taking place as mutual fund and other large portfolio managers actively "accumulate" shares and bid up stocks.
|
 Kenneth J. Gruneisen started out as a licensed stockbroker in August 1987, a couple of months prior to the historic stock market crash that took the Dow Jones Industrial Average down -22.6% in a single day. He has published daily fact-based fundamental and technical analysis on high-ranked stocks online for two decades. Through FACTBASEDINVESTING.COM, Kenneth provides educational articles, news, market commentary, and other information regarding proven investment systems that work in good times and bad.
Comments contained in the body of this report are technical opinions only and are not necessarily those of Gruneisen Growth Corp. The material herein has been obtained from sources believed to be reliable and accurate, however, its accuracy and completeness cannot be guaranteed. Our firm, employees, and customers may effect transactions, including transactions contrary to any recommendation herein, or have positions in the securities mentioned herein or options with respect thereto. Any recommendation contained in this report may not be suitable for all investors and it is not to be deemed an offer or solicitation on our part with respect to the purchase or sale of any securities. |
|
 |
Biotech Group Blasted Higher
Kenneth J. Gruneisen - Passed the CAN SLIM® Master's Exam
Commodity-linked areas were standout gainers on Monday as the Gold & Silver Index ($XAU +3.43%) led the Integrated Oil Index ($XOI +2.04%) and Oil Services Index ($OSX +1.84%) with a solid gain. The Retail Index ($RLX +2.00%) and the Broker/Dealer Index ($XBD +1.80%) were positive influences on the major indices, but the Bank Index ($BKX -0.05%) ended flat. The tech sector had a positive bias as the Networking Index ($NWX +1.02%), Semiconductor Index ($SOX +1.25%), and Internet Index ($IIX +1.96%) posted unanimous gains. The Healthcare Index ($HMO -0.48%) group ended with a small loss, contrasting greatly with the standout gainer below.
Charts courtesy www.stockcharts.com
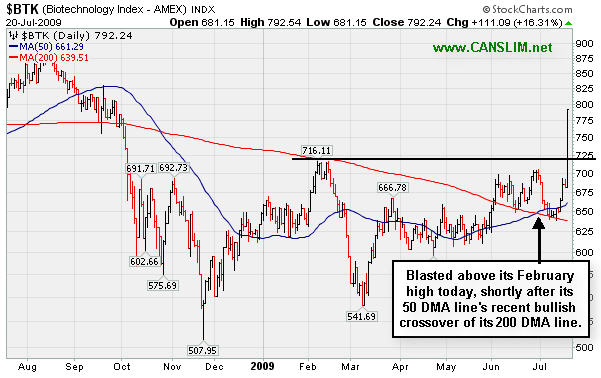
PICTURED: The Biotechnology Index ($BTK +16.31%) bolted higher, helped substantially by Human Genome Sciences, Inc. (HGSI +276.81%) surprised analysts by reporting that its lupus drug met a study goal. Another standout in the 20-stock index was Affymetrix, Inc. (AFFX +17.33%).
| Oil Services |
$OSX |
167.66 |
+3.03 |
+1.84% |
+38.12% |
| Healthcare |
$HMO |
1,075.68 |
-5.19 |
-0.48% |
+12.03% |
| Integrated Oil |
$XOI |
937.39 |
+18.71 |
+2.04% |
-4.32% |
| Semiconductor |
$SOX |
294.13 |
+3.64 |
+1.25% |
+38.63% |
| Networking |
$NWX |
192.37 |
+1.94 |
+1.02% |
+33.69% |
| Internet |
$IIX |
197.98 |
+3.81 |
+1.96% |
+48.00% |
| Broker/Dealer |
$XBD |
100.30 |
+1.77 |
+1.80% |
+29.47% |
| Retail |
$RLX |
342.24 |
+6.70 |
+2.00% |
+22.55% |
| Gold & Silver |
$XAU |
149.31 |
+4.95 |
+3.43% |
+20.56% |
| Bank |
$BKX |
37.06 |
-0.02 |
-0.05% |
-16.38% |
| Biotech |
$BTK |
792.24 |
+111.09 |
+16.31% |
+22.42% |
|
|
|
 |
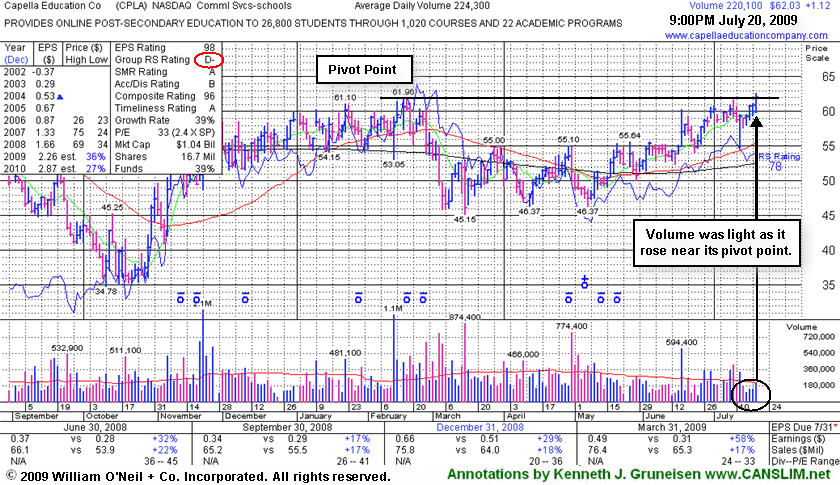
Volume Is Needed To Confirm Institutional Demand
Kenneth J. Gruneisen - Passed the CAN SLIM® Master's Exam
Capella Education Co. (CPLA +$1.12 or +1.81% to $62.03) hit a new 52-week high today with a 4th consecutive gain on only average volume, closing just shy of its pivot point. It has not yet triggered a technical buy signal since first featured in yellow in the 7/09/09 Mid-Day BreakOuts Report (read here). The group has shown some leadership, yet currently has a D- for a Relative Strength Rating. CPLA is a high-ranked leader in the Commercial Services-Schools Group. Its small supply of only 13.9 million shares in the float could contribute to greater price volatility in the event of institutional accumulation or distribution. The number of top-rated funds owning an interest rose from 91 in Sept '08, to 129 as of March '09, which is reassuring with respect to the I criteria. It has a very good earnings history that satisfies the C & A criteria, while recent quarters showed steady sales revenues increases in the +17-18% range.
Volume should be at least +50% above average behind a breakout under the investment system's guidelines. Heavy volume behind gains is a critical sign of heavy buying demand from the large institutional investors - demand which can fuel a sustained rally.
|
|
|
Color Codes Explained :
Y - Better candidates highlighted by our
staff of experts.
G - Previously featured
in past reports as yellow but may no longer be buyable under the
guidelines.
***Last / Change / Volume quote data in this table corresponds with the timestamp on the note***
Symbol/Exchange
Company Name
Industry Group |
Last |
Chg. |
Vol
% DAV |
Date Featured |
Price Featured |
Latest Pivot Point
Featured |
Status |
| Latest Max Buy Price |
CPLA
- NASDAQ
Capella Education Co
DIVERSIFIED SERVICES - Education and Training Services
|
$62.03
|
+1.12
|
223,501
105% DAV
213,062
|
7/9/2009
(Date
Featured) |
$59.69
(Price
Featured) |
PP = $62.06 |
Y |
| MB = $65.16 |
Most Recent Note - 7/20/2009 8:22:02 PM
Y - Hit a new 52-week high today with a 4th consecutive gain on only average volume, closing just shy of its pivot point. Featured in yellow in the 7/09/09 Mid-Day BreakOuts Report (read here). Color code is changed to yellow based on its resilience. The group has shown some leadership, yet currently has a D- for a Relative Strength Rating. CPLA is a high-ranked leader in the Commercial Services-Schools Group. Its small supply of only 13.9 million shares in the float could contribute to greater price volatility in the event of institutional accumulation or distribution. The number of top-rated funds owning an interest rose from 91 in Sept '08, to 129 as of March '09, which is reassuring with respect to the I criteria. It has a very good earnings history that satisfies the C & A criteria, while recent quarters showed steady sales revenues increases in the +17-18% range.
>>> The latest Featured Stock Update with an annotated graph appeared on 7/20/2009. click here.
|
|
C
A
S
I |
News |
Chart |
SEC
View all notes Alert
me of new notes
Company
Profile
|
GMCR
- NASDAQ
Green Mtn Coffee Roastrs
FOOD & BEVERAGE - Processed & Packaged Goods
|
$67.01
|
+6.86
|
3,749,672
291% DAV
1,287,401
|
7/17/2009
(Date
Featured) |
$60.15
(Price
Featured) |
PP = $63.79 |
Y |
| MB = $66.98 |
Most Recent Note - 7/20/2009 8:25:40 PM
Y - Gapped up today and rallied above its pivot point to a new all-time high with three times average volume, triggering a technical buy signal. Its recent chart highs may now be viewed as initial support to watch above its 50 DMA line. On 6/09/09 a 3:2 stock split took effect. GMCR traded up more than +158% since appearing with an annotated graph under the headline "It May Soon Be Time To Go Green" when featured in the January 2009 CANSLIM.net News (read here).
>>> The latest Featured Stock Update with an annotated graph appeared on 7/16/2009. click here.
|
|
C
A
S
I |
News |
Chart |
SEC
View all notes Alert
me of new notes
Company
Profile
|
HMSY
- NASDAQ
H M S Holdings Corp
COMPUTER SOFTWARE & SERVICES - Healthcare Information Service
|
$41.62
|
-0.64
|
252,368
N/A
|
2/20/2009
(Date
Featured) |
$34.08
(Price
Featured) |
PP = $38.38 |
G |
| MB = $40.30 |
Most Recent Note - 7/20/2009 8:27:08 PM
G - Loss on light volume today, but still extended from its last sound base. No overhead supply is left to hinder the progress for this Commercial Services - Healthcare firm. Recently tested prior highs in the $38 area which are a very important initial support level above its 50 DMA line. A gap up gain on 6/16/09 with heavy volume triggered a technical buy signal.
>>> The latest Featured Stock Update with an annotated graph appeared on 7/13/2009. click here.
|
|
C
A
S
I |
News |
Chart |
SEC
View all notes Alert
me of new notes
Company
Profile
|
NTES
- NASDAQ
Netease Inc Adr
INTERNET - Internet Information Providers
|
$40.98
|
+1.81
|
2,354,797
N/A
|
7/17/2009
(Date
Featured) |
$39.29
(Price
Featured) |
PP = $38.74 |
Y |
| MB = $40.68 |
Most Recent Note - 7/20/2009 8:31:22 PM
Y - Today it gapped up for a 5th consecutive session and 8th consecutive gain with volume near average on the session. On 7/17/09 it broke out from a 5-week flat base with +44% above average volume behind its gain. Remember that volume should be at least +50% above average to confirm a sound breakout. Color code was changed to yellow and a new pivot point was noted. It found support and promptly repaired its 7/08/09 violation of its 50 DMA line which had triggered a technical sell signal. First featured at $26.75 in the 3/31/09 CANSLIM.net Mid-Day Breakouts Report (read here). This high-ranked Chinese Internet - Content firm was also summarized in greater detail including an annotated graph in the April 2009 issue of CANSLIM.net News (read here).
>>> The latest Featured Stock Update with an annotated graph appeared on 7/14/2009. click here.
|
|
C
A
S
I |
News |
Chart |
SEC
View all notes Alert
me of new notes
Company
Profile
|
NVEC
- NASDAQ
N V E Corp
ELECTRONICS - Semiconductor - Specialized
|
$48.04
|
+1.60
|
78,227
N/A
|
3/13/2009
(Date
Featured) |
$33.85
(Price
Featured) |
PP = $45.50 |
Y |
| MB = $47.78 |
Most Recent Note - 7/20/2009 8:32:43 PM
Y - Perched near its 52-week high after another light volume gain today. Its 50 DMA line is important support to watch, where a violation would raise concerns and trigger a technical sell signal. Color code was changed to yellow based its resilience near its 50 DMA after its 6/19/09 breakout from an "ascending base" type pattern was negated. Sales increases in recent comparisons have been under the +25% guideline and still rather minuscule, leaving concerns, especially in the event of any hiccups. This is a reason to be especially disciplined about proper entries and exits.
>>> The latest Featured Stock Update with an annotated graph appeared on 7/17/2009. click here.
|
|
C
A
S
I |
News |
Chart |
SEC
View all notes Alert
me of new notes
Company
Profile
|
SNDA
-
|
$60.19
|
+4.24
|
1,971,306
N/A
|
5/31/2009
(Date
Featured) |
$57.62
(Price
Featured) |
PP = $53.95 |
G |
| MB = $56.65 |
Most Recent Note - 7/20/2009 8:38:20 PM
G - Big gain today with above average volume helped it rally well above its 50 DMA line, helping its out look improve. Detailed analysis was included when recently featured in the June 2009 issue of CANSLIM.net News. Be sure to review the "What to Look Out For" section and entire detailed summary - read here).
>>> The latest Featured Stock Update with an annotated graph appeared on 7/15/2009. click here.
|
|
C
A
S
I |
News |
Chart |
SEC
View all notes Alert
me of new notes
Company
Profile
|
SYNA
- NASDAQ
Synaptics Inc
COMPUTER SOFTWARE & SERVICES - Information Technology Service
|
$34.93
|
+1.09
|
2,365,123
N/A
|
5/18/2009
(Date
Featured) |
$32.58
(Price
Featured) |
PP = $34.52 |
G |
| MB = $36.25 |
Most Recent Note - 7/20/2009 8:41:15 PM
G - Gapped up today, rallying toward its 50 DMA line. Its outlook would improve it rises back above its 50 DMA line. First featured in yellow in the May 18, 2009 mid-day report (read here). The number of top-rated funds owning its shares rose from 123 in June '08 to 201 in March '09, which is good news concerning the I criteria. Its annual earnings (the A criteria) history showed a dowturn in 2006, leaving concerns, but it followed that up with strong growth the next 2 years. Its small supply of shares (the S criteria) outstanding could contribute to especially great volatility in the event of institutional accumulation or distribution.
>>> The latest Featured Stock Update with an annotated graph appeared on 7/10/2009. click here.
|
|
C
A
S
I |
News |
Chart |
SEC
View all notes Alert
me of new notes
Company
Profile
|
TNDM
- NASDAQ
Tandem Diabetes Care Inc
TELECOMMUNICATIONS - Wireless Communications
|
$29.80
|
+0.82
|
404,813
N/A
|
3/2/2009
(Date
Featured) |
$18.89
(Price
Featured) |
PP = $29.85 |
G |
| MB = $31.34 |
Most Recent Note - 7/20/2009 8:42:35 PM
G - Gain today on light volume helped it rise further above its 50 DMA line. Subsequent deterioration below that short-term average and recent lows would raise concerns and trigger sell signals. Its choppy chart offers no sound base per the investment system's guidelines. It traded up as much as +72.42% since first featured at $18.89 in the 3/02/09 Mid-Day BreakOuts Report (read here).
>>> The latest Featured Stock Update with an annotated graph appeared on 7/7/2009. click here.
|
|
C
A
S
I |
News |
Chart |
SEC
View all notes Alert
me of new notes
Company
Profile
|
|
|
|
THESE ARE NOT BUY RECOMMENDATIONS!
Comments contained in the body of this report are technical
opinions only. The material herein has been obtained
from sources believed to be reliable and accurate, however,
its accuracy and completeness cannot be guaranteed.
This site is not an investment advisor, hence it does
not endorse or recommend any securities or other investments.
Any recommendation contained in this report may not
be suitable for all investors and it is not to be deemed
an offer or solicitation on our part with respect to
the purchase or sale of any securities. All trademarks,
service marks and trade names appearing in this report
are the property of their respective owners, and are
likewise used for identification purposes only.
This report is a service available
only to active Paid Premium Members.
You may opt-out of receiving report notifications
at any time. Questions or comments may be submitted
by writing to Premium Membership Services 665 S.E. 10 Street, Suite 201 Deerfield Beach, FL 33441-5634 or by calling 1-800-965-8307
or 954-785-1121.
|
|
|

