You are not logged in.
This means you
CAN ONLY VIEW reports that were published prior to Monday, March 10, 2025.
You
MUST UPGRADE YOUR MEMBERSHIP if you want to see any current reports.
AFTER MARKET UPDATE - THURSDAY, JULY 19TH, 2012
Previous After Market Report Next After Market Report >>>
|
|
|
|
DOW |
+34.66 |
12,943.36 |
+0.27% |
|
Volume |
756,585,070 |
+4% |
|
Volume |
1,657,605,120 |
-5% |
|
NASDAQ |
+23.30 |
2,965.90 |
+0.79% |
|
Advancers |
1,563 |
50% |
|
Advancers |
1,093 |
42% |
|
S&P 500 |
+3.73 |
1,376.51 |
+0.27% |
|
Decliners |
1,463 |
46% |
|
Decliners |
1,393 |
54% |
|
Russell 2000 |
-2.89 |
802.17 |
-0.36% |
|
52 Wk Highs |
186 |
|
|
52 Wk Highs |
84 |
|
|
S&P 600 |
-0.77 |
449.08 |
-0.17% |
|
52 Wk Lows |
23 |
|
|
52 Wk Lows |
36 |
|
|
 |
Major Averages Posted Gains With Mixed Volume and Breadth
Kenneth J. Gruneisen - Passed the CAN SLIM® Master's Exam
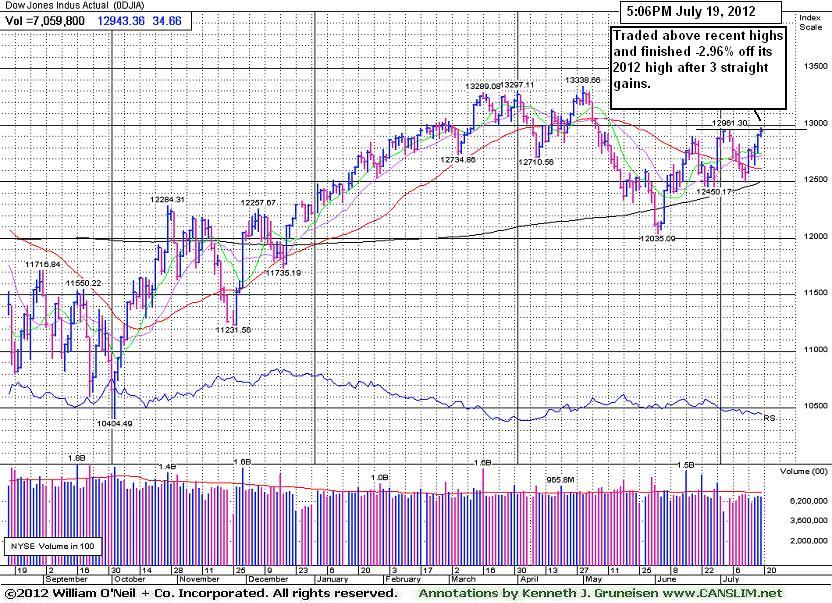
Markets managed to finish higher Thursday after a choppy day of trading. The volume totals were reported mixed, higher on the NYSE versus the prior session's volume total, but the volume total was reported lower on the Nasdaq exchange. Advancing issues led decliners by a narrow margin on the NYSE, but decliners led advancers by nearly 3-2 on the Nasdaq exchange. The total number of new 52-week highs led new 52-week lows on the NYSE and on the Nasdaq exchange. There were 49 high-ranked companies from the CANSLIM.net Leaders List made new 52-week highs and appeared on the CANSLIM.net BreakOuts Page, down from the prior session total of 69 stocks. At the session's close there were gains for only 6 of the 17 high-ranked companies currently included on the Featured Stocks Page.
Stocks wavered throughout the session as investors responded to disappointing economic data. Weekly jobless claims, existing home sales, and manufacturing activity in the Mid-Atlantic region all fell short of consensus projections. Despite the weak economic readings, equities managed to push higher on the heels of positive corporate earnings reports.
The technology sector was the best performing sector.(IBM +3.77%) rose and Qualcomm Inc (QCOM +4.26%) rallied after following their better-than-expected profit tallies. Telecom and financial stocks were pushed into the red after disappointing quarterly reports from Verizon Communications Inc (VZ -2.94%) and Morgan Stanley (MS -5.29%). Also among earnings, Johnson Controls (JCI -7.94%) fell after reporting a disappointing profit tally. energy stocks managed to turn positive as tensions in the Middle East pushed oil higher by $2.57 to $92.44 per barrel. Shares of Apache Corp (APA +1.65%) rallied on crude's advance.
Turning to the fixed income space, Treasuries were modestly lower with the benchmark 10-year note falling 1/8 of a point to yield 1.51%.
The upward trend concerning the M criteria endured recent pressure, yet thus far into the Q2 earnings season the market's rally has been maintained. New buying efforts may be justified in worthy buy candidates with strong fundamental and technical characteristics matching all key investment criteria. The best buy candidates identified by CANSLIM.net's experts are always viewable on the Featured Stocks page.
In August we will begin providing all currently upgraded members access to new monthly webcasts! A new "Market's Leading Groups" archives tab will also soon be added on the Premium Member Homepage. These changes are aimed at satisfying member requests and improving the service. If you have questions, comments or suggestions please let us know via the inquiry form here. The most recent WEBCAST (Q2 2012) is available "ON DEMAND" - CLICK HERE.
PICTURED: The Dow Jones Industrial Average traded above recent highs and finished -2.96% off its 2012 high after 3 straight gains.
|
 Kenneth J. Gruneisen started out as a licensed stockbroker in August 1987, a couple of months prior to the historic stock market crash that took the Dow Jones Industrial Average down -22.6% in a single day. He has published daily fact-based fundamental and technical analysis on high-ranked stocks online for two decades. Through FACTBASEDINVESTING.COM, Kenneth provides educational articles, news, market commentary, and other information regarding proven investment systems that work in good times and bad.
Comments contained in the body of this report are technical opinions only and are not necessarily those of Gruneisen Growth Corp. The material herein has been obtained from sources believed to be reliable and accurate, however, its accuracy and completeness cannot be guaranteed. Our firm, employees, and customers may effect transactions, including transactions contrary to any recommendation herein, or have positions in the securities mentioned herein or options with respect thereto. Any recommendation contained in this report may not be suitable for all investors and it is not to be deemed an offer or solicitation on our part with respect to the purchase or sale of any securities. |
|
 |
Tech and Retail Group Gains Offset Weaker Financials
Kenneth J. Gruneisen - Passed the CAN SLIM® Master's Exam
The tech sector spearheaded the major indices' rally, led higher by the Internet Index ($IIX +2.13%), Semiconductor Index ($SOX +2.04%), and Networking Index ($NWX +1.79%), meanwhile the Biotechnology Index ($BTK -0.39%) backpedaled. The Retail Index ($RLX +1.15%) posted an influential gain, offsetting losses in financial stocks which were a drag on the major averages as the Broker/Dealer Index ($XBD -1.09%) and Bank Index ($BKX -0.52%) fell. The Healthcare Index ($HMO -0.69%) also finished modestly lower. Commodity-linked areas drifted higher as the Integrated Oil Index ($XOI +0.19%), Oil Services Index ($OSX +0.85%) and the Gold & Silver Index ($XAU +1.18%) rose.
Charts courtesy www.stockcharts.com
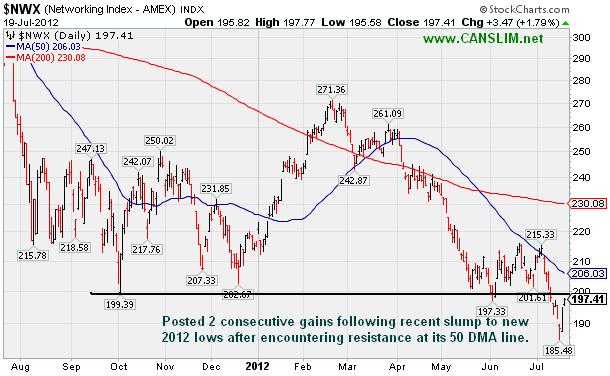
PICTURED: The Networking Index ($NWX +1.79%) posted 2 consecutive gains following a recent slump to new 2012 lows after encountering resistance at its 50-day moving average (DMA) line.
| Oil Services |
$OSX |
213.59 |
+1.81 |
+0.85% |
-1.24% |
| Healthcare |
$HMO |
2,427.10 |
-16.92 |
-0.69% |
+6.38% |
| Integrated Oil |
$XOI |
1,201.40 |
+2.26 |
+0.19% |
-2.25% |
| Semiconductor |
$SOX |
371.34 |
+7.43 |
+2.04% |
+1.89% |
| Networking |
$NWX |
197.41 |
+3.47 |
+1.79% |
-8.25% |
| Internet |
$IIX |
300.88 |
+6.27 |
+2.13% |
+6.79% |
| Broker/Dealer |
$XBD |
83.54 |
-0.92 |
-1.09% |
+0.32% |
| Retail |
$RLX |
621.02 |
+7.09 |
+1.15% |
+18.70% |
| Gold & Silver |
$XAU |
148.02 |
+1.72 |
+1.18% |
-18.06% |
| Bank |
$BKX |
45.75 |
-0.24 |
-0.52% |
+16.18% |
| Biotech |
$BTK |
1,523.72 |
-5.93 |
-0.39% |
+39.61% |
|
|
|
 |
Found Support at 50-Day Average After Negating Recent Breakout
Kenneth J. Gruneisen - Passed the CAN SLIM® Master's Exam
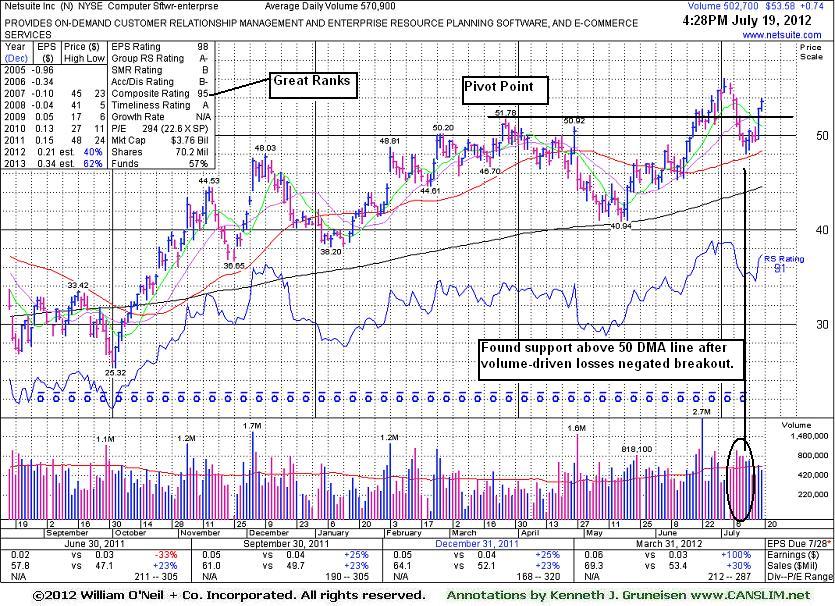
Netsuite Inc (N +$0.74 or +1.40% to $53.58) rebounded further above its pivot point with a gain today backed by below average volume. Damaging volume-driven losses recently negated its prior breakout, and disciplined investors always limit losses by selling if any stock falls more than -7% from their purchase price. If a stock strengthens after it is sold it can always be bought back, but following strict selling rules is what keeps an investor from letting small losses become large losses. Never lose big! In a bullish market environment, leading stocks often flash numerous buy signals from multiple-bases.
Netsuite was last shown in this FSU section on 6/20/12 with an annotated graph under the headline, "Cleared Pivot Point With Gain Backed by +86% Above Average Volume", as it finished strong after highlighted in yellow in that day's mid-day report (read here) with a pivot point cited based on its 3/27/12 high plus 10 cents. Subsequent gains didn't have as much volume conviction while it continued rallying into new high territory unhindered by overhead supply.
Its financial results for the second quarter 2012 will be released after the market close on Thursday, July 26, 2012. Volume and volatility often increase near earnings news. It reported earnings above the +25% guideline in the 3 latest quarterly comparisons through Mar '12. Its annual earnings (A criteria) history improved from losses prior to FY '09. The number of top-rated funds owning its shares rose from 201 in Jun '11 to 285 in Mar '12, a reassuring sign concerning the I criteria.
|
|
|
Color Codes Explained :
Y - Better candidates highlighted by our
staff of experts.
G - Previously featured
in past reports as yellow but may no longer be buyable under the
guidelines.
***Last / Change / Volume data in this table is the closing quote data***
Symbol/Exchange
Company Name
Industry Group |
PRICE |
CHANGE
(%Change) |
Day High |
Volume
(% DAV)
(% 50 day avg vol) |
52 Wk Hi
% From Hi |
Featured
Date |
Price
Featured |
Pivot Featured |
|
Max Buy |
ALXN
-
NASDAQ
Alexion Pharmaceuticals
DRUGS - Drug Manufacturers - Other
|
$100.32
|
+0.21
0.21% |
$101.00
|
1,384,614
63.07% of 50 DAV
50 DAV is 2,195,300
|
$104.38
-3.89%
|
5/1/2012
|
$91.73
|
PP = $95.11
|
|
MB = $99.87
|
Most Recent Note - 7/13/2012 3:38:53 PM
Y - Halted its slide this week above prior highs in the $95 area that define support to watch above its 50 DMA line.
>>> The latest Featured Stock Update with an annotated graph appeared on 6/29/2012. Click here.
View all notes |
Alert me of new notes |
CANSLIM.net Company Profile |
SEC |
Zacks Reports |
StockTalk |
News |
Chart |
Request a new note
C
A N
S L
I M


|
ASPS
-
NASDAQ
Altisource Ptf Sltns Sa
REAL ESTATE - Property Management/Developmen
|
$75.87
|
+0.49
0.65% |
$76.40
|
97,962
71.82% of 50 DAV
50 DAV is 136,400
|
$76.20
-0.43%
|
6/5/2012
|
$60.01
|
PP = $63.00
|
|
MB = $66.15
|
Most Recent Note - 7/13/2012 3:25:36 PM
G - Up today following a damaging loss with above average volume on the prior session. Prior highs in the $65 area and its 50 DMA line define near-term support to watch.
>>> The latest Featured Stock Update with an annotated graph appeared on 7/3/2012. Click here.
View all notes |
Alert me of new notes |
CANSLIM.net Company Profile |
SEC |
Zacks Reports |
StockTalk |
News |
Chart |
Request a new note
C
A N
S L
I M
|
CERN
-
NASDAQ
Cerner Corp
COMPUTER SOFTWARE and SERVICES - Healthcare Information Service
|
$78.14
|
-0.42
-0.53% |
$78.85
|
824,168
57.70% of 50 DAV
50 DAV is 1,428,300
|
$88.32
-11.53%
|
6/7/2012
|
$78.36
|
PP = $84.20
|
|
MB = $88.41
|
Most Recent Note - 7/16/2012 1:12:35 PM
G - Slumping below its 50 DMA line today raising concerns, and prior lows in the $75-76 area define the next important chart support level. It has not formed a proper base since negating its prior breakout.
>>> The latest Featured Stock Update with an annotated graph appeared on 7/9/2012. Click here.
View all notes |
Alert me of new notes |
CANSLIM.net Company Profile |
SEC |
Zacks Reports |
StockTalk |
News |
Chart |
Request a new note
C
A N
S L
I M
|
CMCSA
-
NASDAQ
Comcast Corp Cl A
MEDIA - CATV Systems
|
$32.38
|
-0.01
-0.03% |
$32.78
|
11,321,986
84.33% of 50 DAV
50 DAV is 13,426,600
|
$32.50
-0.37%
|
6/11/2012
|
$29.94
|
PP = $30.98
|
|
MB = $32.53
|
Most Recent Note - 7/13/2012 3:28:27 PM
Y - Trading up today after a loss with above average volume on the prior session. Still consolidating in a tight range near its 52-week high, holding ground above its pivot point. No overhead supply remains to act as resistance and it is still trading below its "max buy" level. See the latest FSU analysis for more details and a new annotated graph.
>>> The latest Featured Stock Update with an annotated graph appeared on 7/11/2012. Click here.
View all notes |
Alert me of new notes |
CANSLIM.net Company Profile |
SEC |
Zacks Reports |
StockTalk |
News |
Chart |
Request a new note
C
A N
S L
I M
|
CSTR
-
NASDAQ
Coinstar Inc
DIVERSIFIED SERVICES - Personal Services
|
$61.00
|
-1.29
-2.07% |
$62.67
|
1,521,859
141.38% of 50 DAV
50 DAV is 1,076,400
|
$71.82
-15.07%
|
6/26/2012
|
$64.05
|
PP = $67.00
|
|
MB = $70.35
|
 Most Recent Note - 7/19/2012 6:34:53 PM
G - Slumped further below its 50 DMA line with above average volume behind today's 5th consecutive damaging loss. Disciplined investors always limit losses by selling if any stock falls more than -7% from their purchase price.
>>> The latest Featured Stock Update with an annotated graph appeared on 6/26/2012. Click here.
View all notes |
Alert me of new notes |
CANSLIM.net Company Profile |
SEC |
Zacks Reports |
StockTalk |
News |
Chart |
Request a new note
C
A N
S L
I M
|
Symbol/Exchange
Company Name
Industry Group |
PRICE |
CHANGE
(%Change) |
Day High |
Volume
(% DAV)
(% 50 day avg vol) |
52 Wk Hi
% From Hi |
Featured
Date |
Price
Featured |
Pivot Featured |
|
Max Buy |
CTRX
-
NASDAQ
Catamaran Corp
COMPUTER SOFTWARE and SERVICES - Healthcare Information Service
|
$90.32
|
-1.52
-1.66% |
$91.80
|
1,139,077
98.44% of 50 DAV
50 DAV is 1,157,100
|
$104.79
-13.81%
|
6/14/2012
|
$94.71
|
PP = $100.60
|
|
MB = $105.63
|
Most Recent Note - 7/19/2012 6:37:43 PM
G - Finished in the upper half of its intra-day range today after slumping further below its 50 DMA line toward prior lows in the $86 area defining important near-term support. A rebound above the 50 DMA line is needed to improve its technical stance.
>>> The latest Featured Stock Update with an annotated graph appeared on 7/16/2012. Click here.
View all notes |
Alert me of new notes |
CANSLIM.net Company Profile |
SEC |
Zacks Reports |
StockTalk |
News |
Chart |
Request a new note
C
A N
S L
I M
|
DG
-
NYSE
Dollar General Corp
RETAIL - Discount, Variety Stores
|
$52.29
|
-1.45
-2.70% |
$54.24
|
5,059,446
133.37% of 50 DAV
50 DAV is 3,793,600
|
$56.04
-6.69%
|
7/16/2012
|
$54.68
|
PP = $56.14
|
|
MB = $58.95
|
Most Recent Note - 7/19/2012 6:23:37 PM
Y - Volume increased behind its 2nd consecutive loss and it finished near the session low, retreating from its all-time high. It did not register volume-driven gains above its new pivot point to trigger a new (or add-on) technical buy signal. Completed another Secondary Offering on 6/05/12, its 4th Secondary Offering since September '11.
>>> The latest Featured Stock Update with an annotated graph appeared on 7/12/2012. Click here.
View all notes |
Alert me of new notes |
CANSLIM.net Company Profile |
SEC |
Zacks Reports |
StockTalk |
News |
Chart |
Request a new note
C
A N
S L
I M
|
ECHO
-
NASDAQ
Echo Global Logistics
DIVERSIFIED SERVICES - Business/Management Services
|
$18.87
|
-0.21
-1.10% |
$19.15
|
151,385
118.09% of 50 DAV
50 DAV is 128,200
|
$19.97
-5.51%
|
6/22/2012
|
$18.98
|
PP = $19.48
|
|
MB = $20.45
|
Most Recent Note - 7/17/2012 3:57:00 PM
Y - Down today on lighter volume after briefly trading above its pivot point and hitting a new 52-week high on the prior session, not quite triggering a proper technical buy signal under the fact-based system.
>>> The latest Featured Stock Update with an annotated graph appeared on 6/22/2012. Click here.
View all notes |
Alert me of new notes |
CANSLIM.net Company Profile |
SEC |
Zacks Reports |
StockTalk |
News |
Chart |
Request a new note
C
A N
S L
I M
|
EXPE
-
NASDAQ
Expedia Inc
INTERNET - Internet Information Providers
|
$47.57
|
+1.02
2.18% |
$48.79
|
3,406,446
90.90% of 50 DAV
50 DAV is 3,747,300
|
$50.66
-6.11%
|
4/27/2012
|
$41.80
|
PP = $35.57
|
|
MB = $37.35
|
Most Recent Note - 7/19/2012 2:22:00 PM
G -Tallying its 3rd consecutive gain today while rebounding and consolidating above its 50 DMA line, showing resilience after briefly undercutting that important short-term average. Found support near prior highs in the $43 area defining an important support level.
>>> The latest Featured Stock Update with an annotated graph appeared on 7/10/2012. Click here.
View all notes |
Alert me of new notes |
CANSLIM.net Company Profile |
SEC |
Zacks Reports |
StockTalk |
News |
Chart |
Request a new note
C
A N
S L
I M
|
GNC
-
NYSE
G N C Holdings Inc
RETAIL - Drug Stores
|
$38.02
|
-0.42
-1.09% |
$38.75
|
977,512
41.77% of 50 DAV
50 DAV is 2,340,500
|
$42.70
-10.96%
|
6/29/2012
|
$39.20
|
PP = $40.00
|
|
MB = $42.00
|
Most Recent Note - 7/16/2012 1:08:11 PM
Y - Still sputtering below its pivot point and trading near its 50 DMA line today following last week's distributional action. Disciplined investors always limit losses if any stock falls more than -7% from their purchase price.
>>> The latest Featured Stock Update with an annotated graph appeared on 7/5/2012. Click here.
View all notes |
Alert me of new notes |
CANSLIM.net Company Profile |
SEC |
Zacks Reports |
StockTalk |
News |
Chart |
Request a new note
C
A N
S L
I M
|
Symbol/Exchange
Company Name
Industry Group |
PRICE |
CHANGE
(%Change) |
Day High |
Volume
(% DAV)
(% 50 day avg vol) |
52 Wk Hi
% From Hi |
Featured
Date |
Price
Featured |
Pivot Featured |
|
Max Buy |
GPX
-
NYSE
G P Strategies Corp
DIVERSIFIED SERVICES - Education and Training Services
|
$17.54
|
-0.45
-2.50% |
$18.01
|
43,313
76.39% of 50 DAV
50 DAV is 56,700
|
$18.99
-7.64%
|
6/29/2012
|
$18.01
|
PP = $18.15
|
|
MB = $19.06
|
Most Recent Note - 7/16/2012 1:09:52 PM
Y - Managed a "positive reversal" on 7/12/12, however recent losses completely negated the prior breakout and raised concerns. Disciplined investors always limit losses by selling any stock if it falls more than -7% from their purchase price.
>>> The latest Featured Stock Update with an annotated graph appeared on 7/6/2012. Click here.
View all notes |
Alert me of new notes |
CANSLIM.net Company Profile |
SEC |
Zacks Reports |
StockTalk |
News |
Chart |
Request a new note
C
A N
S L
I M
|
N
-
NYSE
Netsuite Inc
DIVERSIFIED SERVICES - Business/Management Services
|
$53.58
|
+0.74
1.40% |
$54.00
|
503,081
88.12% of 50 DAV
50 DAV is 570,900
|
$56.06
-4.42%
|
6/20/2012
|
$51.83
|
PP = $51.88
|
|
MB = $54.47
|
Most Recent Note - 7/19/2012 6:21:13 PM
Y - Rebounded further above its pivot point and above previous chart highs with today's gain. Found support above its 50 DMA line after recent losses negated its prior breakout. See the latest FSU analysis for more details and a new annotated graph.
>>> The latest Featured Stock Update with an annotated graph appeared on 7/19/2012. Click here.
View all notes |
Alert me of new notes |
CANSLIM.net Company Profile |
SEC |
Zacks Reports |
StockTalk |
News |
Chart |
Request a new note
C
A N
S L
I M
|
NSM
-
NYSE
Nationstar Mtg Hldgs Inc
FINANCIAL SERVICES - Credit Services
|
$24.00
|
-0.54
-2.20% |
$24.91
|
568,860
71.62% of 50 DAV
50 DAV is 794,300
|
$25.11
-4.42%
|
6/27/2012
|
$20.29
|
PP = $20.46
|
|
MB = $21.48
|
Most Recent Note - 7/16/2012 5:11:01 PM
G - Hovering at its 52-week high with volume totals cooling in the past week after getting extended from its prior base. Prior highs in the $20 area define important support to watch on pullbacks.
>>> The latest Featured Stock Update with an annotated graph appeared on 6/27/2012. Click here.
View all notes |
Alert me of new notes |
CANSLIM.net Company Profile |
SEC |
Zacks Reports |
StockTalk |
News |
Chart |
Request a new note
C
A N
S L
I M
|
TDG
-
NYSE
Transdigm Group Inc
AEROSPACE/DEFENSE - Aerospace/Defense Products and; Services
|
$129.97
|
+0.33
0.25% |
$130.50
|
428,873
86.90% of 50 DAV
50 DAV is 493,500
|
$136.34
-4.67%
|
6/18/2012
|
$127.00
|
PP = $132.79
|
|
MB = $139.43
|
Most Recent Note - 7/18/2012 6:16:34 PM
Y - Found support at its 50 DMA line after a recent breakout attempt lacked volume conviction. See the latest FSU analysis for more details and a new annotated graph.
>>> The latest Featured Stock Update with an annotated graph appeared on 7/18/2012. Click here.
View all notes |
Alert me of new notes |
CANSLIM.net Company Profile |
SEC |
Zacks Reports |
StockTalk |
News |
Chart |
Request a new note
C
A N
S L
I M
|
TNGO
-
NASDAQ
Tangoe Inc
COMPUTER SOFTWARE and SERVICES - Technical and System Software
|
$21.62
|
-0.27
-1.23% |
$22.56
|
476,747
91.81% of 50 DAV
50 DAV is 519,300
|
$23.05
-6.20%
|
6/27/2012
|
$21.70
|
PP = $23.15
|
|
MB = $24.31
|
Most Recent Note - 7/18/2012 1:18:17 PM
Y - Trading up today on light volume, and its color code is changed to yellow after rising back above its 50 DMA line helped its technical stance. Gains above the pivot point backed by +40% above average volume or greater could trigger a new technical buy signal.
>>> The latest Featured Stock Update with an annotated graph appeared on 6/28/2012. Click here.
View all notes |
Alert me of new notes |
CANSLIM.net Company Profile |
SEC |
Zacks Reports |
StockTalk |
News |
Chart |
Request a new note
C
A N
S L
I M
|
Symbol/Exchange
Company Name
Industry Group |
PRICE |
CHANGE
(%Change) |
Day High |
Volume
(% DAV)
(% 50 day avg vol) |
52 Wk Hi
% From Hi |
Featured
Date |
Price
Featured |
Pivot Featured |
|
Max Buy |
VSI
-
NYSE
Vitamin Shoppe Inc
SPECIALTY RETAIL - Specialty Retail, Other
|
$55.57
|
+0.07
0.13% |
$56.50
|
171,693
35.50% of 50 DAV
50 DAV is 483,700
|
$58.22
-4.55%
|
6/29/2012
|
$54.93
|
PP = $55.03
|
|
MB = $57.78
|
Most Recent Note - 7/16/2012 1:06:08 PM
Y - Slumping below its pivot point with today's loss. Recent gains helped it trade above the new pivot point based on its 6/22/12 high after forming an 8-week cup-with-handle base, but the gains have lacked the volume required to trigger a proper new (or add-on) technical buy signal.
>>> The latest Featured Stock Update with an annotated graph appeared on 7/2/2012. Click here.
View all notes |
Alert me of new notes |
CANSLIM.net Company Profile |
SEC |
Zacks Reports |
StockTalk |
News |
Chart |
Request a new note
C
A N
S L
I M
|
WFM
-
NASDAQ
Whole Foods Market Inc
RETAIL - Grocery Stores
|
$90.54
|
-2.00
-2.16% |
$92.17
|
3,146,203
173.67% of 50 DAV
50 DAV is 1,811,600
|
$97.25
-6.90%
|
6/13/2012
|
$89.90
|
PP = $91.60
|
|
MB = $96.18
|
Most Recent Note - 7/19/2012 2:18:30 PM
G - Violating its 50 DMA line with today's damaging loss with above average volume following an analyst downgrade and its color code is changed to green. It is also slumping below prior highs in the $91.50 area, triggering technical sell signals. Only a prompt rebound above its 50 DMA would help its technical stance improve.
>>> The latest Featured Stock Update with an annotated graph appeared on 7/13/2012. Click here.
View all notes |
Alert me of new notes |
CANSLIM.net Company Profile |
SEC |
Zacks Reports |
StockTalk |
News |
Chart |
Request a new note
C
A N
S L
I M
|
|
|
|
THESE ARE NOT BUY RECOMMENDATIONS!
Comments contained in the body of this report are technical
opinions only. The material herein has been obtained
from sources believed to be reliable and accurate, however,
its accuracy and completeness cannot be guaranteed.
This site is not an investment advisor, hence it does
not endorse or recommend any securities or other investments.
Any recommendation contained in this report may not
be suitable for all investors and it is not to be deemed
an offer or solicitation on our part with respect to
the purchase or sale of any securities. All trademarks,
service marks and trade names appearing in this report
are the property of their respective owners, and are
likewise used for identification purposes only.
This report is a service available
only to active Paid Premium Members.
You may opt-out of receiving report notifications
at any time. Questions or comments may be submitted
by writing to Premium Membership Services 665 S.E. 10 Street, Suite 201 Deerfield Beach, FL 33441-5634 or by calling 1-800-965-8307
or 954-785-1121.
|
|
|

