You are not logged in.
This means you
CAN ONLY VIEW reports that were published prior to Monday, April 14, 2025.
You
MUST UPGRADE YOUR MEMBERSHIP if you want to see any current reports.
AFTER MARKET UPDATE - TUESDAY, JULY 19TH, 2011
Previous After Market Report Next After Market Report >>>
|
|
|
|
DOW |
+202.26 |
12,587.42 |
+1.63% |
|
Volume |
866,159,700 |
-1% |
|
Volume |
1,825,430,170 |
+7% |
|
NASDAQ |
+61.41 |
2,826.52 |
+2.22% |
|
Advancers |
2,379 |
77% |
|
Advancers |
2,035 |
76% |
|
S&P 500 |
+21.29 |
1,326.73 |
+1.63% |
|
Decliners |
641 |
21% |
|
Decliners |
551 |
21% |
|
Russell 2000 |
+18.65 |
834.62 |
+2.29% |
|
52 Wk Highs |
87 |
|
|
52 Wk Highs |
83 |
|
|
S&P 600 |
+10.24 |
450.09 |
+2.33% |
|
52 Wk Lows |
33 |
|
|
52 Wk Lows |
38 |
|
|
 |
Major Indices Found Support Near 50-Day Moving Average Lines
Kenneth J. Gruneisen - Passed the CAN SLIM® Master's Exam
Strong corporate profits and signs of progress in debt talks drove a sharp rally for the major averages on Tuesday. There was slightly lower volume reported on the NYSE, meanwhile volume on the Nasdaq exchange rose over the prior session total. Breadth was very positive as advancing issues beat decliners by nearly 4-1 on the NYSE and on the Nasdaq exchange. New 52-week highs resumed outnumbering new 52-week lows on the NYSE and on the Nasdaq exchange again. There were 50 high-ranked companies from the CANSLIM.net Leaders List that made new 52-week highs and appeared on the CANSLIM.net BreakOuts Page, up solidly from the total of 19 on the prior session. There were 16 gainers out of the 18 high-ranked leaders currently included on the Featured Stocks Page.
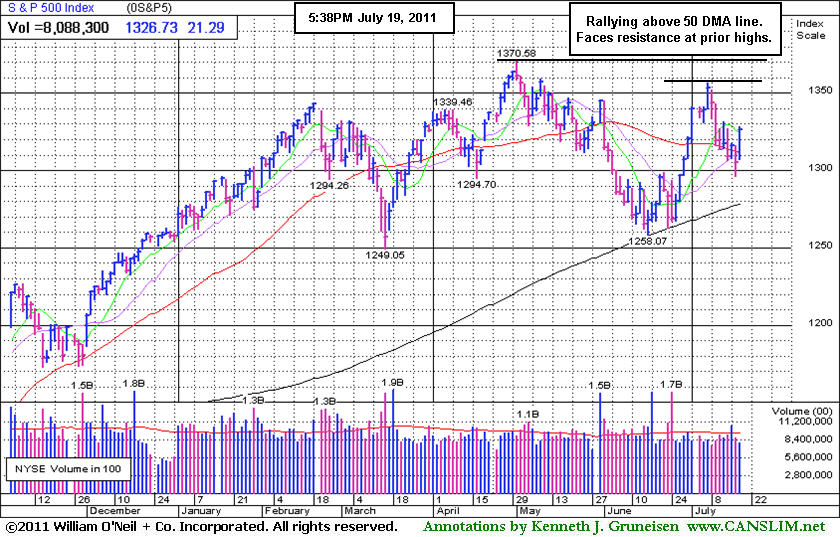
The S&P 500 Index, Dow Jones Industrial Average, and Nasdaq Composite Index all have found support at their respective 50-day moving average (DMA) lines. Any subsequent losses violating their short-term averages and recent lows would obviously bode poorly for the market outlook.
As memories of Monday's retreat faded, familiar names including International Business Machines (IBM +5.67%) and The Coca-Cola Company (KO +3.28%) were the best performing Dow components. Both reported rising second-quarter earnings. IBM also boosted its full-year forecast. Two big banks were left out of the party. Bank of America (BAC -1.54%) and Goldman Sachs (GS -0.65%) slipped on disappointing results. Meanwhile, mining stocks came under pressure as gold ended its 10-session winning streak and the appetite for risk returned to the market.
Stocks got a further boost late in the day when President Obama praised advances in Senate negotiations to reach a deal on the debt ceiling and avoid a default. The market also relished economic news. Homebuilders, including Pulte Group Inc (PHM +3.46%), advanced after housing starts increased more than forecast in June to the fastest pace in five months.
The July 2011 issue of CANSLIM.net News is due to be released soon with a comprehensive summary of current market conditions that further clarifies matters concerning the M criteria! The Q2 2011 CANSLIM.net Webcast is available "ON DEMAND" now to UPGRADED MEMBERS ONLY - (CLICK HERE).
PICTURED: The S&P 500 Index rallied back above its 50 DMA line (the downward sloping red line) but faces resistance at prior chart highs.
|
 Kenneth J. Gruneisen started out as a licensed stockbroker in August 1987, a couple of months prior to the historic stock market crash that took the Dow Jones Industrial Average down -22.6% in a single day. He has published daily fact-based fundamental and technical analysis on high-ranked stocks online for two decades. Through FACTBASEDINVESTING.COM, Kenneth provides educational articles, news, market commentary, and other information regarding proven investment systems that work in good times and bad.
Comments contained in the body of this report are technical opinions only and are not necessarily those of Gruneisen Growth Corp. The material herein has been obtained from sources believed to be reliable and accurate, however, its accuracy and completeness cannot be guaranteed. Our firm, employees, and customers may effect transactions, including transactions contrary to any recommendation herein, or have positions in the securities mentioned herein or options with respect thereto. Any recommendation contained in this report may not be suitable for all investors and it is not to be deemed an offer or solicitation on our part with respect to the purchase or sale of any securities. |
|
 |
Tech Sector Set Strong Pace on Broadly Positive Day
Kenneth J. Gruneisen - Passed the CAN SLIM® Master's Exam
The Broker/Dealer Index ($XBD +0.87%) and Bank Index ($BKX +1.36%) posted gains, but they were not key contributors to Tuesday's big rally. The tech sector led Tuesday's gains, which helped the Nasdaq Composite Index outpace its peers. The Networking Index ($NWX +4.30%) led the charge, followed by solid gains from the Semiconductor Index ($SOX +3.32%), Internet Index ($IIX +2.68%), and Biotechnology Index ($BTK +2.06%). The Retail Index ($RLX +2.04%) rose, and energy-related shares rallied as the Integrated Oil Index ($XOI +1.44%) and Oil Services Index ($OSX +2.52%) also posted solid gains. Defensive groups were weaker as the Gold & Silver Index ($XAU -0.74%) backed off slightly following its latest sharp sprint higher, and the Healthcare Index ($HMO +0.26%) inched up for a small gain.
Charts courtesy www.stockcharts.com
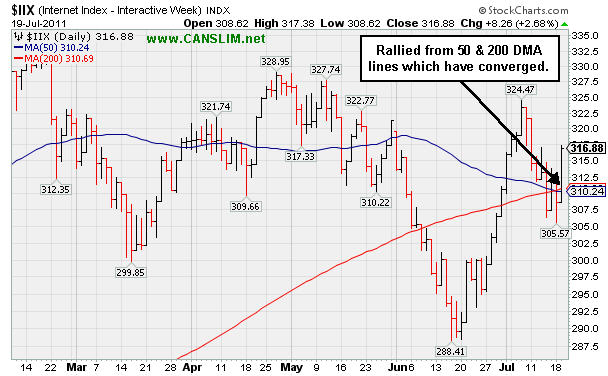
PICTURED: The Internet Index ($IIX +2.68%) rallied from near its 50 & 200 DMA lines which have converged.
| Oil Services |
$OSX |
275.54 |
+6.77 |
+2.52% |
+12.41% |
| Healthcare |
$HMO |
2,412.04 |
+6.15 |
+0.26% |
+42.56% |
| Integrated Oil |
$XOI |
1,322.65 |
+18.82 |
+1.44% |
+9.02% |
| Semiconductor |
$SOX |
397.41 |
+12.78 |
+3.32% |
-3.50% |
| Networking |
$NWX |
292.88 |
+12.09 |
+4.30% |
+4.39% |
| Internet |
$IIX |
316.88 |
+8.26 |
+2.68% |
+2.97% |
| Broker/Dealer |
$XBD |
102.01 |
+0.88 |
+0.87% |
-16.05% |
| Retail |
$RLX |
549.16 |
+10.97 |
+2.04% |
+8.02% |
| Gold & Silver |
$XAU |
217.84 |
-1.63 |
-0.74% |
-3.86% |
| Bank |
$BKX |
46.25 |
+0.62 |
+1.36% |
-11.42% |
| Biotech |
$BTK |
1,442.70 |
+29.10 |
+2.06% |
+11.18% |
|
|
|
 |
Strong Leader's Latest Consolidation is Not a Sound Base
Kenneth J. Gruneisen - Passed the CAN SLIM® Master's Exam
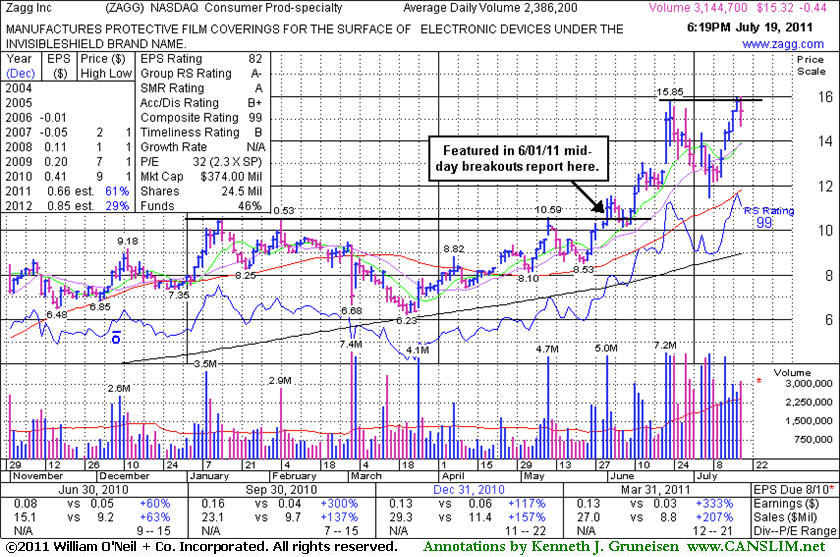
Zagg Inc (ZAGG -$0.44 or -2.79% to $15.32) touched a new all-time high today, but it bucked the broader market and reversed to close with a small loss on slightly higher volume, breaking a streak of 5 consecutive gains. No overhead supply remains to act as resistance, however its short "V" shaped consolidation in recent weeks is not recognized as a sound base pattern so a new pivot point is not being cited. Its 50-day moving average (DMA) line and recent lows define chart support.
The stock's last appearance in this FSU section was on 6/23/11 and it included an annotated graph under the headline, "Outlier Tallied Big Gains and Deserves Time to Deliver More". It was explained that in the Certification program they teach investors to adhere to a rule of holding stocks for a minimum of at least 8 weeks whenever they rise more than +20% in the first 2-3 weeks after they are first bought. Stocks that quickly tallied such large gains have historically proven to produce some of the stock market's biggest gains.
Patience may allow for a proper new base to form and for a fresh technical breakout to allow new or add-on buying efforts without straying from the fact-based investment system guidelines. Remember to be patient, and do not significantly average up your cost basis with later purchases. Only buy smaller amounts upon any subsequent breakouts. Those who follow the investment system's rules never average down. Odds are better for your success are substantially better when your buys are made while a stock is rising in price, not falling.
Strong quarterly and annual earnings increases satisfy the C and A criteria. The number of top-rated funds owning its shares rose from 13 in Jun '10 to 60 in Mar '11, a reassuring sign concerning the I criteria. As always, strict buying and selling rules must be followed in order to maximize gains and minimize losses.
|
|
|
Color Codes Explained :
Y - Better candidates highlighted by our
staff of experts.
G - Previously featured
in past reports as yellow but may no longer be buyable under the
guidelines.
***Last / Change / Volume data in this table is the closing quote data***
Symbol/Exchange
Company Name
Industry Group |
PRICE |
CHANGE
(%Change) |
Day High |
Volume
(% DAV)
(% 50 day avg vol) |
52 Wk Hi
% From Hi |
Featured
Date |
Price
Featured |
Pivot Featured |
|
Max Buy |
CACC
-
NASDAQ
Credit Acceptance Corp
FINANCIAL SERVICES - Credit Services
|
$82.00
|
+0.27
0.33% |
$82.29
|
15,540
37.72% of 50 DAV
50 DAV is 41,200
|
$86.87
-5.61%
|
6/2/2011
|
$76.10
|
PP = $82.39
|
|
MB = $86.51
|
Most Recent Note - 7/18/2011 7:37:58 PM
Y - Its loss today on light volume led to a close below its pivot point, raising some concerns. Prior high closes define support to watch above important chart support at its 50 DMA line.
>>> The latest Featured Stock Update with an annotated graph appeared on 6/27/2011. Click here.
View all notes |
Alert me of new notes |
CANSLIM.net Company Profile |
SEC |
Zacks Reports |
StockTalk |
News |
Chart |
Request a new note
C
A N
S L
I M


|
CMG
-
NYSE
Chipotle Mexican Grill
LEISURE - Restaurants
|
$333.71
|
+5.72
1.74% |
$333.71
|
1,472,908
190.27% of 50 DAV
50 DAV is 774,100
|
$329.80
1.19%
|
4/1/2011
|
$274.00
|
PP = $275.10
|
|
MB = $288.86
|
 Most Recent Note - 7/19/2011 12:35:42 PM
G - Up today for another new all-time high. Extended from prior highs and an upward trendline defining chart support to watch.
>>> The latest Featured Stock Update with an annotated graph appeared on 7/8/2011. Click here.
View all notes |
Alert me of new notes |
CANSLIM.net Company Profile |
SEC |
Zacks Reports |
StockTalk |
News |
Chart |
Request a new note
C
A N
S L
I M
|
EW
-
NYSE
Edwards Lifesciences Cp
HEALTH SERVICES - Medical Appliances and Equipment
|
$89.65
|
-0.04
-0.04% |
$90.90
|
817,283
111.56% of 50 DAV
50 DAV is 732,600
|
$91.82
-2.36%
|
7/6/2011
|
$89.19
|
PP = $90.48
|
|
MB = $95.00
|
Most Recent Note - 7/18/2011 12:44:22 PM
Y - This high-ranked Medical - Products firm is up from the session's earlier lows, perched within close striking distance of its 52-week and all-time highs. Since featured in the 7/06/11 mid-day report it encountered mild distributional pressure and did not rally for a strong close above its pivot point to trigger a proper technical buy signal.
>>> The latest Featured Stock Update with an annotated graph appeared on 7/7/2011. Click here.
View all notes |
Alert me of new notes |
CANSLIM.net Company Profile |
SEC |
Zacks Reports |
StockTalk |
News |
Chart |
Request a new note
C
A N
S L
I M
|
EZPW
-
NASDAQ
Ezcorp Inc Cl A
SPECIALTY RETAIL - Specialty Retail, Other
|
$37.01
|
+0.74
2.04% |
$37.38
|
371,739
92.47% of 50 DAV
50 DAV is 402,000
|
$38.66
-4.27%
|
6/13/2011
|
$31.18
|
PP = $33.41
|
|
MB = $35.08
|
Most Recent Note - 7/19/2011 4:22:55 PM
G - Small gap up gain today with lighter volume. It is very extended from prior highs in the $33 area that define support to watch on pullbacks.
>>> The latest Featured Stock Update with an annotated graph appeared on 7/5/2011. Click here.
View all notes |
Alert me of new notes |
CANSLIM.net Company Profile |
SEC |
Zacks Reports |
StockTalk |
News |
Chart |
Request a new note
C
A N
S L
I M
|
FCFS
-
NASDAQ
First Cash Financial Svs
SPECIALTY RETAIL - Specialty Retail, Other
|
$42.54
|
+0.69
1.65% |
$42.66
|
118,650
63.96% of 50 DAV
50 DAV is 185,500
|
$44.84
-5.13%
|
5/31/2011
|
$42.00
|
PP = $40.23
|
|
MB = $42.24
|
Most Recent Note - 7/18/2011 7:31:07 PM
Y - Consolidating -6.7% off its all-time high today, and its color code is changed to yellow while perched just under its "max buy" level. Prior highs in the $40-42 area define initial support areas to watch. See the latest FSU analysis for more details and a new annotated graph.
>>> The latest Featured Stock Update with an annotated graph appeared on 7/18/2011. Click here.
View all notes |
Alert me of new notes |
CANSLIM.net Company Profile |
SEC |
Zacks Reports |
StockTalk |
News |
Chart |
Request a new note
C
A N
S L
I M
|
Symbol/Exchange
Company Name
Industry Group |
PRICE |
CHANGE
(%Change) |
Day High |
Volume
(% DAV)
(% 50 day avg vol) |
52 Wk Hi
% From Hi |
Featured
Date |
Price
Featured |
Pivot Featured |
|
Max Buy |
FOSL
-
NASDAQ
Fossil Inc
CONSUMER DURABLES - Recreational Goods, Other
|
$134.29
|
+5.37
4.17% |
$134.77
|
1,034,602
130.81% of 50 DAV
50 DAV is 790,900
|
$130.50
2.90%
|
2/1/2011
|
$73.30
|
PP = $74.44
|
|
MB = $78.16
|
Most Recent Note - 7/19/2011 12:45:20 PM
G - Gapped up today and hit another new all-time high. It may produce more climactic gains but it is very extended from prior highs in the $107 area that now define support to watch near its 50 DMA line.
>>> The latest Featured Stock Update with an annotated graph appeared on 6/28/2011. Click here.
View all notes |
Alert me of new notes |
CANSLIM.net Company Profile |
SEC |
Zacks Reports |
StockTalk |
News |
Chart |
Request a new note
C
A N
S L
I M
|
HS
-
NYSE
Healthspring Inc
HEALTH SERVICES - Health Care Plans
|
$45.57
|
+0.52
1.15% |
$45.79
|
574,869
68.11% of 50 DAV
50 DAV is 844,000
|
$48.95
-6.91%
|
6/16/2011
|
$42.44
|
PP = $45.21
|
|
MB = $47.47
|
Most Recent Note - 7/15/2011 4:18:50 PM
Y - Quietly consolidating this week under its "max buy" level. Prior resistance near $45 coinciding with its 50 DMA line defines an important support level to watch.
>>> The latest Featured Stock Update with an annotated graph appeared on 7/11/2011. Click here.
View all notes |
Alert me of new notes |
CANSLIM.net Company Profile |
SEC |
Zacks Reports |
StockTalk |
News |
Chart |
Request a new note
C
A N
S L
I M
|
INFA
-
NASDAQ
Informatica Corp
COMPUTER SOFTWARE and SERVICES - Business Software and Services
|
$54.94
|
+1.24
2.31% |
$55.70
|
2,039,369
155.74% of 50 DAV
50 DAV is 1,309,500
|
$62.42
-11.98%
|
7/1/2011
|
$59.36
|
PP = $60.08
|
|
MB = $63.08
|
Most Recent Note - 7/19/2011 4:26:42 PM
G - Today's second gain in a row with above average volume was a sign of support. A positive reversal on the prior session after undercutting the previously noted low was a reassuring sign, however its 50 DMA line may now act as a resistance level.
>>> The latest Featured Stock Update with an annotated graph appeared on 7/12/2011. Click here.
View all notes |
Alert me of new notes |
CANSLIM.net Company Profile |
SEC |
Zacks Reports |
StockTalk |
News |
Chart |
Request a new note
C
A N
S L
I M
|
LULU
-
NASDAQ
Lululemon Athletica
MANUFACTURING - Textile Manufacturing
|
$63.51
|
+3.03
5.01% |
$63.96
|
3,664,653
88.78% of 50 DAV
50 DAV is 4,127,700
|
$62.86
1.03%
|
6/21/2011
|
$102.95
|
PP = $101.14
|
|
MB = $106.20
|
Most Recent Note - 7/19/2011 3:33:57 PM
G - Hitting a new all-time high today, very extended from a sound base and proper buy point. A 2:1 split effective 7/12/11 impacted prices (and prior Featured Price, Pivot Point, and Max Buy levels will soon be adjusted).
>>> The latest Featured Stock Update with an annotated graph appeared on 7/15/2011. Click here.
View all notes |
Alert me of new notes |
CANSLIM.net Company Profile |
SEC |
Zacks Reports |
StockTalk |
News |
Chart |
Request a new note
C
A N
S L
I M
|
MWIV
-
NASDAQ
M W I Veterinary Supply
HEALTH SERVICES - Medical Instruments and; Supplies
|
$82.77
|
+1.64
2.02% |
$82.89
|
31,236
48.20% of 50 DAV
50 DAV is 64,800
|
$86.99
-4.85%
|
7/11/2011
|
$83.39
|
PP = $84.67
|
|
MB = $88.90
|
Most Recent Note - 7/19/2011 4:37:46 PM
Y - Rallied back above its 50 DMA line and closed near the session high today with a gain on below average volume. Color code was changed to yellow with new pivot point cited based on its 5/20/11 high plus 10 cents. Volume-driven gains are needed to confirm a proper technical buy signal.
>>> The latest Featured Stock Update with an annotated graph appeared on 6/30/2011. Click here.
View all notes |
Alert me of new notes |
CANSLIM.net Company Profile |
SEC |
Zacks Reports |
StockTalk |
News |
Chart |
Request a new note
C
A N
S L
I M
|
Symbol/Exchange
Company Name
Industry Group |
PRICE |
CHANGE
(%Change) |
Day High |
Volume
(% DAV)
(% 50 day avg vol) |
52 Wk Hi
% From Hi |
Featured
Date |
Price
Featured |
Pivot Featured |
|
Max Buy |
OPNT
-
NASDAQ
Opnet Technologies
INTERNET - Internet Software and Services
|
$39.73
|
+0.30
0.76% |
$40.05
|
105,812
84.31% of 50 DAV
50 DAV is 125,500
|
$42.51
-6.54%
|
6/28/2011
|
$40.87
|
PP = $42.61
|
|
MB = $44.74
|
Most Recent Note - 7/14/2011 3:47:47 PM
G - Still sputtering today perched just above its 50 DMA line. Its color code was changed to green after mild distributional damage, and disciplined investors should note that it did not trigger a confirming technical buy signal after its new pivot point was recently cited. Recent lows near $36 define important near-term chart support.
>>> The latest Featured Stock Update with an annotated graph appeared on 7/1/2011. Click here.
View all notes |
Alert me of new notes |
CANSLIM.net Company Profile |
SEC |
Zacks Reports |
StockTalk |
News |
Chart |
Request a new note
C
A N
S L
I M
|
OTEX
-
NASDAQ
Open Text Corp
INTERNET - Internet Software and Services
|
$69.05
|
+0.84
1.23% |
$69.54
|
236,001
81.58% of 50 DAV
50 DAV is 289,300
|
$72.32
-4.52%
|
6/1/2011
|
$65.86
|
PP = $67.18
|
|
MB = $70.54
|
Most Recent Note - 7/14/2011 1:27:09 PM
Y - It has reversed into the red today from earlier highs above its "max buy" level after a gap up. The 7/13/11 gain with volume +187% above average confirmed a technical buy signal.
>>> The latest Featured Stock Update with an annotated graph appeared on 6/24/2011. Click here.
View all notes |
Alert me of new notes |
CANSLIM.net Company Profile |
SEC |
Zacks Reports |
StockTalk |
News |
Chart |
Request a new note
C
A N
S L
I M
|
PRGO
-
NASDAQ
Perrigo Co
DRUGS - Drug Related Products
|
$93.13
|
+2.49
2.75% |
$93.39
|
464,286
100.32% of 50 DAV
50 DAV is 462,800
|
$93.70
-0.61%
|
7/13/2011
|
$92.89
|
PP = $92.40
|
|
MB = $97.02
|
Most Recent Note - 7/19/2011 3:55:31 PM
Y - Gapped up today and it is poised to finish at a new high close without great volume conviction behind its gain. A strong volume-driven gain and close above its pivot point may trigger a technical buy signal, however it is considered a riskier late-stage setup.
>>> The latest Featured Stock Update with an annotated graph appeared on 7/13/2011. Click here.
View all notes |
Alert me of new notes |
CANSLIM.net Company Profile |
SEC |
Zacks Reports |
StockTalk |
News |
Chart |
Request a new note
C
A N
S L
I M
|
QSII
-
NASDAQ
Quality Systems Inc
COMPUTER SOFTWARE and SERVICES - Healthcare Information Service
|
$88.57
|
+3.02
3.53% |
$88.62
|
124,681
54.66% of 50 DAV
50 DAV is 228,100
|
$92.38
-4.12%
|
7/6/2011
|
$91.26
|
PP = $91.67
|
|
MB = $96.25
|
Most Recent Note - 7/19/2011 3:57:28 PM
G - Gain today without great volume has halted its slide after slumping to its 50 DMA line with 6 consecutive losses. It did not convincingly trigger a new technical buy signal after recently featured in yellow in the 7/06/11 mid-day report.
>>> The latest Featured Stock Update with an annotated graph appeared on 7/6/2011. Click here.
View all notes |
Alert me of new notes |
CANSLIM.net Company Profile |
SEC |
Zacks Reports |
StockTalk |
News |
Chart |
Request a new note
C
A N
S L
I M
|
SWI
-
NYSE
Solarwinds Inc
COMPUTER SOFTWARE and SERVICES - Application Software
|
$24.30
|
+0.62
2.62% |
$24.38
|
521,914
60.56% of 50 DAV
50 DAV is 861,800
|
$26.68
-8.92%
|
6/7/2011
|
$24.22
|
PP = $25.05
|
|
MB = $26.30
|
Most Recent Note - 7/19/2011 3:59:13 PM
G - Small gain today on light volume following a streak of 7 consecutive losses. After the recent violation of its 50 DMA line triggered a technical sell signal, that short-term average may now act as a resistance level
>>> The latest Featured Stock Update with an annotated graph appeared on 6/29/2011. Click here.
View all notes |
Alert me of new notes |
CANSLIM.net Company Profile |
SEC |
Zacks Reports |
StockTalk |
News |
Chart |
Request a new note
C
A N
S L
I M
|
Symbol/Exchange
Company Name
Industry Group |
PRICE |
CHANGE
(%Change) |
Day High |
Volume
(% DAV)
(% 50 day avg vol) |
52 Wk Hi
% From Hi |
Featured
Date |
Price
Featured |
Pivot Featured |
|
Max Buy |
UA
-
NYSE
Under Armour Inc Cl A
CONSUMER NON-DURABLES - Textile - Apparel Clothing
|
$82.40
|
+4.72
6.08% |
$82.66
|
1,535,573
128.60% of 50 DAV
50 DAV is 1,194,100
|
$81.52
1.08%
|
7/19/2011
|
$81.33
|
PP = $81.52
|
|
MB = $85.60
|
Most Recent Note - 7/19/2011 6:40:38 PM
Y - Its color code was changed to yellow in today's mid-day report with a new pivot point cited after forming a cup-with-handle base pattern. It rallied and closed well above its pivot point, however the session's volume total, at +29% above average, did not reach the minimum threshold to trigger a proper technical buy signal. Subsequent gains could help confirm the breakout. UA found support near earlier lows in the $62 area after it was dropped from the Featured Stocks list on 5/03/11 and it has rebounded impressively. It is due to report earnings on the morning of July 26th.

>>> The latest Featured Stock Update with an annotated graph appeared on 4/29/2011. Click here.
View all notes |
Alert me of new notes |
CANSLIM.net Company Profile |
SEC |
Zacks Reports |
StockTalk |
News |
Chart |
Request a new note
C
A N
S L
I M
|
ULTA
-
NASDAQ
Ulta Salon Cosm & Frag
SPECIALTY RETAIL - Specialty Retail, Other
|
$65.75
|
+2.02
3.17% |
$66.13
|
521,119
58.09% of 50 DAV
50 DAV is 897,100
|
$68.80
-4.43%
|
1/6/2011
|
$36.12
|
PP = $37.34
|
|
MB = $39.21
|
Most Recent Note - 7/19/2011 4:16:43 PM
G - Quiet volume was behind today's gain. It is extended from any sound base pattern and well above its 50 DMA line. It rallied +200% since first featured in yellow at $22.81 in the 3/12/10 mid-day report.
>>> The latest Featured Stock Update with an annotated graph appeared on 7/14/2011. Click here.
View all notes |
Alert me of new notes |
CANSLIM.net Company Profile |
SEC |
Zacks Reports |
StockTalk |
News |
Chart |
Request a new note
C
A N
S L
I M
|
ZAGG
-
NASDAQ
Zagg Inc
SPECIALTY RETAIL - Specialty Retail, Other
|
$15.32
|
-0.44
-2.79% |
$16.00
|
3,173,676
133.00% of 50 DAV
50 DAV is 2,386,200
|
$15.96
-4.01%
|
6/1/2011
|
$10.92
|
PP = $10.59
|
|
MB = $11.12
|
Most Recent Note - 7/19/2011 4:20:53 PM
G - Touched a new all-time high today but it bucked the broader market and reversed to close with a small loss on slightly higher volume, breaking a streak of 5 consecutive gains. No overhead supply remains to act as resistance, however its short V shaped consolidation in recent weeks is not recognized as a sound base pattern. Its 50 DMA line and recent lows define chart support.
>>> The latest Featured Stock Update with an annotated graph appeared on 7/19/2011. Click here.
View all notes |
Alert me of new notes |
CANSLIM.net Company Profile |
SEC |
Zacks Reports |
StockTalk |
News |
Chart |
Request a new note
C
A N
S L
I M
|
|
|
|
THESE ARE NOT BUY RECOMMENDATIONS!
Comments contained in the body of this report are technical
opinions only. The material herein has been obtained
from sources believed to be reliable and accurate, however,
its accuracy and completeness cannot be guaranteed.
This site is not an investment advisor, hence it does
not endorse or recommend any securities or other investments.
Any recommendation contained in this report may not
be suitable for all investors and it is not to be deemed
an offer or solicitation on our part with respect to
the purchase or sale of any securities. All trademarks,
service marks and trade names appearing in this report
are the property of their respective owners, and are
likewise used for identification purposes only.
This report is a service available
only to active Paid Premium Members.
You may opt-out of receiving report notifications
at any time. Questions or comments may be submitted
by writing to Premium Membership Services 665 S.E. 10 Street, Suite 201 Deerfield Beach, FL 33441-5634 or by calling 1-800-965-8307
or 954-785-1121.
|
|
|

