You are not logged in.
This means you
CAN ONLY VIEW reports that were published prior to Monday, April 14, 2025.
You
MUST UPGRADE YOUR MEMBERSHIP if you want to see any current reports.
AFTER MARKET UPDATE - THURSDAY, JULY 18TH, 2013
Previous After Market Report Next After Market Report >>>
|
|
|
|
DOW |
+78.02 |
15,548.54 |
+0.50% |
|
Volume |
668,425,130 |
-1% |
|
Volume |
1,632,594,380 |
+9% |
|
NASDAQ |
+1.28 |
3,611.28 |
+0.04% |
|
Advancers |
2,067 |
66% |
|
Advancers |
1,542 |
60% |
|
S&P 500 |
+8.46 |
1,689.37 |
+0.50% |
|
Decliners |
952 |
30% |
|
Decliners |
932 |
36% |
|
Russell 2000 |
+7.74 |
1,050.27 |
+0.74% |
|
52 Wk Highs |
326 |
|
|
52 Wk Highs |
336 |
|
|
S&P 600 |
+4.63 |
590.35 |
+0.79% |
|
52 Wk Lows |
12 |
|
|
52 Wk Lows |
8 |
|
|
 |
New Record High Closes for Dow Industrials and S&P 500 Index
Kenneth J. Gruneisen - Passed the CAN SLIM® Master's Exam
The major averages finished higher for the second straight session. The Dow was up 78 points to 15,548 and the S&P 500 Index gained over 8 points to 1,689 as both indices closed Thursday's session at new all-time highs. Volume totals were mixed, lower than the prior session volume total on the NYSE and higher on the Nasdaq exchange. Breadth was positive as advancers led decliners by more than a 2-1 margin on the NYSE and by a 3-2 margin on the Nasdaq exchange. There were 85 high-ranked companies from the CANSLIM.net Leaders List made new 52-week highs and appeared on the CANSLIM.net BreakOuts Page, up from the prior session total of 66 stocks. The list of stocks hitting new 52-week highs expanded and easily outnumbered new 52-week lows on both the NYSE and the Nasdaq exchange, and the new lows total on Nasdaq exchange remained in the single digits. There were gains for only 5 of the 12 high-ranked companies currently included on the Featured Stocks Page, a disconcertingly negative bias versus the broader market.
Equity markets benefited from encouraging economic data and another round of mostly positive earnings results. On the economic front, jobless claims dropped to a two-month low of 334,000 and manufacturing in the mid-Atlantic region unexpectedly expanded in July at its highest pace since March 2011. The second leg of Fed Chairman Bernanke's congressional testimony added to the upside as he emphasized the central bank will not tighten monetary policy in the foreseeable future.
Overall, eight of the 10 S&P 500 sectors gained ground. Financials paced the advance. Morgan Stanley (MS +4.37%) rallied to a two-year high after posting better-than-expected earnings and announcing a stock repurchase plan. Telecommunication was the worst performing group with Verizon Communications Inc (VZ -1.52%) falling as a surge in expenses cut into its second-quarter profit margin. Technology also lagged behind due to Intel Corp's (INTC -3.75%) drop after delivering a disappointing full-year outlook. International Business Machines Corp (IBM +1.77%) helped the tech sector with a positive reaction to its earnings. Earnings season continued after the close with notable profit tallies out from Google Inc (GOOG -0.86%) and Microsoft Corp (MSFT -0.84%).
In fixed-income, Treasury prices declined for the first time this week. The 10-year note fell 12/32 to yield 2.53% and the 30-year bond lost a full point to yield 3.63%.
The market (M criteria) has flashed substantial strength and leadership. Now in a confirmed rally, odds are considered favorable for investors' success with new buying efforts. Investors should be disciplined and selective while looking to be proactive and focused exclusively on the individual leaders best matching the winning models of the fact-based investment system. Study the companies on the CANSLIM.net Featured Stocks Page - a page showing the most action-worthy candidates' latest notes and links to additional resources including detailed analysis with data-packed graphs which are annotated by a Certified expert. The Premium Member Homepage - includes "dynamic archives" to all prior pay reports published. Watch for an announcement via email concerning the next WEBCAST.
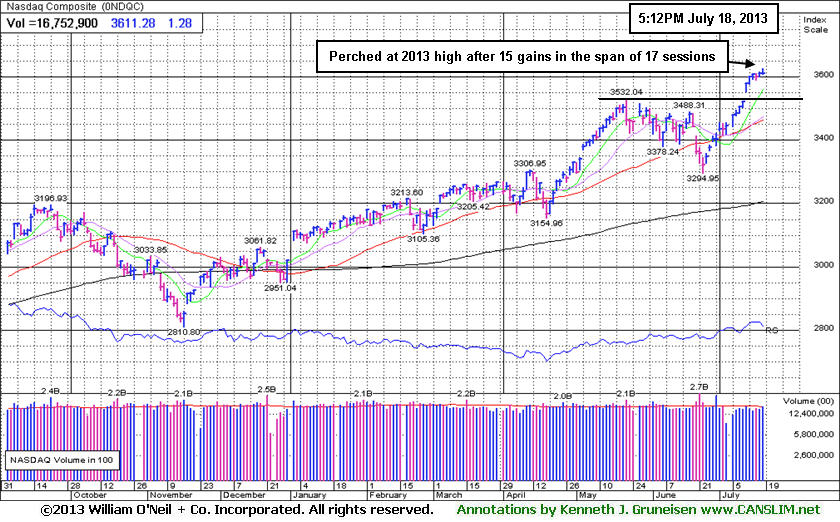
PICTURED: The Nasdaq Composite Index is perched at a new 2013 high after posting 15 gains in the span of 17 sessions. The tech-heavy index is up +19.6% year-to-date.
|
 Kenneth J. Gruneisen started out as a licensed stockbroker in August 1987, a couple of months prior to the historic stock market crash that took the Dow Jones Industrial Average down -22.6% in a single day. He has published daily fact-based fundamental and technical analysis on high-ranked stocks online for two decades. Through FACTBASEDINVESTING.COM, Kenneth provides educational articles, news, market commentary, and other information regarding proven investment systems that work in good times and bad.
Comments contained in the body of this report are technical opinions only and are not necessarily those of Gruneisen Growth Corp. The material herein has been obtained from sources believed to be reliable and accurate, however, its accuracy and completeness cannot be guaranteed. Our firm, employees, and customers may effect transactions, including transactions contrary to any recommendation herein, or have positions in the securities mentioned herein or options with respect thereto. Any recommendation contained in this report may not be suitable for all investors and it is not to be deemed an offer or solicitation on our part with respect to the purchase or sale of any securities. |
|
 |
Financial, Healthcare, and Energy-Related Groups Rose
Kenneth J. Gruneisen - Passed the CAN SLIM® Master's Exam
Financial shares underpinned the major averages' rally as the Bank Index ($BKX +1.73%) and the Broker/Dealer Index ($XBD +1.27%) posted solid gains. The Healthcare Index ($HMO +3.06%) was a standout gainer while gains in energy-related also shares boosted the Oil Services Index ($OSX +1.32%) and the Integrated Oil Index ($XOI +0.61%). The tech sector was mixed as the Networking Index ($NWX +0.97%) rose and the Internet Index ($IIX +0.11%) eked out a small gain, but the Semiconductor Index ($SOX -0.89%) and the Biotechnology Index ($BTK -0.32%) created a drag. The Retail Index ($RLX -0.32%) also edged lower and the Gold & Silver Index ($XAU -0.13%) finished with a small loss.
Charts courtesy www.stockcharts.com
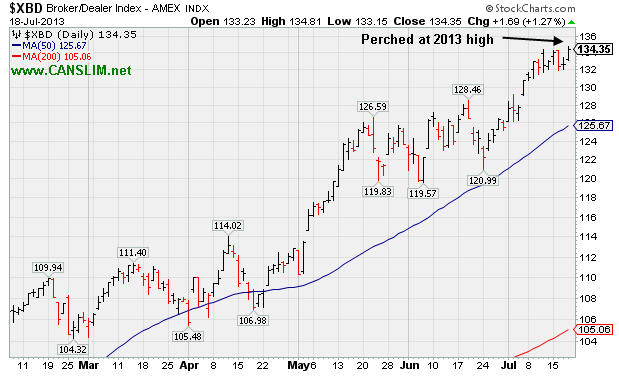
PICTURED: The Broker/Dealer Index ($XBD +1.27%) is perched at its 2013 high. Long time reader of this commentary recognize that leadership from the financial groups is a very reassuring sign for the broader market outlook, because financial shares have a history of being a reliable "leading indicator".
| Oil Services |
$OSX |
268.65 |
+3.50 |
+1.32% |
+22.02% |
| Healthcare |
$HMO |
3,396.91 |
+100.74 |
+3.06% |
+35.11% |
| Integrated Oil |
$XOI |
1,389.99 |
+8.49 |
+0.61% |
+11.93% |
| Semiconductor |
$SOX |
487.22 |
-4.36 |
-0.89% |
+26.86% |
| Networking |
$NWX |
280.83 |
+2.69 |
+0.97% |
+23.96% |
| Internet |
$IIX |
407.38 |
+0.45 |
+0.11% |
+24.58% |
| Broker/Dealer |
$XBD |
134.35 |
+1.69 |
+1.27% |
+42.43% |
| Retail |
$RLX |
838.17 |
-2.72 |
-0.32% |
+28.35% |
| Gold & Silver |
$XAU |
91.38 |
-0.12 |
-0.13% |
-44.82% |
| Bank |
$BKX |
65.86 |
+1.12 |
+1.73% |
+28.43% |
| Biotech |
$BTK |
2,157.97 |
-7.01 |
-0.32% |
+39.49% |
|
|
|
 |
Volume Totals Cooling During Consolidation
Kenneth J. Gruneisen - Passed the CAN SLIM® Master's Exam
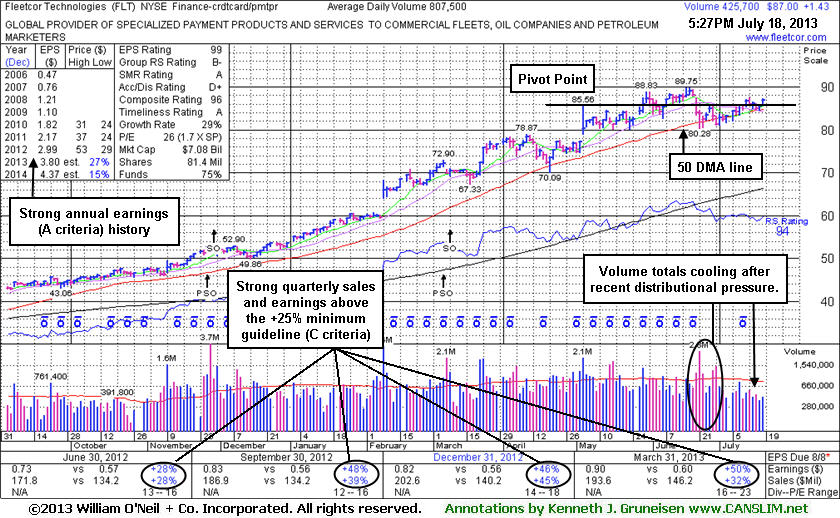
FleetCor Technologies, Inc. (FLT +$1.43 or +1.67% to $87.00) recently found support near its 50-day moving average (DMA) line while enduring distributional pressure. The prior low ($80.28 on 6/21/13) defines the next important near-term support below its short-term average where damaging violations would raise concerns and trigger technical sell signals. It was last shown in the FSU section on 6/28/13 with an annotated graph under the headline, "Distributional Action Leads to Slump Below 50-Day Average". Subsequent gains halted its slide but lacked great volume conviction while it made a stand at the 50 DMA line. Disciplined investors always limit losses by selling any stock that falls more than -7% from their purchase price.
It reported earnings +50% on +32% sales for the Mar '13 quarter, marking its 5th consecutive quarterly comparison with earnings above the +25% guideline (C criteria). Little resistance remains due to overhead supply. The company completed another Secondary Offering on 3/08/13 after a streak of volume-driven gains into new high territory. On 3/14/12, 6/11/12, and 11/29/12 it priced Secondary Offerings and it was previously noted, "Such offerings often are a short-term hindrance to upward price progress yet typically result in broader institutional ownership interest."
The number of top-rated funds owning its shares rose from 193 in Mar '12 to 391 in Jun '13, a reassuring sign concerning the I criteria. The company hails from the Finance - Credit Card Payment Processing group which currently has a mediocre 55 Group Relative Strength Rating, however impressive strength and leadership from a couple of other firms in the same industry group is considered sufficient reassurance concerning the L criteria.
|
|
|
Color Codes Explained :
Y - Better candidates highlighted by our
staff of experts.
G - Previously featured
in past reports as yellow but may no longer be buyable under the
guidelines.
***Last / Change / Volume data in this table is the closing quote data***
Symbol/Exchange
Company Name
Industry Group |
PRICE |
CHANGE
(%Change) |
Day High |
Volume
(% DAV)
(% 50 day avg vol) |
52 Wk Hi
% From Hi |
Featured
Date |
Price
Featured |
Pivot Featured |
|
Max Buy |
AMBA
-
NASDAQ
Ambarella Inc
ELECTRONICS - Semiconductor - Specialized
|
$18.59
|
-0.65
-3.38% |
$19.44
|
1,622,822
133.02% of 50 DAV
50 DAV is 1,220,000
|
$19.30
-3.68%
|
7/15/2013
|
$17.87
|
PP = $18.68
|
|
MB = $19.61
|
 Most Recent Note - 7/18/2013 12:28:44 PM
Y - Reversed into the red after early gains into new high territory today. On the prior session it broke out from its latest base pattern with +65% above average volume triggering a new (or add-on) technical buy signal. See the latest FSU analysis for more details and a new annotated graph.
>>> The latest Featured Stock Update with an annotated graph appeared on 7/17/2013. Click here.
View all notes |
Alert me of new notes |
CANSLIM.net Company Profile |
SEC |
Zacks Reports |
StockTalk |
News |
Chart |
Request a new note
C
A N
S L
I M


|
CELG
-
NASDAQ
Celgene Corp
DRUGS - Drug Manufacturers - Major
|
$133.05
|
-3.56
-2.61% |
$133.94
|
5,577,541
188.44% of 50 DAV
50 DAV is 2,959,900
|
$137.80
-3.45%
|
7/11/2013
|
$133.25
|
PP = $131.92
|
|
MB = $138.52
|
Most Recent Note - 7/18/2013 12:40:33 PM
Y - Up from earlier lows after a small gap down today. Prior highs define initial support to watch. Breakaway gap and solid gain with twice average volume on 7/11/13 triggered a technical buy signal. Disciplined investors always limit losses by selling if any stock falls more than -7% from their purchase price.
>>> The latest Featured Stock Update with an annotated graph appeared on 7/11/2013. Click here.
View all notes |
Alert me of new notes |
CANSLIM.net Company Profile |
SEC |
Zacks Reports |
StockTalk |
News |
Chart |
Request a new note
C
A N
S L
I M
|
FLT
-
NYSE
Fleetcor Technologies
DIVERSIFIED SERVICES - Business/Management Services
|
$87.00
|
+1.43
1.67% |
$87.30
|
425,783
52.73% of 50 DAV
50 DAV is 807,500
|
$89.75
-3.06%
|
5/29/2013
|
$86.02
|
PP = $85.66
|
|
MB = $89.94
|
Most Recent Note - 7/18/2013 5:51:55 PM
G- Recently found support near its 50 DMA line with gains lacking volume conviction. Prior low ($80.28 on 6/21/13) defines the next important near-term support where a violation would raise more serious concerns. See the latest FSU analysis for more details and a new annotated graph.
>>> The latest Featured Stock Update with an annotated graph appeared on 7/18/2013. Click here.
View all notes |
Alert me of new notes |
CANSLIM.net Company Profile |
SEC |
Zacks Reports |
StockTalk |
News |
Chart |
Request a new note
C
A N
S L
I M
|
LOPE
-
NASDAQ
Grand Canyon Education
DIVERSIFIED SERVICES - Education and; Training Services
|
$35.30
|
+0.79
2.29% |
$35.63
|
369,725
81.24% of 50 DAV
50 DAV is 455,100
|
$36.45
-3.16%
|
6/19/2013
|
$31.47
|
PP = $34.17
|
|
MB = $35.88
|
Most Recent Note - 7/15/2013 6:56:54 PM
G - Inched further above its "max buy" level with today's 6th consecutive gain into new 52-week high territory. Volume-driven gains last week triggered a new technical buy signal. Prior highs in the $34 area define initial support above its 50 DMA line.
>>> The latest Featured Stock Update with an annotated graph appeared on 7/2/2013. Click here.
View all notes |
Alert me of new notes |
CANSLIM.net Company Profile |
SEC |
Zacks Reports |
StockTalk |
News |
Chart |
Request a new note
C
A N
S L
I M
|
PCLN
-
NASDAQ
Priceline.Com Inc
INTERNET - Internet Software and Services
|
$899.60
|
-7.08
-0.78% |
$904.00
|
501,646
67.11% of 50 DAV
50 DAV is 747,500
|
$926.40
-2.89%
|
7/8/2013
|
$878.28
|
PP = $847.43
|
|
MB = $889.80
|
Most Recent Note - 7/12/2013 6:17:28 PM
G - Posted its 12th gain in the span of 13 sessions getting very extended from its prior base. Prior highs in the $847 area define initial support to watch on pullbacks.
>>> The latest Featured Stock Update with an annotated graph appeared on 7/9/2013. Click here.
View all notes |
Alert me of new notes |
CANSLIM.net Company Profile |
SEC |
Zacks Reports |
StockTalk |
News |
Chart |
Request a new note
C
A N
S L
I M
|
Symbol/Exchange
Company Name
Industry Group |
PRICE |
CHANGE
(%Change) |
Day High |
Volume
(% DAV)
(% 50 day avg vol) |
52 Wk Hi
% From Hi |
Featured
Date |
Price
Featured |
Pivot Featured |
|
Max Buy |
PRLB
-
NYSE
Proto Labs Inc
MANUFACTURING - Small Tools and Accessories
|
$64.56
|
+0.13
0.20% |
$64.95
|
245,322
54.75% of 50 DAV
50 DAV is 448,100
|
$67.40
-4.21%
|
6/17/2013
|
$59.37
|
PP = $59.94
|
|
MB = $62.94
|
Most Recent Note - 7/17/2013 6:39:58 PM
G - Small gap up gain today on light volume. Still holding its ground in a tight rage with volume totals cooling following a "negative reversal" on 6/28/13 with heavy volume. Prior highs near $59 coincide with its 50 DMA line defining important support.
>>> The latest Featured Stock Update with an annotated graph appeared on 7/15/2013. Click here.
View all notes |
Alert me of new notes |
CANSLIM.net Company Profile |
SEC |
Zacks Reports |
StockTalk |
News |
Chart |
Request a new note
C
A N
S L
I M
|
RRTS
-
NYSE
Roadrunner Trans Systems
TRANSPORTATION - Air Delivery and Freight Service
|
$29.83
|
+0.41
1.39% |
$29.98
|
54,249
31.95% of 50 DAV
50 DAV is 169,800
|
$30.50
-2.20%
|
4/3/2013
|
$22.77
|
PP = $23.75
|
|
MB = $24.94
|
Most Recent Note - 7/15/2013 6:53:03 PM
G - Wedged higher without great volume conviction after finding support above its 50 DMA line, and it is perched at its 52-week high extended from any sound base.
>>> The latest Featured Stock Update with an annotated graph appeared on 7/3/2013. Click here.
View all notes |
Alert me of new notes |
CANSLIM.net Company Profile |
SEC |
Zacks Reports |
StockTalk |
News |
Chart |
Request a new note
C
A N
S L
I M
|
SFUN
-
NYSE
Soufun Hldgs Ltd Ads A
INTERNET - Internet Information Providers
|
$31.55
|
-0.25
-0.79% |
$32.27
|
318,751
98.68% of 50 DAV
50 DAV is 323,000
|
$33.03
-4.48%
|
7/16/2013
|
$29.54
|
PP = $27.90
|
|
MB = $29.30
|
Most Recent Note - 7/17/2013 1:13:21 PM
G - Pulling back today with a volume-driven loss. Prior highs in the $28-29 area define initial support to watch. Color code was changed to green after quickly getting extended from its latest base. Considerable gain backed by 5 times average volume triggered a technical buy signal and it finished strong after highlighted in yellow with pivot point cited based on its 5/28/13 high plus 10 cents with the annotated daily graph below included in the 7/16/13 mid-day report. See the latest FSU analysis for more details plus an annotated weekly graph.

>>> The latest Featured Stock Update with an annotated graph appeared on 7/16/2013. Click here.
View all notes |
Alert me of new notes |
CANSLIM.net Company Profile |
SEC |
Zacks Reports |
StockTalk |
News |
Chart |
Request a new note
C
A N
S L
I M
|
SSNC
-
NASDAQ
S S & C Technologies
COMPUTER SOFTWARE and SERVICES - Application Software
|
$36.87
|
+0.01
0.03% |
$37.16
|
182,237
38.84% of 50 DAV
50 DAV is 469,200
|
$38.47
-4.16%
|
7/11/2013
|
$35.80
|
PP = $34.54
|
|
MB = $36.27
|
Most Recent Note - 7/12/2013 6:11:49 PM
G - Rallied above its "max buy" level and its color code was changed to green. Cleared the pivot point based on its 5/08/13 high plus 10 cents cited in the 7/11/13 mid-day report (read here) and triggered a technical buy signal while rising from an orderly base with a considerable gain backed by +124% above average volume. See the latest FSU analysis for more details and a new annotated graph.
>>> The latest Featured Stock Update with an annotated graph appeared on 7/12/2013. Click here.
View all notes |
Alert me of new notes |
CANSLIM.net Company Profile |
SEC |
Zacks Reports |
StockTalk |
News |
Chart |
Request a new note
C
A N
S L
I M
|
SSYS
-
NASDAQ
Stratasys Ltd
COMPUTER HARDWARE - Computer Peripherals
|
$89.54
|
-1.55
-1.70% |
$91.95
|
517,742
60.74% of 50 DAV
50 DAV is 852,400
|
$96.44
-7.15%
|
7/8/2013
|
$91.44
|
PP = $95.00
|
|
MB = $99.75
|
Most Recent Note - 7/16/2013 3:29:49 PM
Y - Encountering distributional pressure while perched at its 52-week high near previously stubborn resistance. Did not yet rally for a close above the pivot point based on its 5/14/13 high plus 10 cents with sufficient volume to clinch a proper technical buy signal.
>>> The latest Featured Stock Update with an annotated graph appeared on 7/8/2013. Click here.
View all notes |
Alert me of new notes |
CANSLIM.net Company Profile |
SEC |
Zacks Reports |
StockTalk |
News |
Chart |
Request a new note
C
A N
S L
I M
|
Symbol/Exchange
Company Name
Industry Group |
PRICE |
CHANGE
(%Change) |
Day High |
Volume
(% DAV)
(% 50 day avg vol) |
52 Wk Hi
% From Hi |
Featured
Date |
Price
Featured |
Pivot Featured |
|
Max Buy |
VRX
-
NYSE
Valeant Pharmaceuticals
DRUGS - Drug Manufacturers - Other
|
$91.39
|
-0.06
-0.07% |
$92.08
|
923,962
45.01% of 50 DAV
50 DAV is 2,052,800
|
$96.25
-5.05%
|
4/30/2013
|
$60.24
|
PP = $76.66
|
|
MB = $80.49
|
Most Recent Note - 7/12/2013 6:20:00 PM
G- Wedged to a new high close with today's 3rd consecutive gain lacking great volume conviction. Completed a new Public Offering on 6/18/13 following recent M&A news. Concerns were raised by its sub par Mar '13 earnings report.
>>> The latest Featured Stock Update with an annotated graph appeared on 7/5/2013. Click here.
View all notes |
Alert me of new notes |
CANSLIM.net Company Profile |
SEC |
Zacks Reports |
StockTalk |
News |
Chart |
Request a new note
C
A N
S L
I M
|
YNDX
-
NASDAQ
Yandex N V Class A
INTERNET - Internet Information Providers
|
$30.86
|
-0.20
-0.64% |
$31.03
|
2,659,645
110.46% of 50 DAV
50 DAV is 2,407,700
|
$31.24
-1.22%
|
7/10/2013
|
$29.29
|
PP = $29.59
|
|
MB = $31.07
|
Most Recent Note - 7/17/2013 6:42:03 PM
Y - Posted a solid gain today for a new high close following a bout of distribution on the prior session. Found prompt support near prior highs in the $28-29 area defining initial support to watch on pullbacks.
>>> The latest Featured Stock Update with an annotated graph appeared on 7/10/2013. Click here.
View all notes |
Alert me of new notes |
CANSLIM.net Company Profile |
SEC |
Zacks Reports |
StockTalk |
News |
Chart |
Request a new note
C
A N
S L
I M
|
|
|
|
THESE ARE NOT BUY RECOMMENDATIONS!
Comments contained in the body of this report are technical
opinions only. The material herein has been obtained
from sources believed to be reliable and accurate, however,
its accuracy and completeness cannot be guaranteed.
This site is not an investment advisor, hence it does
not endorse or recommend any securities or other investments.
Any recommendation contained in this report may not
be suitable for all investors and it is not to be deemed
an offer or solicitation on our part with respect to
the purchase or sale of any securities. All trademarks,
service marks and trade names appearing in this report
are the property of their respective owners, and are
likewise used for identification purposes only.
This report is a service available
only to active Paid Premium Members.
You may opt-out of receiving report notifications
at any time. Questions or comments may be submitted
by writing to Premium Membership Services 665 S.E. 10 Street, Suite 201 Deerfield Beach, FL 33441-5634 or by calling 1-800-965-8307
or 954-785-1121.
|
|
|

