You are not logged in.
This means you
CAN ONLY VIEW reports that were published prior to Monday, April 14, 2025.
You
MUST UPGRADE YOUR MEMBERSHIP if you want to see any current reports.
AFTER MARKET UPDATE - TUESDAY, JULY 16TH, 2013
Previous After Market Report Next After Market Report >>>
|
|
|
|
DOW |
-32.41 |
15,451.85 |
-0.21% |
|
Volume |
617,075,050 |
+9% |
|
Volume |
1,522,129,620 |
+9% |
|
NASDAQ |
-8.99 |
3,598.50 |
-0.25% |
|
Advancers |
1,046 |
34% |
|
Advancers |
1,107 |
43% |
|
S&P 500 |
-6.24 |
1,676.26 |
-0.37% |
|
Decliners |
1,944 |
63% |
|
Decliners |
1,360 |
52% |
|
Russell 2000 |
-4.55 |
1,038.75 |
-0.44% |
|
52 Wk Highs |
178 |
|
|
52 Wk Highs |
252 |
|
|
S&P 600 |
-2.26 |
584.15 |
-0.39% |
|
52 Wk Lows |
20 |
|
|
52 Wk Lows |
13 |
|
|
 |
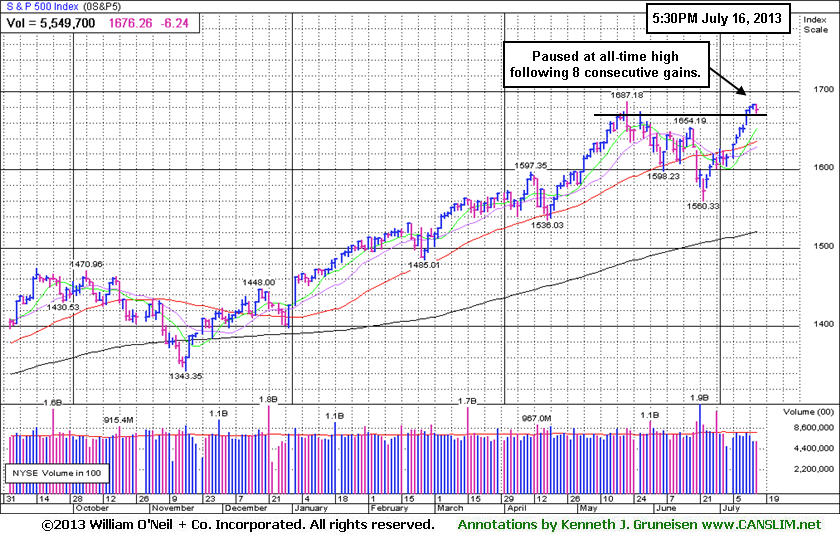
S&P 500 Index Pauses at All-Time High After 8 Consecutive Gains
Kenneth J. Gruneisen - Passed the CAN SLIM® Master's Exam
The S&P 500 Index snapped its eight-day winning streak as it fell 7 points to 1,675. Volume totals rose behind Tuesday's losses versus the prior session volume totals on the NYSE and on the Nasdaq exchange, a sign of distributional pressure. Breadth was negative as decliners led advancers by almost a 2-1 margin on the NYSE and by a narrower 7-6 margin on the Nasdaq exchange. There were 68 high-ranked companies from the CANSLIM.net Leaders List made new 52-week highs and appeared on the CANSLIM.net BreakOuts Page, down from the prior session total of 121 stocks. The list of stocks hitting new 52-week highs contracted yet easily outnumbered new 52-week lows on both the NYSE and the Nasdaq exchange. There were losses for 10 of the 12 high-ranked companies currently included on the Featured Stocks Page.
The major averages retreated as investors reacted to hawkish Fed comments in addition to mixed economic data and earnings results. Kansas City Fed President George said cuts to the pace of the central bank's stimulus measures are appropriate given economic improvements. On the data front, for June the consumer price index rose the most since February amid a jump in gasoline prices. Industrial production rebounded in June +0.3% matching expectations for the best reading in four months, and a separate report showed homebuilder confidence increased in July to a seven-year high.
Overall, nearly every sector finished lower. Energy paced the decline as Marathon Petroleum Corp (MPC -4.34%). Materials also lagged behind, led lower by Mosaic Co (MOS -3.58%) after posting a disappointing profit tally. The Coca-Cola Company (KO -1.90%) also delivered weak earnings results, causing its shares to fall. The Goldman Sachs Group Inc (GS -1.69%) Earnings will stay in focus with notable reports out after the close from Yahoo! Inc (YHOO -1.68%) and CSX Corp (CSX +1.23%).
In fixed-income, Treasuries finished little changed. The 10-year note was up 1/32 to yield 2.53% and the 30-year bond gained 5/32 to yield 3.58%.
The market (M criteria) has flashed substantial strength and leadership on Thursday's session, making a favorable shift. Now in a confirmed rally, odds are considered favorable for investors' success with new buying efforts. Investors who have preserved their cash and confidence will be disciplined and selective while looking to be proactive and focused exclusively on the individual leaders best matching the winning models of the fact-based investment system. Study the companies on the CANSLIM.net Featured Stocks Page - a page showing the most action-worthy candidates' latest notes and links to additional resources including detailed analysis with data-packed graphs which are annotated by a Certified expert. The Premium Member Homepage - includes "dynamic archives" to all prior pay reports published. Watch for an announcement via email concerning the next WEBCAST.
PICTURED: The S&P 500 Index edged lower breaking a streak of 8 consecutive gains after rallying into new all-time high territory. The benchmark index is up +17.5% year-to-date.
|
 Kenneth J. Gruneisen started out as a licensed stockbroker in August 1987, a couple of months prior to the historic stock market crash that took the Dow Jones Industrial Average down -22.6% in a single day. He has published daily fact-based fundamental and technical analysis on high-ranked stocks online for two decades. Through FACTBASEDINVESTING.COM, Kenneth provides educational articles, news, market commentary, and other information regarding proven investment systems that work in good times and bad.
Comments contained in the body of this report are technical opinions only and are not necessarily those of Gruneisen Growth Corp. The material herein has been obtained from sources believed to be reliable and accurate, however, its accuracy and completeness cannot be guaranteed. Our firm, employees, and customers may effect transactions, including transactions contrary to any recommendation herein, or have positions in the securities mentioned herein or options with respect thereto. Any recommendation contained in this report may not be suitable for all investors and it is not to be deemed an offer or solicitation on our part with respect to the purchase or sale of any securities. |
|
 |
Gold & Silver Index Rallied Amid Broader Weakness
Kenneth J. Gruneisen - Passed the CAN SLIM® Master's Exam
The Gold & Silver Index ($XAU +5.02%) was a standout gainer while weakness in the Broker/Dealer Index ($XBD -1.23%) and Bank Index ($BKX -0.80%) created a drag on the major averages Tuesday. Energy-related shares edged lower and the Oil Services Index ($OSX -1.06%) and the Integrated Oil Index ($XOI -0.48%) lost ground. The Healthcare Index ($HMO -0.43%) and Retail Index ($RLX -0.34%) both finished with small losses. The tech sector also saw losses from the Biotechnology Index ($BTK -1.02%), Networking Index ($NWX -0.48%), and the Internet Index ($IIX -0.18%) while the Semiconductor Index ($SOX +0.35%) eked out a small gain.
Charts courtesy www.stockcharts.com
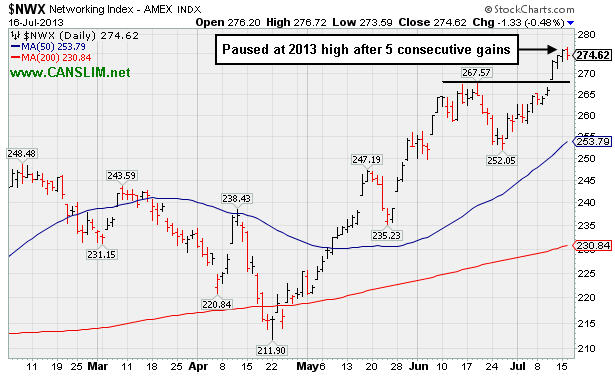
PICTURED: The Networking Index ($NWX -0.48%) paused at its 2013 high with a small loss after 5 consecutive gains.
| Oil Services |
$OSX |
263.53 |
-2.81 |
-1.06% |
+19.70% |
| Healthcare |
$HMO |
3,310.23 |
-14.42 |
-0.43% |
+31.66% |
| Integrated Oil |
$XOI |
1,374.10 |
-6.58 |
-0.48% |
+10.65% |
| Semiconductor |
$SOX |
491.06 |
+1.73 |
+0.35% |
+27.86% |
| Networking |
$NWX |
274.62 |
-1.33 |
-0.48% |
+21.22% |
| Internet |
$IIX |
402.68 |
-0.71 |
-0.18% |
+23.14% |
| Broker/Dealer |
$XBD |
132.35 |
-1.64 |
-1.23% |
+40.31% |
| Retail |
$RLX |
838.32 |
-2.85 |
-0.34% |
+28.37% |
| Gold & Silver |
$XAU |
93.99 |
+4.49 |
+5.02% |
-43.24% |
| Bank |
$BKX |
64.33 |
-0.52 |
-0.80% |
+25.45% |
| Biotech |
$BTK |
2,159.27 |
-22.26 |
-1.02% |
+39.58% |
|
|
|
 |
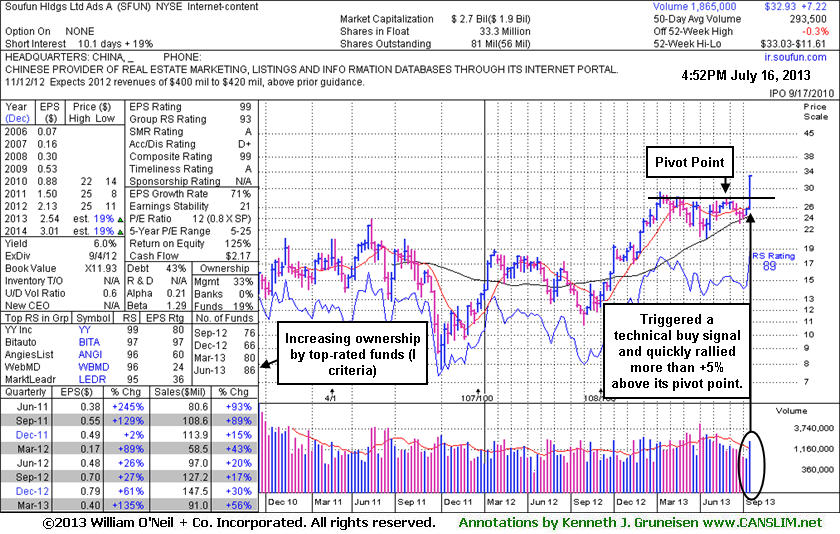
Finished Session With Large Breakout Gain on 5 Times Average Volume
Kenneth J. Gruneisen - Passed the CAN SLIM® Master's Exam
Soufun Hldgs Ltd Ads (SFUN +$5.33 or +19.31% to $32.93) was highlighted in yellow with new pivot point cited based on its 5/28/13 high plus 10 cents in the earlier mid-day report (read here). It spiked to new 52-week and all-time highs clinching a technical buy signal. It finished strong with a considerable gain backed by more than 5 times average volume as it blasted above its pivot point and quickly rallied above its "max buy" level. Prior highs in the $28-29 area define initial support to watch on pullbacks. It found support at its 200-day moving average (DMA) line during its long consolidation after dropped from the Featured Stocks list on 3/08/13. Fundamentals remained strong as it reported +135% earnings on +56% sales revenues for the Mar '13 quarter versus the year ago period. The number of top-rated funds owning its shares rose from 76 in Sep '12 to 86 in Jun '13, a reassuring sign concerning the I criteria.
Approximately 40% of successful breakouts pull back and test support at their prior highs before continuing higher. Patient and disciplined investors watch out to avoid chasing extended stocks trading more than +5% above their pivot point. They may watch for opportunities to accumulate shares in strong leaders as secondary buy points and new bases possibly form and are noted in the weeks ahead. Keep in mind that during bullish market environments, strong leaders often will present multiple chances to accumulate their shares under the strict guidelines of the fact-based system.
|
|
|
Color Codes Explained :
Y - Better candidates highlighted by our
staff of experts.
G - Previously featured
in past reports as yellow but may no longer be buyable under the
guidelines.
***Last / Change / Volume data in this table is the closing quote data***
Symbol/Exchange
Company Name
Industry Group |
PRICE |
CHANGE
(%Change) |
Day High |
Volume
(% DAV)
(% 50 day avg vol) |
52 Wk Hi
% From Hi |
Featured
Date |
Price
Featured |
Pivot Featured |
|
Max Buy |
AMBA
-
NASDAQ
Ambarella Inc
ELECTRONICS - Semiconductor - Specialized
|
$17.65
|
-0.22
-1.23% |
$18.04
|
713,942
59.37% of 50 DAV
50 DAV is 1,202,500
|
$18.58
-5.01%
|
7/15/2013
|
$17.87
|
PP = $18.68
|
|
MB = $19.61
|
Most Recent Note - 7/15/2013 7:01:37 PM
Y - New pivot point is cited based on its 6/18/13 high and its color code is changed to yellow. It is forming a short "square box" base pattern and consolidating in a healthy fashion above its 50 DMA line. Subsequent volume-driven gains to new highs may trigger a new (or add-on) technical buy signal.
>>> The latest Featured Stock Update with an annotated graph appeared on 6/27/2013. Click here.
View all notes |
Alert me of new notes |
CANSLIM.net Company Profile |
SEC |
Zacks Reports |
StockTalk |
News |
Chart |
Request a new note
C
A N
S L
I M


|
CELG
-
NASDAQ
Celgene Corp
DRUGS - Drug Manufacturers - Major
|
$135.06
|
+0.12
0.09% |
$135.50
|
2,580,397
86.72% of 50 DAV
50 DAV is 2,975,500
|
$136.36
-0.96%
|
7/11/2013
|
$133.25
|
PP = $131.92
|
|
MB = $138.52
|
Most Recent Note - 7/12/2013 6:21:32 PM
Y - Held its ground today. Breakaway gap and solid gain with twice average volume triggered a technical buy signal on the prior session as it finished above the new pivot point cited based on its 5/14/13 high plus 10 cents. See the latest FSU analysis for more details and an annotated graph.
>>> The latest Featured Stock Update with an annotated graph appeared on 7/11/2013. Click here.
View all notes |
Alert me of new notes |
CANSLIM.net Company Profile |
SEC |
Zacks Reports |
StockTalk |
News |
Chart |
Request a new note
C
A N
S L
I M
|
FLT
-
NYSE
Fleetcor Technologies
DIVERSIFIED SERVICES - Business/Management Services
|
$84.94
|
-1.19
-1.38% |
$86.19
|
464,537
54.36% of 50 DAV
50 DAV is 854,600
|
$89.75
-5.36%
|
5/29/2013
|
$86.02
|
PP = $85.66
|
|
MB = $89.94
|
Most Recent Note - 7/15/2013 6:55:34 PM
G- Recently found support near its 50 DMA line. Prior low ($80.28 on 6/21/13) defines the next important near-term support where a violation would raise more serious concerns.
>>> The latest Featured Stock Update with an annotated graph appeared on 6/28/2013. Click here.
View all notes |
Alert me of new notes |
CANSLIM.net Company Profile |
SEC |
Zacks Reports |
StockTalk |
News |
Chart |
Request a new note
C
A N
S L
I M
|
LOPE
-
NASDAQ
Grand Canyon Education
DIVERSIFIED SERVICES - Education and; Training Services
|
$35.26
|
-0.83
-2.30% |
$36.21
|
501,307
113.29% of 50 DAV
50 DAV is 442,500
|
$36.45
-3.26%
|
6/19/2013
|
$31.47
|
PP = $34.17
|
|
MB = $35.88
|
Most Recent Note - 7/15/2013 6:56:54 PM
G - Inched further above its "max buy" level with today's 6th consecutive gain into new 52-week high territory. Volume-driven gains last week triggered a new technical buy signal. Prior highs in the $34 area define initial support above its 50 DMA line.
>>> The latest Featured Stock Update with an annotated graph appeared on 7/2/2013. Click here.
View all notes |
Alert me of new notes |
CANSLIM.net Company Profile |
SEC |
Zacks Reports |
StockTalk |
News |
Chart |
Request a new note
C
A N
S L
I M
|
PCLN
-
NASDAQ
Priceline.Com Inc
INTERNET - Internet Software and Services
|
$902.05
|
-9.61
-1.05% |
$916.12
|
675,115
90.67% of 50 DAV
50 DAV is 744,600
|
$926.40
-2.63%
|
7/8/2013
|
$878.28
|
PP = $847.43
|
|
MB = $889.80
|
Most Recent Note - 7/12/2013 6:17:28 PM
G - Posted its 12th gain in the span of 13 sessions getting very extended from its prior base. Prior highs in the $847 area define initial support to watch on pullbacks.
>>> The latest Featured Stock Update with an annotated graph appeared on 7/9/2013. Click here.
View all notes |
Alert me of new notes |
CANSLIM.net Company Profile |
SEC |
Zacks Reports |
StockTalk |
News |
Chart |
Request a new note
C
A N
S L
I M
|
Symbol/Exchange
Company Name
Industry Group |
PRICE |
CHANGE
(%Change) |
Day High |
Volume
(% DAV)
(% 50 day avg vol) |
52 Wk Hi
% From Hi |
Featured
Date |
Price
Featured |
Pivot Featured |
|
Max Buy |
PRLB
-
NYSE
Proto Labs Inc
MANUFACTURING - Small Tools and Accessories
|
$62.72
|
-1.46
-2.27% |
$64.95
|
632,700
139.48% of 50 DAV
50 DAV is 453,600
|
$67.40
-6.94%
|
6/17/2013
|
$59.37
|
PP = $59.94
|
|
MB = $62.94
|
Most Recent Note - 7/15/2013 6:46:25 PM
G - Holding its ground in a tight rage with volume totals cooling following a "negative reversal" on 6/28/13 with heavy volume. Prior highs near $59 coincide with its 50 DMA line defining important support. See the latest FSU analysis fore more details and a new annotated graph.
>>> The latest Featured Stock Update with an annotated graph appeared on 7/15/2013. Click here.
View all notes |
Alert me of new notes |
CANSLIM.net Company Profile |
SEC |
Zacks Reports |
StockTalk |
News |
Chart |
Request a new note
C
A N
S L
I M
|
RRTS
-
NYSE
Roadrunner Trans Systems
TRANSPORTATION - Air Delivery and Freight Service
|
$29.73
|
-0.22
-0.73% |
$30.05
|
78,903
43.76% of 50 DAV
50 DAV is 180,300
|
$30.50
-2.52%
|
4/3/2013
|
$22.77
|
PP = $23.75
|
|
MB = $24.94
|
Most Recent Note - 7/15/2013 6:53:03 PM
G - Wedged higher without great volume conviction after finding support above its 50 DMA line, and it is perched at its 52-week high extended from any sound base.
>>> The latest Featured Stock Update with an annotated graph appeared on 7/3/2013. Click here.
View all notes |
Alert me of new notes |
CANSLIM.net Company Profile |
SEC |
Zacks Reports |
StockTalk |
News |
Chart |
Request a new note
C
A N
S L
I M
|
SFUN
-
NYSE
Soufun Hldgs Ltd Ads A
INTERNET - Internet Information Providers
|
$32.93
|
+5.33
19.31% |
$33.03
|
1,513,319
515.61% of 50 DAV
50 DAV is 293,500
|
$29.16
12.93%
|
7/16/2013
|
$29.54
|
PP = $27.90
|
|
MB = $29.30
|
 Most Recent Note - 7/16/2013 5:49:36 PM
G - Color code is changed to green after quickly getting extended from its latest base with a considerable gain backed by 5 times average volume while triggering a technical buy signal. Finished strong after highlighted in yellow with new pivot point cited based on its 5/28/13 high plus 10 cents in the earlier mid-day report with the annotated daily graph included below. See the latest FSU analysis for more details plus an annotated weekly graph.

>>> The latest Featured Stock Update with an annotated graph appeared on 7/16/2013. Click here.
View all notes |
Alert me of new notes |
CANSLIM.net Company Profile |
SEC |
Zacks Reports |
StockTalk |
News |
Chart |
Request a new note
C
A N
S L
I M
|
SSNC
-
NASDAQ
S S & C Technologies
COMPUTER SOFTWARE and SERVICES - Application Software
|
$36.58
|
-0.43
-1.16% |
$37.33
|
562,455
120.13% of 50 DAV
50 DAV is 468,200
|
$38.47
-4.91%
|
7/11/2013
|
$35.80
|
PP = $34.54
|
|
MB = $36.27
|
Most Recent Note - 7/12/2013 6:11:49 PM
G - Rallied above its "max buy" level and its color code was changed to green. Cleared the pivot point based on its 5/08/13 high plus 10 cents cited in the 7/11/13 mid-day report (read here) and triggered a technical buy signal while rising from an orderly base with a considerable gain backed by +124% above average volume. See the latest FSU analysis for more details and a new annotated graph.
>>> The latest Featured Stock Update with an annotated graph appeared on 7/12/2013. Click here.
View all notes |
Alert me of new notes |
CANSLIM.net Company Profile |
SEC |
Zacks Reports |
StockTalk |
News |
Chart |
Request a new note
C
A N
S L
I M
|
SSYS
-
NASDAQ
Stratasys Ltd
COMPUTER HARDWARE - Computer Peripherals
|
$89.42
|
-5.74
-6.03% |
$95.16
|
1,798,840
215.61% of 50 DAV
50 DAV is 834,300
|
$96.44
-7.28%
|
7/8/2013
|
$91.44
|
PP = $95.00
|
|
MB = $99.75
|
Most Recent Note - 7/16/2013 3:29:49 PM
Y - Encountering distributional pressure while perched at its 52-week high near previously stubborn resistance. Did not yet rally for a close above the pivot point based on its 5/14/13 high plus 10 cents with sufficient volume to clinch a proper technical buy signal.
>>> The latest Featured Stock Update with an annotated graph appeared on 7/8/2013. Click here.
View all notes |
Alert me of new notes |
CANSLIM.net Company Profile |
SEC |
Zacks Reports |
StockTalk |
News |
Chart |
Request a new note
C
A N
S L
I M
|
Symbol/Exchange
Company Name
Industry Group |
PRICE |
CHANGE
(%Change) |
Day High |
Volume
(% DAV)
(% 50 day avg vol) |
52 Wk Hi
% From Hi |
Featured
Date |
Price
Featured |
Pivot Featured |
|
Max Buy |
VRX
-
NYSE
Valeant Pharmaceuticals
DRUGS - Drug Manufacturers - Other
|
$91.53
|
-2.27
-2.42% |
$94.22
|
1,547,903
75.97% of 50 DAV
50 DAV is 2,037,500
|
$96.25
-4.90%
|
4/30/2013
|
$60.24
|
PP = $76.66
|
|
MB = $80.49
|
Most Recent Note - 7/12/2013 6:20:00 PM
G- Wedged to a new high close with today's 3rd consecutive gain lacking great volume conviction. Completed a new Public Offering on 6/18/13 following recent M&A news. Concerns were raised by its sub par Mar '13 earnings report.
>>> The latest Featured Stock Update with an annotated graph appeared on 7/5/2013. Click here.
View all notes |
Alert me of new notes |
CANSLIM.net Company Profile |
SEC |
Zacks Reports |
StockTalk |
News |
Chart |
Request a new note
C
A N
S L
I M
|
YNDX
-
NASDAQ
Yandex N V Class A
INTERNET - Internet Information Providers
|
$29.56
|
-1.22
-3.96% |
$30.83
|
3,518,969
148.54% of 50 DAV
50 DAV is 2,369,000
|
$31.24
-5.38%
|
7/10/2013
|
$29.29
|
PP = $29.59
|
|
MB = $31.07
|
Most Recent Note - 7/16/2013 1:41:26 PM
Y - Retreating from its 52-week high following a streak of 7 consecutive gains marked by volume. Prior highs in the $28-29 area define initial support to watch on pullbacks.
>>> The latest Featured Stock Update with an annotated graph appeared on 7/10/2013. Click here.
View all notes |
Alert me of new notes |
CANSLIM.net Company Profile |
SEC |
Zacks Reports |
StockTalk |
News |
Chart |
Request a new note
C
A N
S L
I M
|
|
|
|
THESE ARE NOT BUY RECOMMENDATIONS!
Comments contained in the body of this report are technical
opinions only. The material herein has been obtained
from sources believed to be reliable and accurate, however,
its accuracy and completeness cannot be guaranteed.
This site is not an investment advisor, hence it does
not endorse or recommend any securities or other investments.
Any recommendation contained in this report may not
be suitable for all investors and it is not to be deemed
an offer or solicitation on our part with respect to
the purchase or sale of any securities. All trademarks,
service marks and trade names appearing in this report
are the property of their respective owners, and are
likewise used for identification purposes only.
This report is a service available
only to active Paid Premium Members.
You may opt-out of receiving report notifications
at any time. Questions or comments may be submitted
by writing to Premium Membership Services 665 S.E. 10 Street, Suite 201 Deerfield Beach, FL 33441-5634 or by calling 1-800-965-8307
or 954-785-1121.
|
|
|

