You are not logged in.
This means you
CAN ONLY VIEW reports that were published prior to Thursday, March 13, 2025.
You
MUST UPGRADE YOUR MEMBERSHIP if you want to see any current reports.
AFTER MARKET UPDATE - MONDAY, JULY 15TH, 2013
Previous After Market Report Next After Market Report >>>
|
|
|
|
DOW |
+19.96 |
15,484.26 |
+0.13% |
|
Volume |
566,568,260 |
-17% |
|
Volume |
1,397,992,000 |
-7% |
|
NASDAQ |
+7.41 |
3,607.49 |
+0.21% |
|
Advancers |
1,891 |
61% |
|
Advancers |
1,624 |
63% |
|
S&P 500 |
+2.31 |
1,682.50 |
+0.14% |
|
Decliners |
1,128 |
36% |
|
Decliners |
873 |
34% |
|
Russell 2000 |
+6.78 |
1,043.30 |
+0.65% |
|
52 Wk Highs |
320 |
|
|
52 Wk Highs |
361 |
|
|
S&P 600 |
+2.52 |
586.41 |
+0.43% |
|
52 Wk Lows |
20 |
|
|
52 Wk Lows |
15 |
|
|
 |
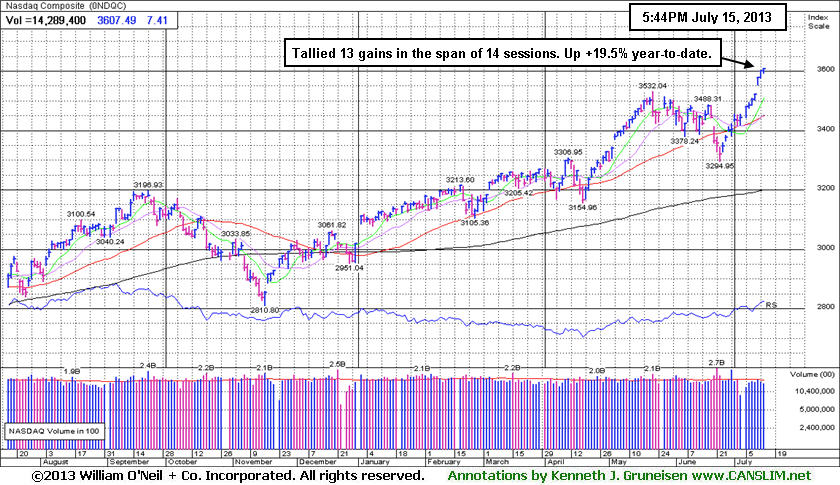
Nasdaq Composite Index Posts 13th Gain in 14 Sessions
Kenneth J. Gruneisen - Passed the CAN SLIM® Master's Exam
Stocks gained minor ground on Monday following the best week since January. The Dow Jones Industrial Average was up over 19 points to 15,484 and the S&P 500 Index gained 2 points to 1,682 as both indices closed at new all-time highs. The Nasdaq Composite Index finished at its best level since October 2000 as it rose 7 points to 3,607. Volume totals cooled behind Monday's small gains, coming in lighter than the prior session volume totals on the NYSE and on the Nasdaq exchange. Breadth was positive as advancers led decliners by a 2-1 margin on the Nasdaq exchange and by a 3-2 margin on the NYSE. There were 121 high-ranked companies from the CANSLIM.net Leaders List made new 52-week highs and appeared on the CANSLIM.net BreakOuts Page, up from the prior session total of 107 stocks. The list of stocks hitting new 52-week highs swelled, easily outnumbering new 52-week lows on both the NYSE and the Nasdaq exchange. There were gains for 10 of the 11 high-ranked companies currently included on the Featured Stocks Page, an encouragingly positive bias versus the broader market.
The major averages managed to close higher despite a weaker-than-expected retail sales report. A pickup in manufacturing helped lift the market as New York area factory sentiment expanded at the fastest pace in five months. The encouraging start to earnings season added to the upside. Citigroup Inc's (C +1.97%) second-quarter profit increased by +42% from a year ago. Earnings season for the major U.S. banks will continue on Tuesday with Goldman Sachs' (GS +1.81%) profit tally due out before the open, in addition to notable reports from The Coca-Cola Company (KO -0.05%) and Johnson & Johnson (JNJ +0.46%).
Overall, most sectors finished higher. Utilities paced the advance as NextEra Energy Inc (NEE + 1.70%) rose. Telecommunications lagged behind led by Verizon Communications Inc (VZ -0.89%) edging lower.
In fixed-income, Treasuries extended last week's rally. The 10-year note was up 11/32 to yield 2.54% and the 30-year bond gained 14/32 to yield 3.60%.
The market (M criteria) has flashed substantial strength and leadership on Thursday's session, making a favorable shift. Now in a confirmed rally, odds are considered favorable for investors' success with new buying efforts. Investors who have preserved their cash and confidence will be disciplined and selective while looking to be proactive and focused exclusively on the individual leaders best matching the winning models of the fact-based investment system. Study the companies on the CANSLIM.net Featured Stocks Page - a page showing the most action-worthy candidates' latest notes and links to additional resources including detailed analysis with data-packed graphs which are annotated by a Certified expert. The Premium Member Homepage - includes "dynamic archives" to all prior pay reports published. Watch for an announcement via email concerning the next WEBCAST.
PICTURED: The Nasdaq Composite Index edged higher for its 13th gain in the span of 14 sessions. The tech-heavy index is up +19.5% year-to-date.
|
 Kenneth J. Gruneisen started out as a licensed stockbroker in August 1987, a couple of months prior to the historic stock market crash that took the Dow Jones Industrial Average down -22.6% in a single day. He has published daily fact-based fundamental and technical analysis on high-ranked stocks online for two decades. Through FACTBASEDINVESTING.COM, Kenneth provides educational articles, news, market commentary, and other information regarding proven investment systems that work in good times and bad.
Comments contained in the body of this report are technical opinions only and are not necessarily those of Gruneisen Growth Corp. The material herein has been obtained from sources believed to be reliable and accurate, however, its accuracy and completeness cannot be guaranteed. Our firm, employees, and customers may effect transactions, including transactions contrary to any recommendation herein, or have positions in the securities mentioned herein or options with respect thereto. Any recommendation contained in this report may not be suitable for all investors and it is not to be deemed an offer or solicitation on our part with respect to the purchase or sale of any securities. |
|
 |
Gains for Financial Groups Helped Major Indices Edge Higher
Kenneth J. Gruneisen - Passed the CAN SLIM® Master's Exam
Financial stocked provided leadership that underpinned the major averages on Monday as the Bank Index ($BKX +0.56%) and the Broker/Dealer Index ($XBD +0.73%) posted modest gains. The Networking Index ($NWX +0.52%) led the tech sector led the tech sector while the Semiconductor Index ($SOX -0.06%) and the Internet Index ($IIX +0.07%) finished flat. The Biotechnology Index ($BTK +0.13%) and the Healthcare Index ($HMO +0.26%) both inched higher. Commodity-linked groups also started the week quietly as Gold & Silver Index ($XAU -0.08%) finished flat while the Oil Services Index ($OSX -0.27%) and Integrated Oil Index ($XOI -0.15%) edged lower. The Retail Index ($RLX -0.16%) broke its 13-session winning streak which was noted on Friday with an annotated graph (read here).
Charts courtesy www.stockcharts.com
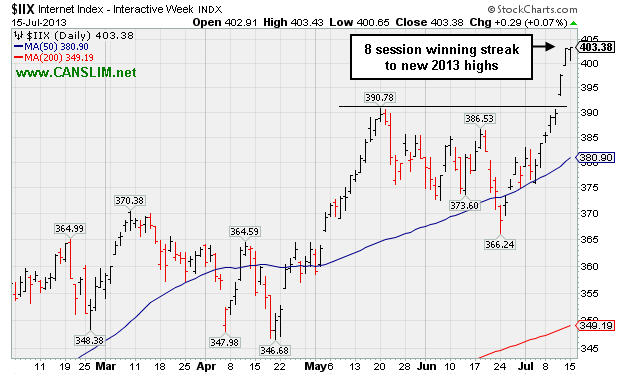
PICTURED: The Internet Index ($IIX +0.07%) extended its winning streak to 8 sessions with Monday's small gain.
| Oil Services |
$OSX |
266.34 |
-0.71 |
-0.27% |
+20.98% |
| Healthcare |
$HMO |
3,324.65 |
+8.50 |
+0.26% |
+32.24% |
| Integrated Oil |
$XOI |
1,380.67 |
-2.01 |
-0.15% |
+11.18% |
| Semiconductor |
$SOX |
489.33 |
-0.28 |
-0.06% |
+27.41% |
| Networking |
$NWX |
275.95 |
+1.43 |
+0.52% |
+21.81% |
| Internet |
$IIX |
403.38 |
+0.29 |
+0.07% |
+23.36% |
| Broker/Dealer |
$XBD |
134.00 |
+0.97 |
+0.73% |
+42.05% |
| Retail |
$RLX |
841.17 |
-1.31 |
-0.16% |
+28.80% |
| Gold & Silver |
$XAU |
89.50 |
-0.07 |
-0.08% |
-45.95% |
| Bank |
$BKX |
64.85 |
+0.36 |
+0.56% |
+26.46% |
| Biotech |
$BTK |
2,181.53 |
+2.85 |
+0.13% |
+41.01% |
|
|
|
 |
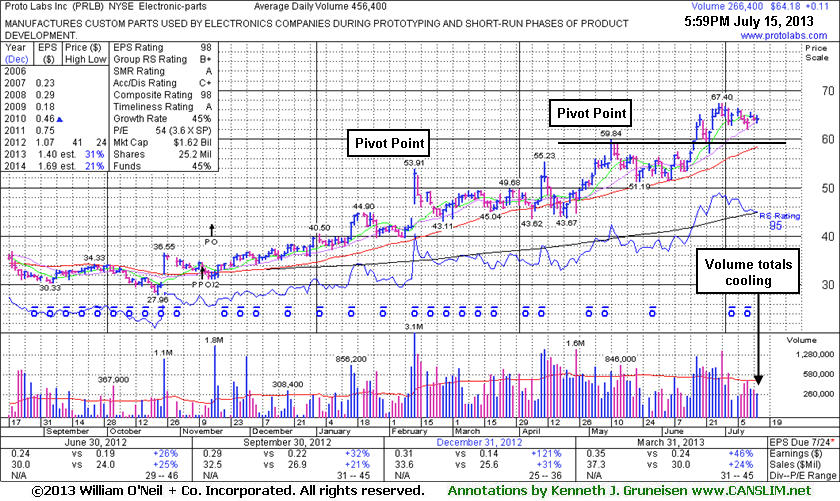
Volume Totals Cooling During Tight Consolidation Near Highs
Kenneth J. Gruneisen - Passed the CAN SLIM® Master's Exam
Proto Labs Inc (PRLB +$0.11 or +0.17% to $64.18) is still holding its ground stubbornly near its 52-week high with volume totals cooling following a "negative reversal" with on 6/28/13 with heavy volume. Prior highs near $59 define near-term support, and those highs closely coincide with its 50-day moving average (DMA) line, a very familiar support level recognized by chart readers.
PRLB may continue to find support prior highs in the $59 area and form a new sound base of greater length. In fact, it may be noted that an advanced "3-weeks tight" base has been formed by the past 3 weekly finishes in close proximity, however no new pivot point has been cited. It made limited progress above its last pivot point while the market was in a "correction". While the major indices have tallied 3 consecutive weekly gains, however, its Relative Strength line slumped. The Relative Strength rating is still a very strong 95. Keep in mind that 3 out of 4 stocks tend to move in the direction of the major averages (M criteria), and favorable action in the broader market currently encourages disciplined investors to make new buying efforts only in stocks within all of the fact-based investment system's guidelines. Disciplined investors always limit losses by selling if any stock falls more than -7% from their purchase price.
It will issue its financial results for the second quarter of 2013 before the opening of the market on Thursday, Aug. 1, 2013. The high-ranked Electronic - Parts firm was last shown in this FSU section with an annotated graph on 6/26/13 under the headline, "Fundamentals and Technical Action Remain Strong". A new pivot point was then cited on 6/17/13, and it subsequently broke out with a considerable volume-driven gain on 6/18/13 triggering a new (or add-on) technical buy signal. It has traded up as much as +34.9% from $49.97 when first featured in yellow in the 4/10/13 mid-day report (read here). Earnings were +46% on +24% sales revenues for the Mar '13 quarter, continuing its strong growth trend satisfying the C criteria and helping it earn a very high 98 Earnings Per Share rank. The number of top-rated funds owning its shares rose from 131 in Jun '12 to 214 in Jun '13, a reassuring trend concerning the I criteria. Its small supply of only 18.9 million shares (S criteria) in the publicly traded float is ideal, yet it can contribute to greater price volatility in the event of institutional buying or selling. Its Up/Down Volume Ratio of 1.2 is another unbiased indication that its shares have been under accumulation over the past 50 days.
 |
|
|
Color Codes Explained :
Y - Better candidates highlighted by our
staff of experts.
G - Previously featured
in past reports as yellow but may no longer be buyable under the
guidelines.
***Last / Change / Volume data in this table is the closing quote data***
Symbol/Exchange
Company Name
Industry Group |
PRICE |
CHANGE
(%Change) |
Day High |
Volume
(% DAV)
(% 50 day avg vol) |
52 Wk Hi
% From Hi |
Featured
Date |
Price
Featured |
Pivot Featured |
|
Max Buy |
AMBA
-
NASDAQ
Ambarella Inc
ELECTRONICS - Semiconductor - Specialized
|
$17.87
|
+0.08
0.45% |
$18.03
|
776,600
65.09% of 50 DAV
50 DAV is 1,193,100
|
$18.58
-3.82%
|
7/15/2013
|
$17.87
|
PP = $18.68
|
|
MB = $19.61
|
 Most Recent Note - 7/15/2013 7:01:37 PM
Y - New pivot point is cited based on its 6/18/13 high and its color code is changed to yellow. It is forming a short "square box" base pattern and consolidating in a healthy fashion above its 50 DMA line. Subsequent volume-driven gains to new highs may trigger a new (or add-on) technical buy signal.
>>> The latest Featured Stock Update with an annotated graph appeared on 6/27/2013. Click here.
View all notes |
Alert me of new notes |
CANSLIM.net Company Profile |
SEC |
Zacks Reports |
StockTalk |
News |
Chart |
Request a new note
C
A N
S L
I M


|
CELG
-
NASDAQ
Celgene Corp
DRUGS - Drug Manufacturers - Major
|
$134.94
|
+0.38
0.28% |
$135.54
|
2,069,087
68.95% of 50 DAV
50 DAV is 3,000,900
|
$136.36
-1.04%
|
7/11/2013
|
$133.25
|
PP = $131.92
|
|
MB = $138.52
|
Most Recent Note - 7/12/2013 6:21:32 PM
Y - Held its ground today. Breakaway gap and solid gain with twice average volume triggered a technical buy signal on the prior session as it finished above the new pivot point cited based on its 5/14/13 high plus 10 cents. See the latest FSU analysis for more details and an annotated graph.
>>> The latest Featured Stock Update with an annotated graph appeared on 7/11/2013. Click here.
View all notes |
Alert me of new notes |
CANSLIM.net Company Profile |
SEC |
Zacks Reports |
StockTalk |
News |
Chart |
Request a new note
C
A N
S L
I M
|
FLT
-
NYSE
Fleetcor Technologies
DIVERSIFIED SERVICES - Business/Management Services
|
$86.13
|
+0.16
0.19% |
$86.53
|
406,548
46.69% of 50 DAV
50 DAV is 870,700
|
$89.75
-4.03%
|
5/29/2013
|
$86.02
|
PP = $85.66
|
|
MB = $89.94
|
Most Recent Note - 7/15/2013 6:55:34 PM
G- Recently found support near its 50 DMA line. Prior low ($80.28 on 6/21/13) defines the next important near-term support where a violation would raise more serious concerns.
>>> The latest Featured Stock Update with an annotated graph appeared on 6/28/2013. Click here.
View all notes |
Alert me of new notes |
CANSLIM.net Company Profile |
SEC |
Zacks Reports |
StockTalk |
News |
Chart |
Request a new note
C
A N
S L
I M
|
LOPE
-
NASDAQ
Grand Canyon Education
DIVERSIFIED SERVICES - Education and; Training Services
|
$36.09
|
+0.15
0.42% |
$36.45
|
466,419
105.76% of 50 DAV
50 DAV is 441,000
|
$36.38
-0.80%
|
6/19/2013
|
$31.47
|
PP = $34.17
|
|
MB = $35.88
|
Most Recent Note - 7/15/2013 6:56:54 PM
G - Inched further above its "max buy" level with today's 6th consecutive gain into new 52-week high territory. Volume-driven gains last week triggered a new technical buy signal. Prior highs in the $34 area define initial support above its 50 DMA line.
>>> The latest Featured Stock Update with an annotated graph appeared on 7/2/2013. Click here.
View all notes |
Alert me of new notes |
CANSLIM.net Company Profile |
SEC |
Zacks Reports |
StockTalk |
News |
Chart |
Request a new note
C
A N
S L
I M
|
PCLN
-
NASDAQ
Priceline.Com Inc
INTERNET - Internet Software and Services
|
$911.66
|
-8.73
-0.95% |
$926.40
|
580,383
77.86% of 50 DAV
50 DAV is 745,400
|
$920.92
-1.01%
|
7/8/2013
|
$878.28
|
PP = $847.43
|
|
MB = $889.80
|
Most Recent Note - 7/12/2013 6:17:28 PM
G - Posted its 12th gain in the span of 13 sessions getting very extended from its prior base. Prior highs in the $847 area define initial support to watch on pullbacks.
>>> The latest Featured Stock Update with an annotated graph appeared on 7/9/2013. Click here.
View all notes |
Alert me of new notes |
CANSLIM.net Company Profile |
SEC |
Zacks Reports |
StockTalk |
News |
Chart |
Request a new note
C
A N
S L
I M
|
Symbol/Exchange
Company Name
Industry Group |
PRICE |
CHANGE
(%Change) |
Day High |
Volume
(% DAV)
(% 50 day avg vol) |
52 Wk Hi
% From Hi |
Featured
Date |
Price
Featured |
Pivot Featured |
|
Max Buy |
PRLB
-
NYSE
Proto Labs Inc
MANUFACTURING - Small Tools and Accessories
|
$64.18
|
+0.11
0.17% |
$64.87
|
266,462
58.38% of 50 DAV
50 DAV is 456,400
|
$67.40
-4.78%
|
6/17/2013
|
$59.37
|
PP = $59.94
|
|
MB = $62.94
|
Most Recent Note - 7/15/2013 6:46:25 PM
G - Holding its ground in a tight rage with volume totals cooling following a "negative reversal" on 6/28/13 with heavy volume. Prior highs near $59 coincide with its 50 DMA line defining important support. See the latest FSU analysis fore more details and a new annotated graph.
>>> The latest Featured Stock Update with an annotated graph appeared on 7/15/2013. Click here.
View all notes |
Alert me of new notes |
CANSLIM.net Company Profile |
SEC |
Zacks Reports |
StockTalk |
News |
Chart |
Request a new note
C
A N
S L
I M
|
RRTS
-
NYSE
Roadrunner Trans Systems
TRANSPORTATION - Air Delivery and Freight Service
|
$29.95
|
+0.17
0.57% |
$30.24
|
74,033
35.90% of 50 DAV
50 DAV is 206,200
|
$30.50
-1.80%
|
4/3/2013
|
$22.77
|
PP = $23.75
|
|
MB = $24.94
|
Most Recent Note - 7/15/2013 6:53:03 PM
G - Wedged higher without great volume conviction after finding support above its 50 DMA line, and it is perched at its 52-week high extended from any sound base.
>>> The latest Featured Stock Update with an annotated graph appeared on 7/3/2013. Click here.
View all notes |
Alert me of new notes |
CANSLIM.net Company Profile |
SEC |
Zacks Reports |
StockTalk |
News |
Chart |
Request a new note
C
A N
S L
I M
|
SSNC
-
NASDAQ
S S & C Technologies
COMPUTER SOFTWARE and SERVICES - Application Software
|
$37.01
|
+0.04
0.11% |
$38.47
|
424,872
91.33% of 50 DAV
50 DAV is 465,200
|
$37.72
-1.88%
|
7/11/2013
|
$35.80
|
PP = $34.54
|
|
MB = $36.27
|
Most Recent Note - 7/12/2013 6:11:49 PM
G - Rallied above its "max buy" level and its color code was changed to green. Cleared the pivot point based on its 5/08/13 high plus 10 cents cited in the 7/11/13 mid-day report (read here) and triggered a technical buy signal while rising from an orderly base with a considerable gain backed by +124% above average volume. See the latest FSU analysis for more details and a new annotated graph.
>>> The latest Featured Stock Update with an annotated graph appeared on 7/12/2013. Click here.
View all notes |
Alert me of new notes |
CANSLIM.net Company Profile |
SEC |
Zacks Reports |
StockTalk |
News |
Chart |
Request a new note
C
A N
S L
I M
|
SSYS
-
NASDAQ
Stratasys Ltd
COMPUTER HARDWARE - Computer Peripherals
|
$95.16
|
+2.84
3.08% |
$96.44
|
788,440
95.21% of 50 DAV
50 DAV is 828,100
|
$95.75
-0.62%
|
7/8/2013
|
$91.44
|
PP = $95.00
|
|
MB = $99.75
|
Most Recent Note - 7/15/2013 6:51:19 PM
Y - No resistance remains while it wedged to a new 52-week high without great volume conviction and inched above its pivot point. Repeatedly noted - "Subsequent volume-driven gains above the pivot point based on its 5/14/13 high plus 10 cents may trigger a technical buy signal."
>>> The latest Featured Stock Update with an annotated graph appeared on 7/8/2013. Click here.
View all notes |
Alert me of new notes |
CANSLIM.net Company Profile |
SEC |
Zacks Reports |
StockTalk |
News |
Chart |
Request a new note
C
A N
S L
I M
|
VRX
-
NYSE
Valeant Pharmaceuticals
DRUGS - Drug Manufacturers - Other
|
$93.80
|
+0.90
0.97% |
$93.84
|
1,568,770
76.80% of 50 DAV
50 DAV is 2,042,800
|
$96.25
-2.55%
|
4/30/2013
|
$60.24
|
PP = $76.66
|
|
MB = $80.49
|
Most Recent Note - 7/12/2013 6:20:00 PM
G- Wedged to a new high close with today's 3rd consecutive gain lacking great volume conviction. Completed a new Public Offering on 6/18/13 following recent M&A news. Concerns were raised by its sub par Mar '13 earnings report.
>>> The latest Featured Stock Update with an annotated graph appeared on 7/5/2013. Click here.
View all notes |
Alert me of new notes |
CANSLIM.net Company Profile |
SEC |
Zacks Reports |
StockTalk |
News |
Chart |
Request a new note
C
A N
S L
I M
|
Symbol/Exchange
Company Name
Industry Group |
PRICE |
CHANGE
(%Change) |
Day High |
Volume
(% DAV)
(% 50 day avg vol) |
52 Wk Hi
% From Hi |
Featured
Date |
Price
Featured |
Pivot Featured |
|
Max Buy |
YNDX
-
NASDAQ
Yandex N V Class A
INTERNET - Internet Information Providers
|
$30.78
|
+0.03
0.10% |
$31.24
|
2,110,321
89.28% of 50 DAV
50 DAV is 2,363,600
|
$31.11
-1.06%
|
7/10/2013
|
$29.29
|
PP = $29.59
|
|
MB = $31.07
|
Most Recent Note - 7/12/2013 1:51:16 PM
Y - Hit another new 52-week high with today's 6th consecutive gain. Its gain with +130% above average volume triggered a technical buy signal while rallying above its pivot point on the prior session. When challenging its prior high an annotated weekly graph was included in the 7/10/13 mid-day report (read here) and it was covered in greater detail with an annotated daily graph in that evening's Featured Stock Update (FSU) section of the After Market Update.
>>> The latest Featured Stock Update with an annotated graph appeared on 7/10/2013. Click here.
View all notes |
Alert me of new notes |
CANSLIM.net Company Profile |
SEC |
Zacks Reports |
StockTalk |
News |
Chart |
Request a new note
C
A N
S L
I M
|
|
|
|
THESE ARE NOT BUY RECOMMENDATIONS!
Comments contained in the body of this report are technical
opinions only. The material herein has been obtained
from sources believed to be reliable and accurate, however,
its accuracy and completeness cannot be guaranteed.
This site is not an investment advisor, hence it does
not endorse or recommend any securities or other investments.
Any recommendation contained in this report may not
be suitable for all investors and it is not to be deemed
an offer or solicitation on our part with respect to
the purchase or sale of any securities. All trademarks,
service marks and trade names appearing in this report
are the property of their respective owners, and are
likewise used for identification purposes only.
This report is a service available
only to active Paid Premium Members.
You may opt-out of receiving report notifications
at any time. Questions or comments may be submitted
by writing to Premium Membership Services 665 S.E. 10 Street, Suite 201 Deerfield Beach, FL 33441-5634 or by calling 1-800-965-8307
or 954-785-1121.
|
|
|

