You are not logged in.
This means you
CAN ONLY VIEW reports that were published prior to Monday, April 14, 2025.
You
MUST UPGRADE YOUR MEMBERSHIP if you want to see any current reports.
AFTER MARKET UPDATE - TUESDAY, JULY 15TH, 2014
Previous After Market Report Next After Market Report >>>
|
|
|
|
DOW |
+5.26 |
17,060.68 |
+0.03% |
|
Volume |
716,336,220 |
+24% |
|
Volume |
1,615,815,620 |
+10% |
|
NASDAQ |
-24.03 |
4,416.39 |
-0.54% |
|
Advancers |
1,052 |
33% |
|
Advancers |
779 |
26% |
|
S&P 500 |
-3.82 |
1,973.28 |
-0.19% |
|
Decliners |
2,001 |
63% |
|
Decliners |
2,052 |
70% |
|
Russell 2000 |
-11.81 |
1,153.81 |
-1.01% |
|
52 Wk Highs |
101 |
|
|
52 Wk Highs |
42 |
|
|
S&P 600 |
-5.53 |
664.68 |
-0.83% |
|
52 Wk Lows |
25 |
|
|
52 Wk Lows |
51 |
|
|
 |
Major Averages Endured More Distributional Pressure
Kenneth J. Gruneisen - Passed the CAN SLIM® Master's Exam
Stocks were mostly lower on Tuesday's session while the volume on the session was higher than the prior session volume totals on the NYSE and on the Nasdaq exchange indicating institutional distribution. Breadth was negative as decliners led advancers by almost a 2-1 margin on the NYSE and 5-2 on the Nasdaq exchange. There were 25 high-ranked companies from the CANSLIM.net Leaders List that made new 52-week highs and appeared on the CANSLIM.net BreakOuts Page, down from the prior session total of 36 stocks. New 52-week highs outnumbered new 52-week lows on the NYSE but new lows outnumbered new highs on the Nasdaq exchange. There were losses for all 14 high-ranked companies currently included on the Featured Stocks Page, a disproportionately negative balance versus the broader market's breadth. The market (M criteria) uptrend clearly came under pressure last week while leadership quickly evaporated. Any new buying efforts should be selective and focused in stocks meeting all key criteria of the fact-based investment system.
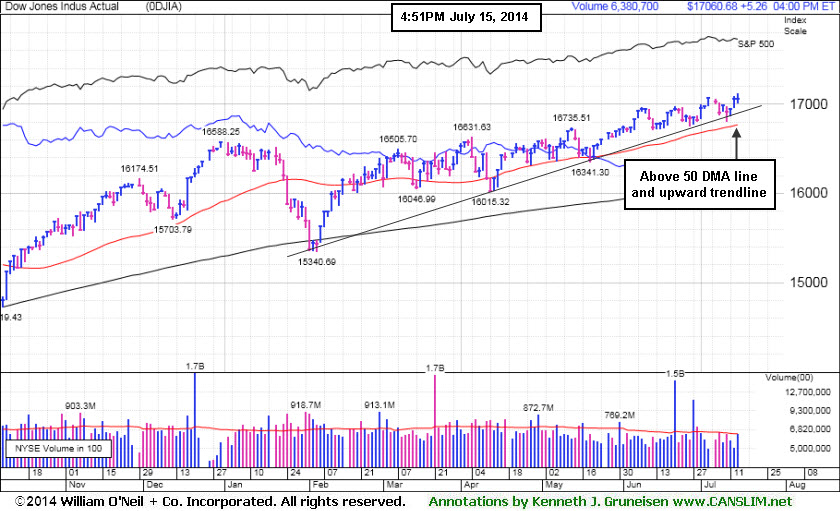
PICTURED: The Dow Jones Industrial Average rose 5 points to 17,060. Its 50-day moving average (DMA) line and upward trendline define near-term support to watch.
The major averages finished mixed as investors weighed positive bank earnings against comments from the Fed. Shares of J.P. Morgan (JPM +3.52%) and Goldman Sachs (GS +1.3%) rose after both posted quarterly profits ahead of consensus estimates. In her Congressional testimony today, Fed Chair Janet Yellen said policy makers are concerned about valuations within certain areas of the market. Yellen also indicated interest rates are likely to remain low due to weakness in the labor market and inflation running below its target.
The latest economic data releases were mixed. Before the open, a report showed retail sales rose +0.2% in June, less than a projected +0.6% increase. A separate release revealed manufacturing in the Fed's New York region unexpectedly expanded at a faster pace this month. Import prices grew +0.1% last month, below the consensus estimate for a +0.4% gain.
Consumer staples and health care were the worst performing groups on the session. Lorillard (LO -10.49%) after Reynolds American (RAI -6.87%) agreed to by its rival for $25 billion. Shares of Johnson & Johnson (JNJ -2%) declined despite raising its full-year forecast.
Treasuries were little changed. The 10-year note slipped 1/32 to yield 2.55%.
The CANSLIM.net Featured Stocks Page shows the most action-worthy candidates and their latest notes and a Headline Link directs members to the latest detailed analysis with data-packed graphs annotated by a Certified expert along with links to additional resources. The Premium Member Homepage includes "dynamic archives" to all prior pay reports published. Watch for an announcement via email concerning the next WEBCAST.
|
 Kenneth J. Gruneisen started out as a licensed stockbroker in August 1987, a couple of months prior to the historic stock market crash that took the Dow Jones Industrial Average down -22.6% in a single day. He has published daily fact-based fundamental and technical analysis on high-ranked stocks online for two decades. Through FACTBASEDINVESTING.COM, Kenneth provides educational articles, news, market commentary, and other information regarding proven investment systems that work in good times and bad.
Comments contained in the body of this report are technical opinions only and are not necessarily those of Gruneisen Growth Corp. The material herein has been obtained from sources believed to be reliable and accurate, however, its accuracy and completeness cannot be guaranteed. Our firm, employees, and customers may effect transactions, including transactions contrary to any recommendation herein, or have positions in the securities mentioned herein or options with respect thereto. Any recommendation contained in this report may not be suitable for all investors and it is not to be deemed an offer or solicitation on our part with respect to the purchase or sale of any securities. |
|
 |
Bank Index Rose; Gold & Silver and Biotech Indexes Led Decliners
Kenneth J. Gruneisen - Passed the CAN SLIM® Master's Exam
The Bank Index ($BKX +1.35%) posted a gain while the Broker/Dealer Index ($XBD -0.26%) edged lower on Tuesday. The Retail Index ($RLX -0.01%) finished flat and the Semiconductor Index ($SOX -0.26%) and Networking Index ($NWX -0.19%) both ended slightly lower. Energy-related shares finished with small losses as the Integrated Oil Index ($XOI -0.13%) Oil Services Index ($OSX -0.10%) inched lower. The Gold & Silver Index ($XAU -3.02%) was a standout decliner.
Charts courtesy www.stockcharts.com
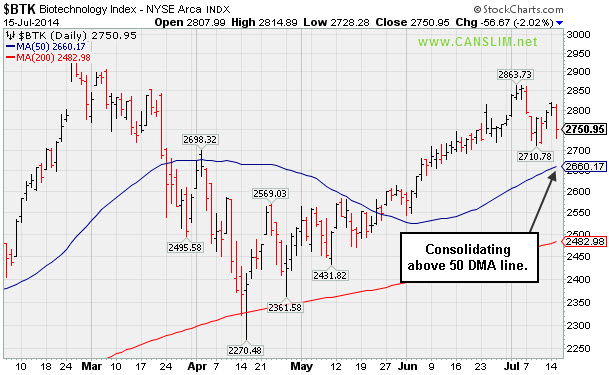
PICTURED: The Biotechnology Index ($BTK -2.02%) was the weakest of the tech sector indices, consolidating above its 50-day moving average (DMA) line.
| Oil Services |
$OSX |
303.62 |
-0.29 |
-0.10% |
+8.04% |
| Integrated Oil |
$XOI |
1,667.34 |
-2.23 |
-0.13% |
+10.92% |
| Semiconductor |
$SOX |
644.44 |
-1.68 |
-0.26% |
+20.45% |
| Networking |
$NWX |
329.05 |
-0.63 |
-0.19% |
+1.58% |
| Broker/Dealer |
$XBD |
156.23 |
-0.41 |
-0.26% |
-2.69% |
| Retail |
$RLX |
904.83 |
-0.05 |
-0.01% |
-3.72% |
| Gold & Silver |
$XAU |
98.30 |
-3.06 |
-3.02% |
+16.82% |
| Bank |
$BKX |
72.18 |
+0.96 |
+1.35% |
+4.22% |
| Biotech |
$BTK |
2,750.95 |
-56.67 |
-2.02% |
+18.04% |
|
|
|
 |
Slump Into Prior Base Negated Recent Breakout
Kenneth J. Gruneisen - Passed the CAN SLIM® Master's Exam
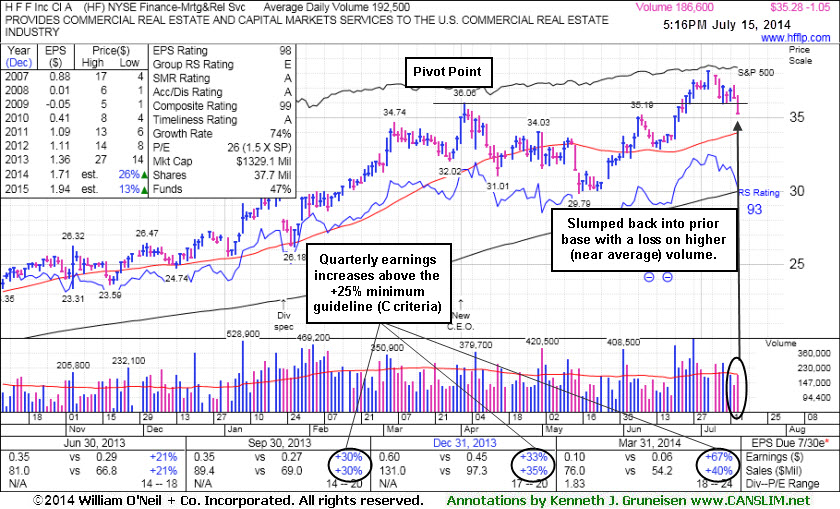
H F F Inc (HF -$1.05 or -2.89% to $35.28) slumped below its pivot point today and fell back into its prior base raising some concerns as it finished near the session low with a loss on below average volume. Disciplined investors limit losses by selling any stock that falls more than -7% from their purchase price. Prior highs in the $35 area define initial support to watch and its 50-day moving average (DMA) line defines the next important support level. It was last shown in this FSU section on 6/23/14 with annotated graphs under the headline, "Approached 52-Week High With Volume-Driven Gain", and subsequent gains above the pivot point backed by above average triggered a proper technical buy signal. It was highlighted in yellow with pivot point cited based on its 4/02/14 high plus 10 cents in the 6/20/14 mid-day report (click here).
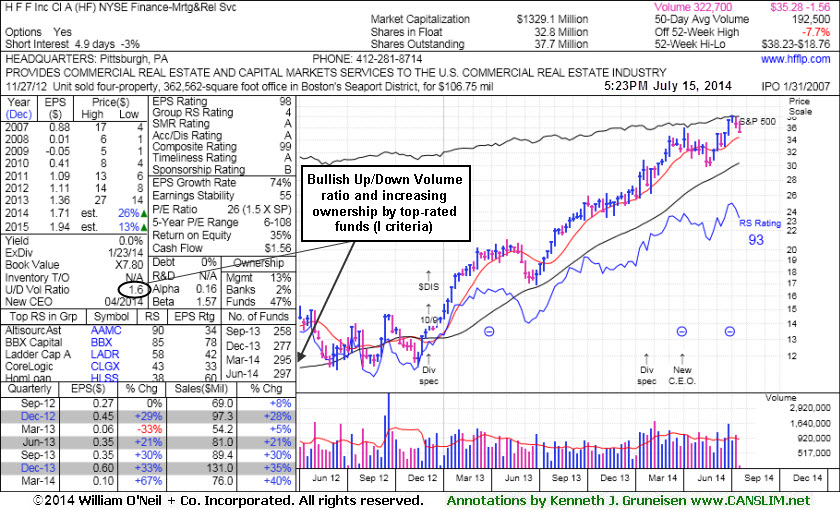
Fundamentals are very strong as it has earned a 98 Earnings Per Share Rating. It reported earnings +67% on +40% sales revenues for the Mar '14 quarter, its 3rd consecutive quarterly comparison above the +25% minimum earnings guideline (C criteria). Its annual earnings (A criteria) history has improved since a drastic downturn and losses in FY '09. The small supply (S criteria) of only 37.7 million shares outstanding can contribute to price volatility in the event of institutional buying or selling. The number of top-rated funds owning its shares rose from 230 in Jun '13 to 297 in Jun '14, a reassuring sign concerning the I criteria. Its current Up/Down Volume Ratio of 1.6 is an unbiased indication its shares have been under accumulation over the past 50 days.
|
|
|
Color Codes Explained :
Y - Better candidates highlighted by our
staff of experts.
G - Previously featured
in past reports as yellow but may no longer be buyable under the
guidelines.
***Last / Change / Volume data in this table is the closing quote data***
Symbol/Exchange
Company Name
Industry Group |
PRICE |
CHANGE
(%Change) |
Day High |
Volume
(% DAV)
(% 50 day avg vol) |
52 Wk Hi
% From Hi |
Featured
Date |
Price
Featured |
Pivot Featured |
|
Max Buy |
ACT
-
NYSE
Actavis plc
Medical-Generic Drugs
|
$218.97
|
-1.62
-0.73% |
$221.09
|
1,401,764
63.34% of 50 DAV
50 DAV is 2,213,000
|
$230.77
-5.11%
|
6/20/2014
|
$216.53
|
PP = $230.87
|
|
MB = $242.41
|
Most Recent Note - 7/14/2014 6:21:23 PM
Y - Consolidating above its 50 DMA line, still hovering within close striking distance of its 52-week high. Subsequent volume-driven gains to new highs may trigger a technical buy signal.
>>> FEATURED STOCK ARTICLE : Volume Above Average as Generic Drug Firm Approaches Highs - 6/24/2014
View all notes |
Set NEW NOTE alert |
CANSLIM.net Company Profile |
SEC
News |
Chart |
Request a new note
C
A N
S L
I M


|
AFSI
-
NASDAQ
Amtrust Financial Svcs
INSURANCE - Property and; Casualty Insurance
|
$41.29
|
-0.17
-0.41% |
$41.75
|
402,082
60.37% of 50 DAV
50 DAV is 666,000
|
$47.10
-12.34%
|
5/21/2014
|
$44.85
|
PP = $44.85
|
|
MB = $47.09
|
Most Recent Note - 7/14/2014 6:22:40 PM
G - Gains have come on light volume after recent slump below 50 DMA line raised concerns. Faces resistance due to overhead supply up through the $47 level.
>>> FEATURED STOCK ARTICLE : Found Support Near 50-Day Average and Relative Strength Slightly Improved - 7/1/2014
View all notes |
Set NEW NOTE alert |
CANSLIM.net Company Profile |
SEC
News |
Chart |
Request a new note
C
A N
S L
I M
|
BITA
-
NYSE
Bitauto Hldgs Ltd Ads
Internet-Content
|
$51.80
|
-1.39
-2.61% |
$54.31
|
1,296,067
134.45% of 50 DAV
50 DAV is 964,000
|
$53.62
-3.39%
|
6/26/2014
|
$46.20
|
PP = $47.03
|
|
MB = $49.38
|
Most Recent Note - 7/14/2014 12:09:33 PM
G - Hitting another new 52-week high with today's 4th consecutive gain, getting more extended from its prior base. Managed a "positive reversal" on 7/10/14 after trading down considerably, likely prompting disciplined investors to sell if it fell more than -7% from their purchase price. Any stock which is sold can be bought back later if strength returns, however rule number one is to always limit losses while they are small.
>>> FEATURED STOCK ARTICLE : Perched At High With No Resistance Remaining Due to Overhead Supply - 6/27/2014
View all notes |
Set NEW NOTE alert |
CANSLIM.net Company Profile |
SEC
News |
Chart |
Request a new note
C
A N
S L
I M
|
BWLD
-
NASDAQ
Buffalo Wild Wings Inc
LEISURE - Restaurants
|
$154.63
|
-1.88
-1.20% |
$157.62
|
342,208
89.12% of 50 DAV
50 DAV is 384,000
|
$167.36
-7.61%
|
6/19/2014
|
$158.52
|
PP = $159.91
|
|
MB = $167.91
|
Most Recent Note - 7/14/2014 6:20:36 PM
Y - Gain today came on lighter volume. Friday's close below the prior high close ($156.35 on 3/21/14) raised greater concerns and completely negated the recent technical breakout. See latest FSU analysis for more details and new annotated graphs.
>>> FEATURED STOCK ARTICLE : Slump Into Prior Base Negated Recent Breakout - 7/14/2014
View all notes |
Set NEW NOTE alert |
CANSLIM.net Company Profile |
SEC
News |
Chart |
Request a new note
C
A N
S L
I M
|
EQM
-
NYSE
E Q T Midstream Partners
ENERGY - Oil and Gas Pipelines
|
$95.62
|
-1.25
-1.29% |
$97.60
|
204,678
47.38% of 50 DAV
50 DAV is 432,000
|
$102.51
-6.72%
|
12/12/2013
|
$53.17
|
PP = $56.51
|
|
MB = $59.34
|
 Most Recent Note - 7/15/2014 4:27:36 PM
G - Volume totals have been cooling in recent weeks while consolidating well above its 50 DMA line. Strength has continued despite fundamental flaws repeatedly noted.
>>> FEATURED STOCK ARTICLE : Strength Continued Despite Fundamental Flaws - 6/25/2014
View all notes |
Set NEW NOTE alert |
CANSLIM.net Company Profile |
SEC
News |
Chart |
Request a new note
C
A N
S L
I M
|
Symbol/Exchange
Company Name
Industry Group |
PRICE |
CHANGE
(%Change) |
Day High |
Volume
(% DAV)
(% 50 day avg vol) |
52 Wk Hi
% From Hi |
Featured
Date |
Price
Featured |
Pivot Featured |
|
Max Buy |
GRFS
-
NASDAQ
Grifols Sa Ads
Medical-Ethical Drugs
|
$42.64
|
-0.27
-0.63% |
$43.15
|
845,172
120.57% of 50 DAV
50 DAV is 701,000
|
$46.66
-8.62%
|
5/15/2014
|
$41.14
|
PP = $43.55
|
|
MB = $45.73
|
Most Recent Note - 7/15/2014 4:24:41 PM
G - Encountered resistance at its 50 DMA line today and tallied a small loss with higher volume indicative of distributional pressure. Faces resistance due to overhead supply up through the $46 area.
>>> FEATURED STOCK ARTICLE : Violation of 50-Day Moving Average Triggered Technical Sell Signal - 7/9/2014
View all notes |
Set NEW NOTE alert |
CANSLIM.net Company Profile |
SEC
News |
Chart |
Request a new note
C
A N
S L
I M
|
HF
-
NYSE
H F F Inc Cl A
REAL ESTATE - Property Management/Developmen
|
$35.28
|
-1.05
-2.89% |
$36.51
|
184,847
96.27% of 50 DAV
50 DAV is 192,000
|
$38.23
-7.72%
|
6/20/2014
|
$34.60
|
PP = $36.16
|
|
MB = $37.97
|
Most Recent Note - 7/15/2014 5:36:43 PM
Y - Slumped below its pivot point and raised some concerns as it finished near the session low with a loss on below average volume. Testing prior highs in the $35 area defining initial support to watch on pullbacks. See the latest FSU analysis for more details and new annotated graphs.
>>> FEATURED STOCK ARTICLE : Slump Into Prior Base Negated Recent Breakout - 7/15/2014
View all notes |
Set NEW NOTE alert |
CANSLIM.net Company Profile |
SEC
News |
Chart |
Request a new note
C
A N
S L
I M
|
ICON
-
NASDAQ
Iconix Brand Group Inc
CONSUMER NON-DURABLES - Textile - Apparel Footwear
|
$41.78
|
-0.12
-0.29% |
$42.09
|
279,351
55.21% of 50 DAV
50 DAV is 506,000
|
$44.81
-6.76%
|
6/5/2014
|
$43.54
|
PP = $43.44
|
|
MB = $45.61
|
Most Recent Note - 7/11/2014 5:33:17 PM
G - Color code is changed to green after slumping below its 50 DMA line this week with losses on lighter volume. More damaging losses would raise greater concerns, meanwhile a rebound above the 50 DMA line is needed to help its outlook improve. See the latest FSU analysis for more details and new annotated graphs.
>>> FEATURED STOCK ARTICLE : Slump Below 50-Day Moving Average Line Hurt Outlook - 7/11/2014
View all notes |
Set NEW NOTE alert |
CANSLIM.net Company Profile |
SEC
News |
Chart |
Request a new note
C
A N
S L
I M
|
PANW
-
NYSE
Palo Alto Networks
Computer Sftwr-Security
|
$75.98
|
-0.24
-0.31% |
$77.06
|
788,793
42.27% of 50 DAV
50 DAV is 1,866,000
|
$85.78
-11.42%
|
5/29/2014
|
$75.95
|
PP = $72.50
|
|
MB = $76.13
|
Most Recent Note - 7/10/2014 6:11:04 PM
G - Managed a "positive reversal" today after slumping near its 50 DMA line. Further deterioration would raise more serious concerns.
>>> FEATURED STOCK ARTICLE : Gap Up Gain on Above Average Volume for New Highs - 6/30/2014
View all notes |
Set NEW NOTE alert |
CANSLIM.net Company Profile |
SEC
News |
Chart |
Request a new note
C
A N
S L
I M
|
SN
-
NYSE
Sanchez Energy Corp
ENERGY - Independent Oil and Gas
|
$32.50
|
-1.19
-3.53% |
$33.74
|
1,984,540
126.32% of 50 DAV
50 DAV is 1,571,000
|
$38.95
-16.56%
|
5/22/2014
|
$33.00
|
PP = $31.59
|
|
MB = $33.17
|
Most Recent Note - 7/15/2014 4:16:09 PM
G - Slumped further below its 50 DMA line with today's damaging loss on above average volume. Prior highs near $32 define important support to watch while more damaging losses would raise greater concerns.
>>> FEATURED STOCK ARTICLE : Recently Featured Stock Outpaced Benchmark S&P 500 Index - 7/3/2014
View all notes |
Set NEW NOTE alert |
CANSLIM.net Company Profile |
SEC
News |
Chart |
Request a new note
C
A N
S L
I M
|
Symbol/Exchange
Company Name
Industry Group |
PRICE |
CHANGE
(%Change) |
Day High |
Volume
(% DAV)
(% 50 day avg vol) |
52 Wk Hi
% From Hi |
Featured
Date |
Price
Featured |
Pivot Featured |
|
Max Buy |
TARO
-
NYSE
Taro Pharmaceutical Inds
DRUGS - Drug Manufacturers - Other
|
$144.38
|
-4.93
-3.30% |
$148.99
|
48,752
72.76% of 50 DAV
50 DAV is 67,000
|
$149.89
-3.68%
|
6/26/2014
|
$117.31
|
PP = $118.90
|
|
MB = $124.85
|
Most Recent Note - 7/15/2014 4:17:33 PM
G - Pulled back today on lighter volume. Extended from its prior base. Disciplined investors avoid chasing stocks more than +5% above prior highs.
>>> FEATURED STOCK ARTICLE : Fundamentally Strong Stock Challenging Prior Resistance Level - 6/26/2014
View all notes |
Set NEW NOTE alert |
CANSLIM.net Company Profile |
SEC
News |
Chart |
Request a new note
C
A N
S L
I M
|
TRN
-
NYSE
Trinity Industries Inc
TRANSPORTATION - Railroads
|
$44.44
|
-0.28
-0.63% |
$44.80
|
1,523,925
47.91% of 50 DAV
50 DAV is 3,181,000
|
$46.00
-3.39%
|
4/30/2014
|
$37.79
|
PP = $38.03
|
|
MB = $39.93
|
Most Recent Note - 7/15/2014 4:21:17 PM
G - Volume totals have been cooling while holding its ground stubbornly and consolidating near its 52-week high, extended from its prior base. Its 50 DMA line defines important near-term support to watch.
>>> FEATURED STOCK ARTICLE : Bullish Up/Down Volume and Increasing Institutional Ownership - 7/8/2014
View all notes |
Set NEW NOTE alert |
CANSLIM.net Company Profile |
SEC
News |
Chart |
Request a new note
C
A N
S L
I M
|
UA
-
NYSE
Under Armour Inc Cl A
CONSUMER NON-DURABLES - Textile - Apparel Clothing
|
$58.37
|
-0.61
-1.03% |
$58.81
|
1,761,890
66.79% of 50 DAV
50 DAV is 2,638,000
|
$62.40
-6.45%
|
7/10/2014
|
$58.50
|
PP = $60.79
|
|
MB = $63.83
|
Most Recent Note - 7/15/2014 4:29:40 PM
Y - Holding its ground since highlighted in yellow in the 7/10/14 mid-day report (read here) forming cup-with-handle base. Volume-driven gains above the pivot point are still needed to trigger a proper technical buy signal.
>>> FEATURED STOCK ARTICLE : Forming Handle on Cup-With-Handle Base Pattern - 7/10/2014
View all notes |
Set NEW NOTE alert |
CANSLIM.net Company Profile |
SEC
News |
Chart |
Request a new note
C
A N
S L
I M
|
WLK
-
NYSE
Westlake Chemical Corp
CHEMICALS - Specialty Chemicals
|
$84.47
|
-0.18
-0.21% |
$85.54
|
388,829
61.33% of 50 DAV
50 DAV is 634,000
|
$86.13
-1.93%
|
4/29/2014
|
$72.79
|
PP = $69.31
|
|
MB = $72.78
|
Most Recent Note - 7/14/2014 6:23:40 PM
G - Hovering near its 52-week high, extended from any sound base pattern. Its 50 DMA line ($80.57) defines important near-term support to watch on pullbacks.
>>> FEATURED STOCK ARTICLE : Great Ranks and Reassuring Leadership in Chemical Group - 7/7/2014
View all notes |
Set NEW NOTE alert |
CANSLIM.net Company Profile |
SEC
News |
Chart |
Request a new note
C
A N
S L
I M
|
|
|
|
THESE ARE NOT BUY RECOMMENDATIONS!
Comments contained in the body of this report are technical
opinions only. The material herein has been obtained
from sources believed to be reliable and accurate, however,
its accuracy and completeness cannot be guaranteed.
This site is not an investment advisor, hence it does
not endorse or recommend any securities or other investments.
Any recommendation contained in this report may not
be suitable for all investors and it is not to be deemed
an offer or solicitation on our part with respect to
the purchase or sale of any securities. All trademarks,
service marks and trade names appearing in this report
are the property of their respective owners, and are
likewise used for identification purposes only.
This report is a service available
only to active Paid Premium Members.
You may opt-out of receiving report notifications
at any time. Questions or comments may be submitted
by writing to Premium Membership Services 665 S.E. 10 Street, Suite 201 Deerfield Beach, FL 33441-5634 or by calling 1-800-965-8307
or 954-785-1121.
|
|
|

