You are not logged in.
This means you
CAN ONLY VIEW reports that were published prior to Tuesday, April 15, 2025.
You
MUST UPGRADE YOUR MEMBERSHIP if you want to see any current reports.
AFTER MARKET UPDATE - WEDNESDAY, JULY 16TH, 2014
Previous After Market Report Next After Market Report >>>
|
|
|
|
DOW |
+77.52 |
17,138.20 |
+0.45% |
|
Volume |
660,150,210 |
-8% |
|
Volume |
1,910,350,060 |
+18% |
|
NASDAQ |
+9.58 |
4,425.97 |
+0.22% |
|
Advancers |
1,680 |
53% |
|
Advancers |
1,182 |
41% |
|
S&P 500 |
+8.29 |
1,981.57 |
+0.42% |
|
Decliners |
1,365 |
43% |
|
Decliners |
1,584 |
55% |
|
Russell 2000 |
-2.26 |
1,151.55 |
-0.20% |
|
52 Wk Highs |
105 |
|
|
52 Wk Highs |
44 |
|
|
S&P 600 |
-1.32 |
663.36 |
-0.20% |
|
52 Wk Lows |
25 |
|
|
52 Wk Lows |
52 |
|
|
 |
Mixed Breadth as Major Averages Rose
Kenneth J. Gruneisen - Passed the CAN SLIM® Master's Exam
The major averages rose on Wednesday while the volume on the session was mixed, lighter than the prior session volume total on the NYSE and higher on the Nasdaq exchange. Decliners led advancers by a 3-2 margin on the Nasdaq exchange while advancers led decliners by an 8-7 margin on the NYSE. There were 29 high-ranked companies from the CANSLIM.net Leaders List that made new 52-week highs and appeared on the CANSLIM.net BreakOuts Page, up from the prior session total of 25 stocks. New 52-week highs outnumbered new 52-week lows on the NYSE but new lows outnumbered new highs on the Nasdaq exchange. There were gains for 6 of the 14 high-ranked companies currently included on the Featured Stocks Page. The market (M criteria) uptrend clearly came under pressure last week while leadership quickly evaporated. Any new buying efforts should be selective and focused in stocks meeting all key criteria of the fact-based investment system.
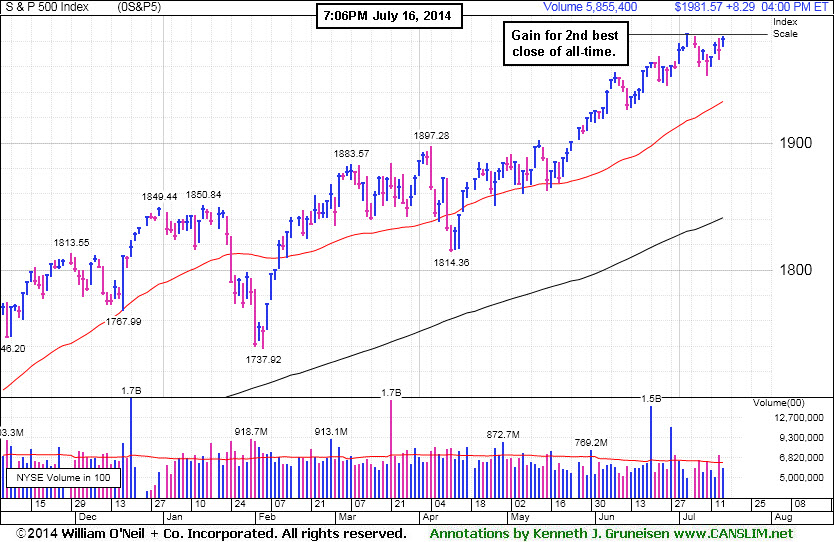
PICTURED: The S&P 500 Index finished at its second-best close of all-time as it gained 8 points to 1,981.
The Dow climbed 78 points to reach an all-time high of 17,138. The NASDAQ closed 10 points higher at 4,425. The major averages advanced amid generally positive earnings releases and M&A news. Intel (INTC +9.27%) rallied after quarterly results topped estimates and the chipmaker raised its revenue outlook. Shares of Time Warner (TWX +17.07%) rose after saying it rejected an $80 billion takeover offer from Twenty-First Century Fox (FOX -4.64%).
Encouraging data provided a lift to the market. China’s economy grew +7.5% in the second-quarter, better than a projected +7.4% increase. On the U.S. economic front, producer prices increased +0.4% due to higher energy costs. Industrial production rose +0.2% last month. The Fed's Beige Book report indicated the economy continued to expand at a moderate pace.
Seven of 10 sectors in the S&P 500 were up on the session led by energy and technology. Exxon (XOM +1.4%). International Business Machines (IBM +2.05%) rose after announcing a deal with Apple (AAPL -0.6%) to jointly develop applications for wireless devices. Health care was the worst performing group as Johnson & Johnson (JNJ -1%) declined.
In fixed income trading, the 10-year note rose 4/32 to yield 2.53%.
The CANSLIM.net Featured Stocks Page shows the most action-worthy candidates and their latest notes and a Headline Link directs members to the latest detailed analysis with data-packed graphs annotated by a Certified expert along with links to additional resources. The Premium Member Homepage includes "dynamic archives" to all prior pay reports published. Watch for an announcement via email concerning the next WEBCAST.
|
 Kenneth J. Gruneisen started out as a licensed stockbroker in August 1987, a couple of months prior to the historic stock market crash that took the Dow Jones Industrial Average down -22.6% in a single day. He has published daily fact-based fundamental and technical analysis on high-ranked stocks online for two decades. Through FACTBASEDINVESTING.COM, Kenneth provides educational articles, news, market commentary, and other information regarding proven investment systems that work in good times and bad.
Comments contained in the body of this report are technical opinions only and are not necessarily those of Gruneisen Growth Corp. The material herein has been obtained from sources believed to be reliable and accurate, however, its accuracy and completeness cannot be guaranteed. Our firm, employees, and customers may effect transactions, including transactions contrary to any recommendation herein, or have positions in the securities mentioned herein or options with respect thereto. Any recommendation contained in this report may not be suitable for all investors and it is not to be deemed an offer or solicitation on our part with respect to the purchase or sale of any securities. |
|
 |
Commodity-Linked Groups and Semiconductor Index Led Gainers
Kenneth J. Gruneisen - Passed the CAN SLIM® Master's Exam
Commodity-linked groups had a positive bias as the Integrated Oil Index ($XOI +1.42%), Oil Services Index ($OSX +1.46%), and the Gold & Silver Index ($XAU +1.63%) tallied gains. Losses for the Bank Index ($BKX -0.90%), Broker/Dealer Index ($XBD -0.16%), and the Retail Index ($RLX -0.36%) limited the major averages' rally. The Biotechnology Index ($BTK -1.01%) lost ground while the Networking Index ($NWX +0.16%) eked out a small gain.
Charts courtesy www.stockcharts.com
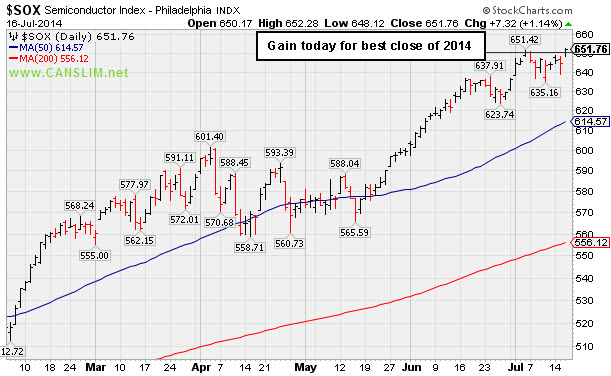
PICTURED: The Semiconductor Index ($SOX +1.14%) posted a solid gain for its best close of 2014.
| Oil Services |
$OSX |
308.04 |
+4.42 |
+1.46% |
+9.61% |
| Integrated Oil |
$XOI |
1,691.06 |
+23.72 |
+1.42% |
+12.50% |
| Semiconductor |
$SOX |
651.76 |
+7.32 |
+1.14% |
+21.82% |
| Networking |
$NWX |
329.58 |
+0.52 |
+0.16% |
+1.74% |
| Broker/Dealer |
$XBD |
155.99 |
-0.25 |
-0.16% |
-2.85% |
| Retail |
$RLX |
901.61 |
-3.22 |
-0.36% |
-4.06% |
| Gold & Silver |
$XAU |
99.90 |
+1.60 |
+1.63% |
+18.72% |
| Bank |
$BKX |
71.53 |
-0.65 |
-0.90% |
+3.28% |
| Biotech |
$BTK |
2,723.11 |
-27.84 |
-1.01% |
+16.85% |
|
|
|
 |
Disciplined Investors Still Awaiting Technical Breakout
Kenneth J. Gruneisen - Passed the CAN SLIM® Master's Exam
Atavis plc (ACT -$1.04 or -0.47% to $217.93) is still consolidating above its 50-day moving average (DMA) line, still hovering within close striking distance of its 52-week high. It was last shown in this FSU section on 6/24/14 wit annotated graphs under the headline, "Volume Above Average as Generic Drug Firm Approaches Highs". It was highlighted in yellow in the 6/20/14 mid-day report (read here) with a pivot point based on its 2/26/14 high plus 10 cents. Subsequent volume-driven gains should be backed by at least +40% above average volume as it hits new highs to trigger a proper technical buy signal.
The Medical - Generic Drugs industry group currently has a 93 Group Relative Strength Rating and leadership from other issues is a reassuring sign concerning the L criteria. It reported earnings +75% on +40% sales revenues for the Mar '14 quarter, and its strong record satisfies the C criteria. Its annual earnings (A criteria) history has also been strong. The number of top-rated funds owning its shares rose from 1,236 in Jun '13 to 1,568 in Jun '14, a reassuring sign concerning the I criteria.


|
|
|
Color Codes Explained :
Y - Better candidates highlighted by our
staff of experts.
G - Previously featured
in past reports as yellow but may no longer be buyable under the
guidelines.
***Last / Change / Volume data in this table is the closing quote data***
Symbol/Exchange
Company Name
Industry Group |
PRICE |
CHANGE
(%Change) |
Day High |
Volume
(% DAV)
(% 50 day avg vol) |
52 Wk Hi
% From Hi |
Featured
Date |
Price
Featured |
Pivot Featured |
|
Max Buy |
ACT
-
NYSE
Actavis plc
Medical-Generic Drugs
|
$217.93
|
-1.04
-0.47% |
$220.24
|
1,360,507
61.87% of 50 DAV
50 DAV is 2,199,000
|
$230.77
-5.56%
|
6/20/2014
|
$216.53
|
PP = $230.87
|
|
MB = $242.41
|
 Most Recent Note - 7/16/2014 7:53:41 PM
Y - Consolidating above its 50 DMA line, still hovering within close striking distance of its 52-week high. Subsequent volume-driven gains to new highs may trigger a technical buy signal. See the latest FSU analysis for more details and new annotated graphs.
>>> FEATURED STOCK ARTICLE : Disciplined Investors Still Awaiting Technical Breakout - 7/16/2014
View all notes |
Set NEW NOTE alert |
CANSLIM.net Company Profile |
SEC
News |
Chart |
Request a new note
C
A N
S L
I M


|
AFSI
-
NASDAQ
Amtrust Financial Svcs
INSURANCE - Property and; Casualty Insurance
|
$41.43
|
+0.14
0.34% |
$41.71
|
269,697
41.36% of 50 DAV
50 DAV is 652,000
|
$47.10
-12.04%
|
5/21/2014
|
$44.85
|
PP = $44.85
|
|
MB = $47.09
|
Most Recent Note - 7/14/2014 6:22:40 PM
G - Gains have come on light volume after recent slump below 50 DMA line raised concerns. Faces resistance due to overhead supply up through the $47 level.
>>> FEATURED STOCK ARTICLE : Found Support Near 50-Day Average and Relative Strength Slightly Improved - 7/1/2014
View all notes |
Set NEW NOTE alert |
CANSLIM.net Company Profile |
SEC
News |
Chart |
Request a new note
C
A N
S L
I M
|
BITA
-
NYSE
Bitauto Hldgs Ltd Ads
Internet-Content
|
$52.15
|
+0.35
0.68% |
$53.19
|
517,664
52.88% of 50 DAV
50 DAV is 979,000
|
$54.31
-3.98%
|
6/26/2014
|
$46.20
|
PP = $47.03
|
|
MB = $49.38
|
Most Recent Note - 7/14/2014 12:09:33 PM
G - Hitting another new 52-week high with today's 4th consecutive gain, getting more extended from its prior base. Managed a "positive reversal" on 7/10/14 after trading down considerably, likely prompting disciplined investors to sell if it fell more than -7% from their purchase price. Any stock which is sold can be bought back later if strength returns, however rule number one is to always limit losses while they are small.
>>> FEATURED STOCK ARTICLE : Perched At High With No Resistance Remaining Due to Overhead Supply - 6/27/2014
View all notes |
Set NEW NOTE alert |
CANSLIM.net Company Profile |
SEC
News |
Chart |
Request a new note
C
A N
S L
I M
|
BWLD
-
NASDAQ
Buffalo Wild Wings Inc
LEISURE - Restaurants
|
$153.35
|
-1.28
-0.83% |
$156.36
|
300,649
78.29% of 50 DAV
50 DAV is 384,000
|
$167.36
-8.37%
|
6/19/2014
|
$158.52
|
PP = $159.91
|
|
MB = $167.91
|
Most Recent Note - 7/14/2014 6:20:36 PM
Y - Gain today came on lighter volume. Friday's close below the prior high close ($156.35 on 3/21/14) raised greater concerns and completely negated the recent technical breakout. See latest FSU analysis for more details and new annotated graphs.
>>> FEATURED STOCK ARTICLE : Slump Into Prior Base Negated Recent Breakout - 7/14/2014
View all notes |
Set NEW NOTE alert |
CANSLIM.net Company Profile |
SEC
News |
Chart |
Request a new note
C
A N
S L
I M
|
EQM
-
NYSE
E Q T Midstream Partners
ENERGY - Oil and Gas Pipelines
|
$95.20
|
-0.42
-0.44% |
$96.49
|
161,166
49.59% of 50 DAV
50 DAV is 325,000
|
$102.51
-7.13%
|
12/12/2013
|
$53.17
|
PP = $56.51
|
|
MB = $59.34
|
Most Recent Note - 7/15/2014 4:27:36 PM
G - Volume totals have been cooling in recent weeks while consolidating well above its 50 DMA line. Strength has continued despite fundamental flaws repeatedly noted.
>>> FEATURED STOCK ARTICLE : Strength Continued Despite Fundamental Flaws - 6/25/2014
View all notes |
Set NEW NOTE alert |
CANSLIM.net Company Profile |
SEC
News |
Chart |
Request a new note
C
A N
S L
I M
|
Symbol/Exchange
Company Name
Industry Group |
PRICE |
CHANGE
(%Change) |
Day High |
Volume
(% DAV)
(% 50 day avg vol) |
52 Wk Hi
% From Hi |
Featured
Date |
Price
Featured |
Pivot Featured |
|
Max Buy |
GRFS
-
NASDAQ
Grifols Sa Cl B Ads
Medical-Ethical Drugs
|
$41.17
|
-1.47
-3.45% |
$42.95
|
524,987
74.78% of 50 DAV
50 DAV is 702,000
|
$46.66
-11.77%
|
5/15/2014
|
$41.14
|
PP = $43.55
|
|
MB = $45.73
|
Most Recent Note - 7/16/2014 7:55:00 PM
G - Encountered resistance at its 50 DMA line and slumped for another loss today with lighter volume. Faces resistance due to overhead supply up through the $46 area.
>>> FEATURED STOCK ARTICLE : Violation of 50-Day Moving Average Triggered Technical Sell Signal - 7/9/2014
View all notes |
Set NEW NOTE alert |
CANSLIM.net Company Profile |
SEC
News |
Chart |
Request a new note
C
A N
S L
I M
|
HF
-
NYSE
H F F Inc Cl A
REAL ESTATE - Property Management/Developmen
|
$35.26
|
-0.02
-0.06% |
$35.55
|
214,901
112.51% of 50 DAV
50 DAV is 191,000
|
$38.23
-7.77%
|
6/20/2014
|
$34.60
|
PP = $36.16
|
|
MB = $37.97
|
Most Recent Note - 7/15/2014 5:36:43 PM
Y - Slumped below its pivot point and raised some concerns as it finished near the session low with a loss on below average volume. Testing prior highs in the $35 area defining initial support to watch on pullbacks. See the latest FSU analysis for more details and new annotated graphs.
>>> FEATURED STOCK ARTICLE : Slump Into Prior Base Negated Recent Breakout - 7/15/2014
View all notes |
Set NEW NOTE alert |
CANSLIM.net Company Profile |
SEC
News |
Chart |
Request a new note
C
A N
S L
I M
|
ICON
-
NASDAQ
Iconix Brand Group Inc
CONSUMER NON-DURABLES - Textile - Apparel Footwear
|
$41.86
|
+0.08
0.19% |
$42.12
|
258,482
52.22% of 50 DAV
50 DAV is 495,000
|
$44.81
-6.58%
|
6/5/2014
|
$43.54
|
PP = $43.44
|
|
MB = $45.61
|
Most Recent Note - 7/11/2014 5:33:17 PM
G - Color code is changed to green after slumping below its 50 DMA line this week with losses on lighter volume. More damaging losses would raise greater concerns, meanwhile a rebound above the 50 DMA line is needed to help its outlook improve. See the latest FSU analysis for more details and new annotated graphs.
>>> FEATURED STOCK ARTICLE : Slump Below 50-Day Moving Average Line Hurt Outlook - 7/11/2014
View all notes |
Set NEW NOTE alert |
CANSLIM.net Company Profile |
SEC
News |
Chart |
Request a new note
C
A N
S L
I M
|
PANW
-
NYSE
Palo Alto Networks
Computer Sftwr-Security
|
$77.59
|
+1.61
2.12% |
$79.63
|
1,519,207
81.68% of 50 DAV
50 DAV is 1,860,000
|
$85.78
-9.55%
|
5/29/2014
|
$75.95
|
PP = $72.50
|
|
MB = $76.13
|
Most Recent Note - 7/16/2014 7:56:50 PM
G - Small gap up gain today on higher but still below average volume. Its 50 DMA line defines important support and a violation would raise serious concerns and trigger a technical sell signal.
>>> FEATURED STOCK ARTICLE : Gap Up Gain on Above Average Volume for New Highs - 6/30/2014
View all notes |
Set NEW NOTE alert |
CANSLIM.net Company Profile |
SEC
News |
Chart |
Request a new note
C
A N
S L
I M
|
SN
-
NYSE
Sanchez Energy Corp
ENERGY - Independent Oil and Gas
|
$33.19
|
+0.69
2.12% |
$33.38
|
977,671
61.18% of 50 DAV
50 DAV is 1,598,000
|
$38.95
-14.79%
|
5/22/2014
|
$33.00
|
PP = $31.59
|
|
MB = $33.17
|
Most Recent Note - 7/15/2014 4:16:09 PM
G - Slumped further below its 50 DMA line with today's damaging loss on above average volume. Prior highs near $32 define important support to watch while more damaging losses would raise greater concerns.
>>> FEATURED STOCK ARTICLE : Recently Featured Stock Outpaced Benchmark S&P 500 Index - 7/3/2014
View all notes |
Set NEW NOTE alert |
CANSLIM.net Company Profile |
SEC
News |
Chart |
Request a new note
C
A N
S L
I M
|
Symbol/Exchange
Company Name
Industry Group |
PRICE |
CHANGE
(%Change) |
Day High |
Volume
(% DAV)
(% 50 day avg vol) |
52 Wk Hi
% From Hi |
Featured
Date |
Price
Featured |
Pivot Featured |
|
Max Buy |
TARO
-
NYSE
Taro Pharmaceutical Inds
DRUGS - Drug Manufacturers - Other
|
$143.39
|
-0.99
-0.69% |
$147.66
|
92,191
137.60% of 50 DAV
50 DAV is 67,000
|
$149.89
-4.34%
|
6/26/2014
|
$117.31
|
PP = $118.90
|
|
MB = $124.85
|
Most Recent Note - 7/15/2014 4:17:33 PM
G - Pulled back today on lighter volume. Extended from its prior base. Disciplined investors avoid chasing stocks more than +5% above prior highs.
>>> FEATURED STOCK ARTICLE : Fundamentally Strong Stock Challenging Prior Resistance Level - 6/26/2014
View all notes |
Set NEW NOTE alert |
CANSLIM.net Company Profile |
SEC
News |
Chart |
Request a new note
C
A N
S L
I M
|
TRN
-
NYSE
Trinity Industries Inc
TRANSPORTATION - Railroads
|
$44.18
|
-0.26
-0.59% |
$44.70
|
2,221,646
71.32% of 50 DAV
50 DAV is 3,115,000
|
$46.00
-3.96%
|
4/30/2014
|
$37.79
|
PP = $38.03
|
|
MB = $39.93
|
Most Recent Note - 7/15/2014 4:21:17 PM
G - Volume totals have been cooling while holding its ground stubbornly and consolidating near its 52-week high, extended from its prior base. Its 50 DMA line defines important near-term support to watch.
>>> FEATURED STOCK ARTICLE : Bullish Up/Down Volume and Increasing Institutional Ownership - 7/8/2014
View all notes |
Set NEW NOTE alert |
CANSLIM.net Company Profile |
SEC
News |
Chart |
Request a new note
C
A N
S L
I M
|
UA
-
NYSE
Under Armour Inc Cl A
CONSUMER NON-DURABLES - Textile - Apparel Clothing
|
$57.34
|
-1.03
-1.76% |
$58.87
|
2,067,784
79.50% of 50 DAV
50 DAV is 2,601,000
|
$62.40
-8.10%
|
7/10/2014
|
$58.50
|
PP = $60.79
|
|
MB = $63.83
|
Most Recent Note - 7/15/2014 4:29:40 PM
Y - Holding its ground since highlighted in yellow in the 7/10/14 mid-day report (read here) forming cup-with-handle base. Volume-driven gains above the pivot point are still needed to trigger a proper technical buy signal.
>>> FEATURED STOCK ARTICLE : Forming Handle on Cup-With-Handle Base Pattern - 7/10/2014
View all notes |
Set NEW NOTE alert |
CANSLIM.net Company Profile |
SEC
News |
Chart |
Request a new note
C
A N
S L
I M
|
WLK
-
NYSE
Westlake Chemical Corp
CHEMICALS - Specialty Chemicals
|
$84.54
|
+0.07
0.08% |
$85.05
|
258,416
41.35% of 50 DAV
50 DAV is 625,000
|
$86.13
-1.85%
|
4/29/2014
|
$72.79
|
PP = $69.31
|
|
MB = $72.78
|
Most Recent Note - 7/14/2014 6:23:40 PM
G - Hovering near its 52-week high, extended from any sound base pattern. Its 50 DMA line ($80.57) defines important near-term support to watch on pullbacks.
>>> FEATURED STOCK ARTICLE : Great Ranks and Reassuring Leadership in Chemical Group - 7/7/2014
View all notes |
Set NEW NOTE alert |
CANSLIM.net Company Profile |
SEC
News |
Chart |
Request a new note
C
A N
S L
I M
|
|
|
|
THESE ARE NOT BUY RECOMMENDATIONS!
Comments contained in the body of this report are technical
opinions only. The material herein has been obtained
from sources believed to be reliable and accurate, however,
its accuracy and completeness cannot be guaranteed.
This site is not an investment advisor, hence it does
not endorse or recommend any securities or other investments.
Any recommendation contained in this report may not
be suitable for all investors and it is not to be deemed
an offer or solicitation on our part with respect to
the purchase or sale of any securities. All trademarks,
service marks and trade names appearing in this report
are the property of their respective owners, and are
likewise used for identification purposes only.
This report is a service available
only to active Paid Premium Members.
You may opt-out of receiving report notifications
at any time. Questions or comments may be submitted
by writing to Premium Membership Services 665 S.E. 10 Street, Suite 201 Deerfield Beach, FL 33441-5634 or by calling 1-800-965-8307
or 954-785-1121.
|
|
|

