You are not logged in.
This means you
CAN ONLY VIEW reports that were published prior to Monday, April 14, 2025.
You
MUST UPGRADE YOUR MEMBERSHIP if you want to see any current reports.
AFTER MARKET UPDATE - MONDAY, JULY 14TH, 2014
Previous After Market Report Next After Market Report >>>
|
|
|
|
DOW |
+111.61 |
17,055.42 |
+0.66% |
|
Volume |
579,683,830 |
+2% |
|
Volume |
1,474,418,550 |
+4% |
|
NASDAQ |
+24.93 |
4,440.42 |
+0.56% |
|
Advancers |
1,978 |
62% |
|
Advancers |
1,759 |
61% |
|
S&P 500 |
+9.53 |
1,977.10 |
+0.48% |
|
Decliners |
1,098 |
35% |
|
Decliners |
995 |
35% |
|
Russell 2000 |
+5.69 |
1,165.62 |
+0.49% |
|
52 Wk Highs |
173 |
|
|
52 Wk Highs |
57 |
|
|
S&P 600 |
+3.07 |
670.21 |
+0.46% |
|
52 Wk Lows |
10 |
|
|
52 Wk Lows |
37 |
|
|
 |
Dow Hit New High as Indices Rose With Better Volume
Kenneth J. Gruneisen - Passed the CAN SLIM® Master's Exam
The major averages were higher on Monday. Volume on the session was higher than the prior session volume totals on the NYSE and on the Nasdaq exchange, indicating institutional accumulation. Breadth was positive as advancers led decliners by nearly a 2-1 margin on the NYSE and on the Nasdaq exchange. There were 36 high-ranked companies from the CANSLIM.net Leaders List that made new 52-week highs and appeared on the CANSLIM.net BreakOuts Page, up from the prior session total of 16 stocks. New 52-week highs outnumbered new 52-week lows on the NYSE and on the Nasdaq exchange. There were gains for 11 of the 14 high-ranked companies currently included on the Featured Stocks Page. The market (M criteria) uptrend clearly came under pressure last week while leadership quickly evaporated. Any new buying efforts should be selective and focused in stocks meeting all key criteria of the fact-based investment system.
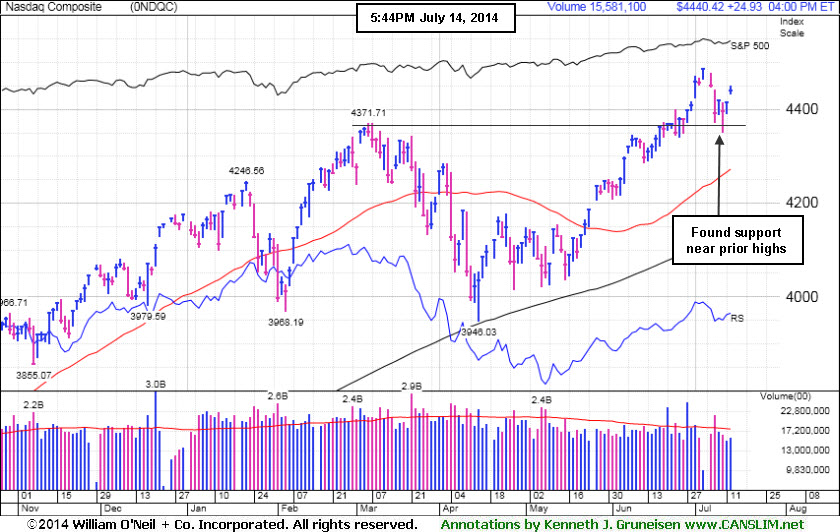
PICTURED: The Nasdaq Composite Index found support near its prior highs and gained 25 points to close at 4,440.
The Dow Jones Industrial Average touched a new all-time high and finished up 112 points, climbing back above 17,000 to finish at 17,055 as the major averages rebounded from last week's retreat. Positive earnings and M&A news inspired the buying efforts. Shares of Citigroup (C +3.02%) rose after quarterly profits topped consensus estimates. The bank also announced it would pay $7 billion to settle a government probe related to sales of mortgage-backed securities before the financial crisis. URS Corp (URS +12.26%) rallied after agreeing to be acquired by Aecom Technology (ACM +10.14%) for $4 billion. Mylan (MYL +2.1%) climbed after saying it would purchase Abbott Labs' (ABT +1.26%) generic drug business for $5.3 billion.
Nine of 10 sectors in the S&P 500 were up on the session. Energy and technology were the best performing groups. Exxon (XOM +0.92%) and Apple (AAPL +1.29%) were higher. Utilities sat out the advance with an index of companies in the S&P 500 down more than -1%. Shares of Exelon (EXC -2.63%) contributed the most to the group's decline.
Treasuries were lower to snap a five-day winning streak. Benchmark 10-year notes were down 8/32 to yield 2.55%.
The CANSLIM.net Featured Stocks Page shows the most action-worthy candidates and their latest notes and a Headline Link directs members to the latest detailed analysis with data-packed graphs annotated by a Certified expert along with links to additional resources. The Premium Member Homepage includes "dynamic archives" to all prior pay reports published. Watch for an announcement via email concerning the next WEBCAST.
|
 Kenneth J. Gruneisen started out as a licensed stockbroker in August 1987, a couple of months prior to the historic stock market crash that took the Dow Jones Industrial Average down -22.6% in a single day. He has published daily fact-based fundamental and technical analysis on high-ranked stocks online for two decades. Through FACTBASEDINVESTING.COM, Kenneth provides educational articles, news, market commentary, and other information regarding proven investment systems that work in good times and bad.
Comments contained in the body of this report are technical opinions only and are not necessarily those of Gruneisen Growth Corp. The material herein has been obtained from sources believed to be reliable and accurate, however, its accuracy and completeness cannot be guaranteed. Our firm, employees, and customers may effect transactions, including transactions contrary to any recommendation herein, or have positions in the securities mentioned herein or options with respect thereto. Any recommendation contained in this report may not be suitable for all investors and it is not to be deemed an offer or solicitation on our part with respect to the purchase or sale of any securities. |
|
 |
Financial, Retail, and Energy-Related Indexes Rose
Kenneth J. Gruneisen - Passed the CAN SLIM® Master's Exam
Financial shares were a positive influence on the major averages as the Bank Index ($BKX +0.35%) and the Broker/Dealer Index ($XBD +0.70%) posted modest gains. The Retail Index ($RLX +0.61%) tallied a small gain and the Semiconductor Index ($SOX +0.35%) and Biotechnology Index ($BTK +0.47%) both edged higher while the Networking Index ($NWX -0.23%) finished with a small loss. Commodity linked groups were mixed as the Integrated Oil Index ($XOI +0.76%) and the Oil Services Index ($OSX +0.95%) rose while the Gold & Silver Index ($XAU -2.60%) was a standout decliner.
Charts courtesy www.stockcharts.com
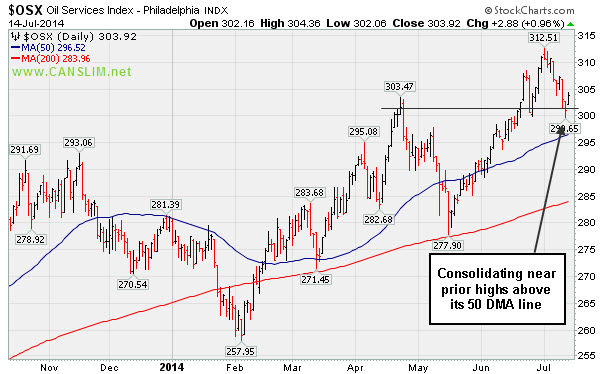
PICTURED: The Oil Services Index ($OSX +0.95%) is consolidating near its prior highs and above its 50-day moving average (DMA) line.
| Oil Services |
$OSX |
303.91 |
+2.87 |
+0.95% |
+8.14% |
| Integrated Oil |
$XOI |
1,669.57 |
+12.64 |
+0.76% |
+11.07% |
| Semiconductor |
$SOX |
646.12 |
+2.24 |
+0.35% |
+20.76% |
| Networking |
$NWX |
329.69 |
-0.75 |
-0.23% |
+1.77% |
| Broker/Dealer |
$XBD |
156.65 |
+1.08 |
+0.70% |
-2.44% |
| Retail |
$RLX |
904.88 |
+5.48 |
+0.61% |
-3.72% |
| Gold & Silver |
$XAU |
101.36 |
-2.71 |
-2.60% |
+20.45% |
| Bank |
$BKX |
71.22 |
+0.25 |
+0.35% |
+2.83% |
| Biotech |
$BTK |
2,807.62 |
+13.24 |
+0.47% |
+20.48% |
|
|
|
 |
Slump Into Prior Base Negated Recent Breakout
Kenneth J. Gruneisen - Passed the CAN SLIM® Master's Exam
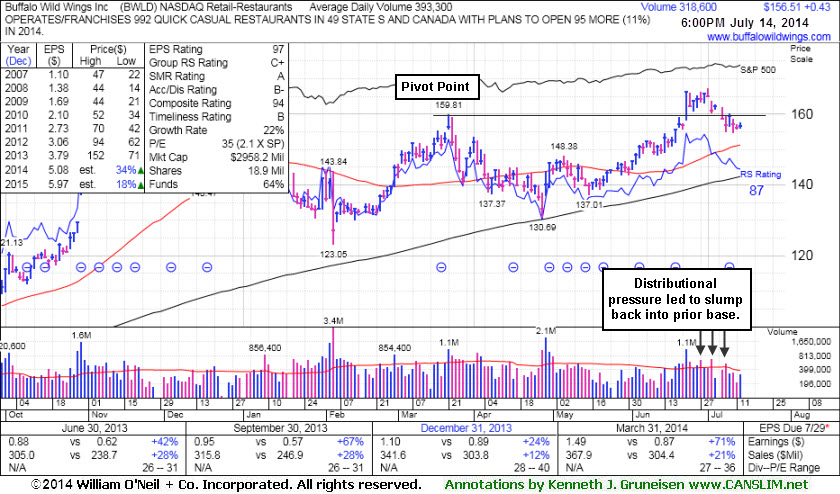
Buffalo Wild Wings Inc (BWLD +$0.43 or +0.28% to $156.51) stalled after reaching new highs, and since then it has encountered distributional pressure. Friday's close below the prior high close ($156.35 on 3/21/14) raised greater concerns as it completely negated the recent technical breakout. Its latest gains have come with light volume.
A volume-driven gain on 6/23/14 triggered a technical buy signal shortly after last shown in this FSU section on 6/19/14 with annotated graphs under the headline, "Perched Near Highs With Strong Fundamentals". The pivot point cited was based on its 3/21/14 high plus 10 cents as it was highlighted in yellow in the 6/19/14 mid-day report (read here). It reported earnings +71% on +21% sales revenues for the Mar '14 quarter, well above the +25% minimum earnings (C criteria) guideline, an improvement after a slightly sub par quarter. It found support at its 200-day moving average (DMA) line then rebounded since noted with caution in the 4/03/14 mid-day report - "Reported earnings +24% on +12% sales revenues for the Dec '13 quarter."
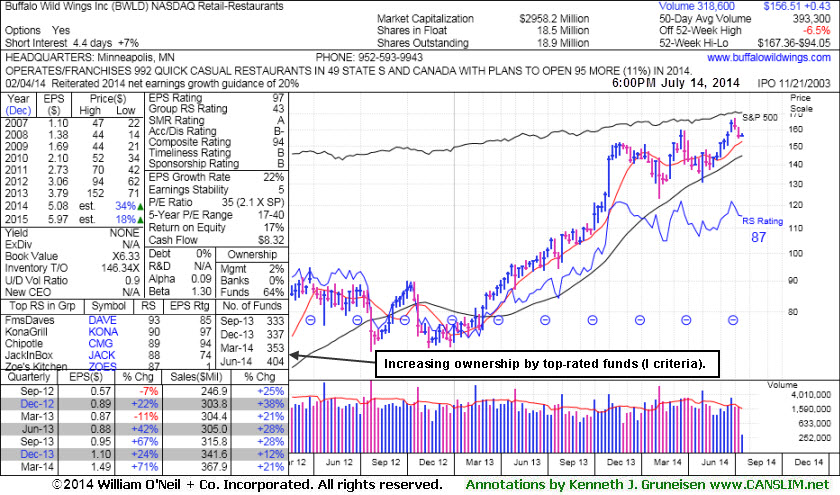
The number of top-rated funds owning its shares rose from 333 in Sep '13 to 404 in Jun '14, a reassuring sign concerning the I criteria. Its small supply of only 18.9 million shares (S criteria) outstanding can contribute to great price volatility in the event of institutional buying or selling.
|
|
|
Color Codes Explained :
Y - Better candidates highlighted by our
staff of experts.
G - Previously featured
in past reports as yellow but may no longer be buyable under the
guidelines.
***Last / Change / Volume data in this table is the closing quote data***
Symbol/Exchange
Company Name
Industry Group |
PRICE |
CHANGE
(%Change) |
Day High |
Volume
(% DAV)
(% 50 day avg vol) |
52 Wk Hi
% From Hi |
Featured
Date |
Price
Featured |
Pivot Featured |
|
Max Buy |
ACT
-
NYSE
Actavis plc
Medical-Generic Drugs
|
$220.59
|
+2.94
1.35% |
$221.51
|
1,684,791
75.21% of 50 DAV
50 DAV is 2,240,000
|
$230.77
-4.41%
|
6/20/2014
|
$216.53
|
PP = $230.87
|
|
MB = $242.41
|
 Most Recent Note - 7/14/2014 6:21:23 PM
Y - Consolidating above its 50 DMA line, still hovering within close striking distance of its 52-week high. Subsequent volume-driven gains to new highs may trigger a technical buy signal.
>>> FEATURED STOCK ARTICLE : Volume Above Average as Generic Drug Firm Approaches Highs - 6/24/2014
View all notes |
Set NEW NOTE alert |
CANSLIM.net Company Profile |
SEC
News |
Chart |
Request a new note
C
A N
S L
I M


|
AFSI
-
NASDAQ
Amtrust Financial Svcs
INSURANCE - Property and; Casualty Insurance
|
$41.46
|
+0.23
0.56% |
$41.97
|
364,822
52.57% of 50 DAV
50 DAV is 694,000
|
$47.10
-11.97%
|
5/21/2014
|
$44.85
|
PP = $44.85
|
|
MB = $47.09
|
Most Recent Note - 7/14/2014 6:22:40 PM
G - Gains have come on light volume after recent slump below 50 DMA line raised concerns. Faces resistance due to overhead supply up through the $47 level.
>>> FEATURED STOCK ARTICLE : Found Support Near 50-Day Average and Relative Strength Slightly Improved - 7/1/2014
View all notes |
Set NEW NOTE alert |
CANSLIM.net Company Profile |
SEC
News |
Chart |
Request a new note
C
A N
S L
I M
|
BITA
-
NYSE
Bitauto Hldgs Ltd Ads
Internet-Content
|
$53.19
|
+2.52
4.97% |
$53.62
|
1,083,394
113.09% of 50 DAV
50 DAV is 958,000
|
$51.25
3.79%
|
6/26/2014
|
$46.20
|
PP = $47.03
|
|
MB = $49.38
|
Most Recent Note - 7/14/2014 12:09:33 PM
G - Hitting another new 52-week high with today's 4th consecutive gain, getting more extended from its prior base. Managed a "positive reversal" on 7/10/14 after trading down considerably, likely prompting disciplined investors to sell if it fell more than -7% from their purchase price. Any stock which is sold can be bought back later if strength returns, however rule number one is to always limit losses while they are small.
>>> FEATURED STOCK ARTICLE : Perched At High With No Resistance Remaining Due to Overhead Supply - 6/27/2014
View all notes |
Set NEW NOTE alert |
CANSLIM.net Company Profile |
SEC
News |
Chart |
Request a new note
C
A N
S L
I M
|
BWLD
-
NASDAQ
Buffalo Wild Wings Inc
LEISURE - Restaurants
|
$156.51
|
+0.43
0.28% |
$157.74
|
319,333
81.26% of 50 DAV
50 DAV is 393,000
|
$167.36
-6.48%
|
6/19/2014
|
$158.52
|
PP = $159.91
|
|
MB = $167.91
|
Most Recent Note - 7/14/2014 6:20:36 PM
Y - Gain today came on lighter volume. Friday's close below the prior high close ($156.35 on 3/21/14) raised greater concerns and completely negated the recent technical breakout. See latest FSU analysis for more details and new annotated graphs.
>>> FEATURED STOCK ARTICLE : Slump Into Prior Base Negated Recent Breakout - 7/14/2014
View all notes |
Set NEW NOTE alert |
CANSLIM.net Company Profile |
SEC
News |
Chart |
Request a new note
C
A N
S L
I M
|
EQM
-
NYSE
E Q T Midstream Partners
ENERGY - Oil and Gas Pipelines
|
$96.87
|
+2.81
2.99% |
$97.35
|
137,327
31.50% of 50 DAV
50 DAV is 436,000
|
$102.51
-5.50%
|
12/12/2013
|
$53.17
|
PP = $56.51
|
|
MB = $59.34
|
Most Recent Note - 7/9/2014 5:54:24 PM
G - Still consolidating well above its 50 DMA line. Strength has continued despite fundamental flaws repeatedly noted.
>>> FEATURED STOCK ARTICLE : Strength Continued Despite Fundamental Flaws - 6/25/2014
View all notes |
Set NEW NOTE alert |
CANSLIM.net Company Profile |
SEC
News |
Chart |
Request a new note
C
A N
S L
I M
|
Symbol/Exchange
Company Name
Industry Group |
PRICE |
CHANGE
(%Change) |
Day High |
Volume
(% DAV)
(% 50 day avg vol) |
52 Wk Hi
% From Hi |
Featured
Date |
Price
Featured |
Pivot Featured |
|
Max Buy |
GRFS
-
NASDAQ
Grifols Sa Ads
Medical-Ethical Drugs
|
$42.91
|
+1.23
2.95% |
$43.04
|
690,680
99.67% of 50 DAV
50 DAV is 693,000
|
$46.66
-8.04%
|
5/15/2014
|
$41.14
|
PP = $43.55
|
|
MB = $45.73
|
Most Recent Note - 7/9/2014 5:48:26 PM
G - Recently slumped below its 50 DMA line with damaging losses. A rebound above the 50 DMA line is needed to help its outlook improve. See the latest FSU analysis for more details and new annotated graphs.
>>> FEATURED STOCK ARTICLE : Violation of 50-Day Moving Average Triggered Technical Sell Signal - 7/9/2014
View all notes |
Set NEW NOTE alert |
CANSLIM.net Company Profile |
SEC
News |
Chart |
Request a new note
C
A N
S L
I M
|
HF
-
NYSE
H F F Inc Cl A
REAL ESTATE - Property Management/Developmen
|
$36.33
|
-0.51
-1.38% |
$37.23
|
136,102
68.74% of 50 DAV
50 DAV is 198,000
|
$38.23
-4.97%
|
6/20/2014
|
$34.60
|
PP = $36.16
|
|
MB = $37.97
|
Most Recent Note - 7/9/2014 5:52:33 PM
Y - Managed a positive reversal today and finished near the session high with a gain on above average volume. Color code was changed to yellow after retreating below its "max buy" level. Prior highs in the $35-36 area define initial support to watch on pullbacks.
>>> FEATURED STOCK ARTICLE : Approached 52-Week High With Volume-Driven Gain - 6/23/2014
View all notes |
Set NEW NOTE alert |
CANSLIM.net Company Profile |
SEC
News |
Chart |
Request a new note
C
A N
S L
I M
|
ICON
-
NASDAQ
Iconix Brand Group Inc
CONSUMER NON-DURABLES - Textile - Apparel Footwear
|
$41.90
|
+0.22
0.53% |
$42.15
|
160,813
30.81% of 50 DAV
50 DAV is 522,000
|
$44.81
-6.49%
|
6/5/2014
|
$43.54
|
PP = $43.44
|
|
MB = $45.61
|
Most Recent Note - 7/11/2014 5:33:17 PM
G - Color code is changed to green after slumping below its 50 DMA line this week with losses on lighter volume. More damaging losses would raise greater concerns, meanwhile a rebound above the 50 DMA line is needed to help its outlook improve. See the latest FSU analysis for more details and new annotated graphs.
>>> FEATURED STOCK ARTICLE : Slump Below 50-Day Moving Average Line Hurt Outlook - 7/11/2014
View all notes |
Set NEW NOTE alert |
CANSLIM.net Company Profile |
SEC
News |
Chart |
Request a new note
C
A N
S L
I M
|
PANW
-
NYSE
Palo Alto Networks
Computer Sftwr-Security
|
$76.22
|
-0.70
-0.91% |
$77.59
|
1,017,028
54.15% of 50 DAV
50 DAV is 1,878,000
|
$85.78
-11.14%
|
5/29/2014
|
$75.95
|
PP = $72.50
|
|
MB = $76.13
|
Most Recent Note - 7/10/2014 6:11:04 PM
G - Managed a "positive reversal" today after slumping near its 50 DMA line. Further deterioration would raise more serious concerns.
>>> FEATURED STOCK ARTICLE : Gap Up Gain on Above Average Volume for New Highs - 6/30/2014
View all notes |
Set NEW NOTE alert |
CANSLIM.net Company Profile |
SEC
News |
Chart |
Request a new note
C
A N
S L
I M
|
SN
-
NYSE
Sanchez Energy Corp
ENERGY - Independent Oil and Gas
|
$33.69
|
+0.77
2.34% |
$34.20
|
1,230,003
78.90% of 50 DAV
50 DAV is 1,559,000
|
$38.95
-13.50%
|
5/22/2014
|
$33.00
|
PP = $31.59
|
|
MB = $33.17
|
Most Recent Note - 7/11/2014 5:36:20 PM
G - Slumped to a close just below its 50 DMA line with today's 8th consecutive loss on lighter than average volume. Prior highs near $32 defined important support to watch while more damaging losses would raise greater concerns.
>>> FEATURED STOCK ARTICLE : Recently Featured Stock Outpaced Benchmark S&P 500 Index - 7/3/2014
View all notes |
Set NEW NOTE alert |
CANSLIM.net Company Profile |
SEC
News |
Chart |
Request a new note
C
A N
S L
I M
|
Symbol/Exchange
Company Name
Industry Group |
PRICE |
CHANGE
(%Change) |
Day High |
Volume
(% DAV)
(% 50 day avg vol) |
52 Wk Hi
% From Hi |
Featured
Date |
Price
Featured |
Pivot Featured |
|
Max Buy |
TARO
-
NYSE
Taro Pharmaceutical Inds
DRUGS - Drug Manufacturers - Other
|
$149.31
|
+3.56
2.44% |
$149.89
|
82,484
124.98% of 50 DAV
50 DAV is 66,000
|
$148.00
0.89%
|
6/26/2014
|
$117.31
|
PP = $118.90
|
|
MB = $124.85
|
Most Recent Note - 7/14/2014 6:25:21 PM
G - Hit a new all-time high with today's 3rd consecutive gain, getting more extended from its prior base. Disciplined investors avoid chasing stocks more than +5% above prior highs.
>>> FEATURED STOCK ARTICLE : Fundamentally Strong Stock Challenging Prior Resistance Level - 6/26/2014
View all notes |
Set NEW NOTE alert |
CANSLIM.net Company Profile |
SEC
News |
Chart |
Request a new note
C
A N
S L
I M
|
TRN
-
NYSE
Trinity Industries Inc
TRANSPORTATION - Railroads
|
$44.72
|
+0.38
0.86% |
$45.00
|
1,855,189
57.15% of 50 DAV
50 DAV is 3,246,000
|
$46.00
-2.78%
|
4/30/2014
|
$37.79
|
PP = $38.03
|
|
MB = $39.93
|
Most Recent Note - 7/8/2014 6:18:09 PM
G - Consolidating near its 52-week high, extended from its prior base. Its 50 DMA line defines important near-term support to watch. See the latest FSU analysis for more details and new annotated graphs.
>>> FEATURED STOCK ARTICLE : Bullish Up/Down Volume and Increasing Institutional Ownership - 7/8/2014
View all notes |
Set NEW NOTE alert |
CANSLIM.net Company Profile |
SEC
News |
Chart |
Request a new note
C
A N
S L
I M
|
UA
-
NYSE
Under Armour Inc Cl A
CONSUMER NON-DURABLES - Textile - Apparel Clothing
|
$58.98
|
+0.24
0.41% |
$59.30
|
1,110,628
40.92% of 50 DAV
50 DAV is 2,714,000
|
$62.40
-5.47%
|
7/10/2014
|
$58.50
|
PP = $60.79
|
|
MB = $63.83
|
Most Recent Note - 7/10/2014 6:05:46 PM
Y - Quarterly earnings comparisons have been above the +25% guideline (C criteria) through Mar '14 and its annual earnings (A criteria) history has been strong. It was highlighted in yellow with pivot point based on its 7/01/14 high in the earlier mid-day report (read here) trading near its 52-week high, forming a handle on the right side of a 17-week cup-with-handle base. Subsequent volume-driven gains above the pivot point are needed to trigger a proper technical buy signal. See the latest FSU analysis for more details and new annotated graphs.
>>> FEATURED STOCK ARTICLE : Forming Handle on Cup-With-Handle Base Pattern - 7/10/2014
View all notes |
Set NEW NOTE alert |
CANSLIM.net Company Profile |
SEC
News |
Chart |
Request a new note
C
A N
S L
I M
|
WLK
-
NYSE
Westlake Chemical Corp
CHEMICALS - Specialty Chemicals
|
$84.65
|
-0.99
-1.16% |
$86.13
|
464,033
72.51% of 50 DAV
50 DAV is 640,000
|
$85.94
-1.50%
|
4/29/2014
|
$72.79
|
PP = $69.31
|
|
MB = $72.78
|
Most Recent Note - 7/14/2014 6:23:40 PM
G - Hovering near its 52-week high, extended from any sound base pattern. Its 50 DMA line ($80.57) defines important near-term support to watch on pullbacks.
>>> FEATURED STOCK ARTICLE : Great Ranks and Reassuring Leadership in Chemical Group - 7/7/2014
View all notes |
Set NEW NOTE alert |
CANSLIM.net Company Profile |
SEC
News |
Chart |
Request a new note
C
A N
S L
I M
|
|
|
|
THESE ARE NOT BUY RECOMMENDATIONS!
Comments contained in the body of this report are technical
opinions only. The material herein has been obtained
from sources believed to be reliable and accurate, however,
its accuracy and completeness cannot be guaranteed.
This site is not an investment advisor, hence it does
not endorse or recommend any securities or other investments.
Any recommendation contained in this report may not
be suitable for all investors and it is not to be deemed
an offer or solicitation on our part with respect to
the purchase or sale of any securities. All trademarks,
service marks and trade names appearing in this report
are the property of their respective owners, and are
likewise used for identification purposes only.
This report is a service available
only to active Paid Premium Members.
You may opt-out of receiving report notifications
at any time. Questions or comments may be submitted
by writing to Premium Membership Services 665 S.E. 10 Street, Suite 201 Deerfield Beach, FL 33441-5634 or by calling 1-800-965-8307
or 954-785-1121.
|
|
|

