You are not logged in.
This means you
CAN ONLY VIEW reports that were published prior to Monday, April 28, 2025.
You
MUST UPGRADE YOUR MEMBERSHIP if you want to see any current reports.
AFTER MARKET UPDATE - FRIDAY, JULY 11TH, 2014
Previous After Market Report Next After Market Report >>>
|
|
|
|
DOW |
+28.74 |
16,943.81 |
+0.17% |
|
Volume |
570,887,300 |
-11% |
|
Volume |
1,420,888,180 |
-10% |
|
NASDAQ |
+19.29 |
4,415.49 |
+0.44% |
|
Advancers |
1,667 |
53% |
|
Advancers |
1,342 |
48% |
|
S&P 500 |
+2.89 |
1,967.57 |
+0.15% |
|
Decliners |
1,376 |
44% |
|
Decliners |
1,349 |
48% |
|
Russell 2000 |
-1.93 |
1,159.93 |
-0.17% |
|
52 Wk Highs |
105 |
|
|
52 Wk Highs |
31 |
|
|
S&P 600 |
-2.07 |
667.14 |
-0.31% |
|
52 Wk Lows |
18 |
|
|
52 Wk Lows |
31 |
|
|
 |
Indices Posted Gains With Lighter Volume After Distributional Pressure
Kenneth J. Gruneisen - Passed the CAN SLIM® Master's Exam
The Dow Jones Industrial Average finished with a weekly loss of -0.7%, the S&P 500 Index declined -0.9% and the Nasdaq Composite Index fell -1.6%. The major averages overcame early weakness on Friday and finished higher, but small-caps lagged. Volume on the session was lighter than the prior session volume totals on the NYSE and on the Nasdaq exchange. Breadth was narrowly positive as advancers led decliners by an 8-7 margin on the NYSE while the mix was even on the Nasdaq exchange. There were 16 high-ranked companies from the CANSLIM.net Leaders List that made new 52-week highs and appeared on the CANSLIM.net BreakOuts Page, up a notch from the prior session total of 15 stocks. New 52-week highs outnumbered new 52-week lows on the NYSE while new highs and new lows were evenly matched on the Nasdaq exchange. There were gains for 12 of the 15 high-ranked companies currently included on the Featured Stocks Page. The market (M criteria) uptrend clearly came under pressure this week while leadership quickly evaporated. Any new buying efforts should be selective and focused in stocks meeting all key criteria of the fact-based investment system.
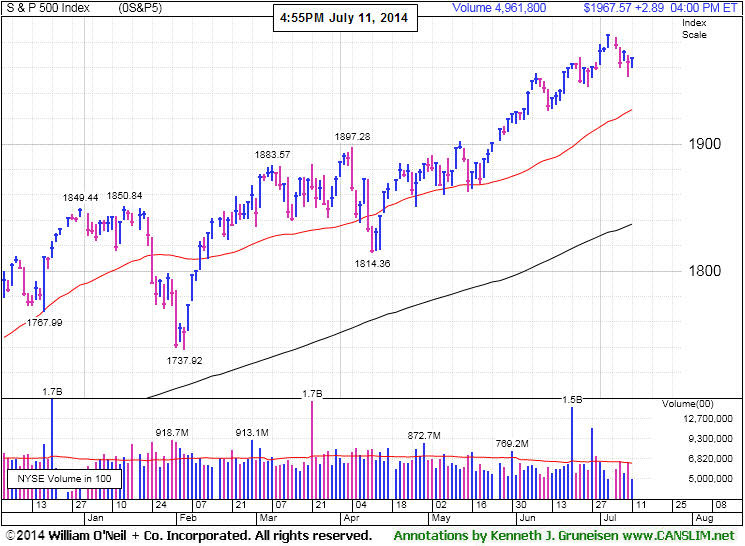
PICTURED: The S&P 500 Index is consolidating -0.9% off its all-time high, up +6.4% year-to-date.
Stocks spent the day toggling between gains and losses before second-quarter earnings season ramps up next week. There are 130 companies in the S&P 500 due to release results over the next two weeks. Wall Street estimates project earnings growth of 6.1% and revenues to rise 3% for the benchmark index, according to Thomson Reuters.
Eight of the 10 S&P 500 sectors closed in positive territory. Industrials and telecom were the best performing groups as General Electric (GE +1.3%) and Verizon (VZ +1.3%) rose. Technology stocks also advanced, led by Facebook (FB +2.2%). Losses in energy and utilities limited the indices' gains. Chevron (CVX -1.3%) fell after the company said its second-quarter production will decline from a year earlier, amid lower output overseas. Exelon (EXC -1.7%) also fell.
Treasuries continued their recent winning streak. The 10-year note rose 5/32 to yield 2.52%. The 30-year bond gained 18/32 to yield 3.34%.
The CANSLIM.net Featured Stocks Page shows the most action-worthy candidates and their latest notes and a Headline Link directs members to the latest detailed analysis with data-packed graphs annotated by a Certified expert along with links to additional resources. The Premium Member Homepage includes "dynamic archives" to all prior pay reports published. Watch for an announcement via email concerning the next WEBCAST.
|
 Kenneth J. Gruneisen started out as a licensed stockbroker in August 1987, a couple of months prior to the historic stock market crash that took the Dow Jones Industrial Average down -22.6% in a single day. He has published daily fact-based fundamental and technical analysis on high-ranked stocks online for two decades. Through FACTBASEDINVESTING.COM, Kenneth provides educational articles, news, market commentary, and other information regarding proven investment systems that work in good times and bad.
Comments contained in the body of this report are technical opinions only and are not necessarily those of Gruneisen Growth Corp. The material herein has been obtained from sources believed to be reliable and accurate, however, its accuracy and completeness cannot be guaranteed. Our firm, employees, and customers may effect transactions, including transactions contrary to any recommendation herein, or have positions in the securities mentioned herein or options with respect thereto. Any recommendation contained in this report may not be suitable for all investors and it is not to be deemed an offer or solicitation on our part with respect to the purchase or sale of any securities. |
|
 |
Retail, Financial, Biotech, and Gold & Silver Index Rose
Kenneth J. Gruneisen - Passed the CAN SLIM® Master's Exam
The Retail Index ($RLX +0.88%) was a positive influence on the major averages while the Broker/Dealer Index ($XBD +0.61%) and the Bank Index ($BKX +0.20%) posted smaller gains. The Biotechnology Index ($BTK +1.00%) led the tech sector higher while the Semiconductor Index ($SOX +0.06%) and the Networking Index ($NWX +0.09%) finished flat. The Gold & Silver Index ($XAU +2.31%) was a standout gainer. Energy-related groups edged lower as the Oil Services Index ($OSX -0.64%) and the Integrated Oil Index ($XOI -0.37%) suffered modest losses.
Charts courtesy www.stockcharts.com
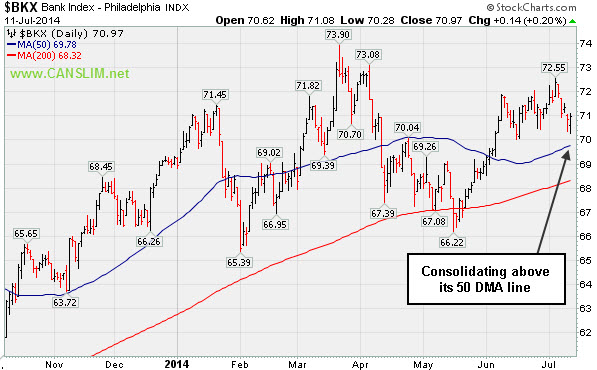
PICTURED 1: The Bank Index ($BKX +0.20%) is consolidating above its 50-day moving average (DMA) line.
Charts courtesy www.stockcharts.com
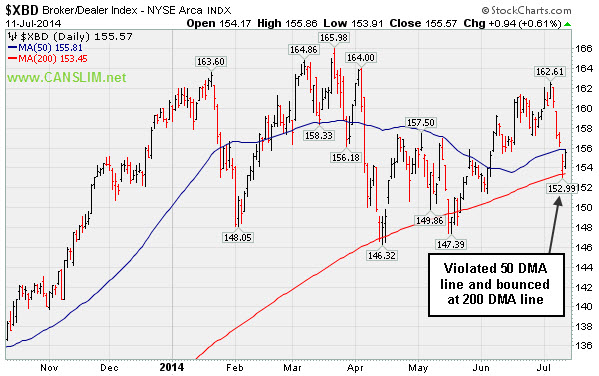
PICTURED 2: The Broker/Dealer Index ($XBD +0.61%) violated its 50 DMA line and bounced at its 200 DMA line.
| Oil Services |
$OSX |
301.04 |
-1.95 |
-0.64% |
+7.12% |
| Integrated Oil |
$XOI |
1,656.93 |
-6.23 |
-0.37% |
+10.23% |
| Semiconductor |
$SOX |
643.88 |
+0.41 |
+0.06% |
+20.34% |
| Networking |
$NWX |
330.43 |
+0.31 |
+0.09% |
+2.00% |
| Broker/Dealer |
$XBD |
155.57 |
+0.94 |
+0.61% |
-3.11% |
| Retail |
$RLX |
899.40 |
+7.85 |
+0.88% |
-4.30% |
| Gold & Silver |
$XAU |
104.07 |
+2.35 |
+2.31% |
+23.67% |
| Bank |
$BKX |
70.97 |
+0.14 |
+0.20% |
+2.47% |
| Biotech |
$BTK |
2,794.38 |
+27.61 |
+1.00% |
+19.91% |
|
|
|
 |
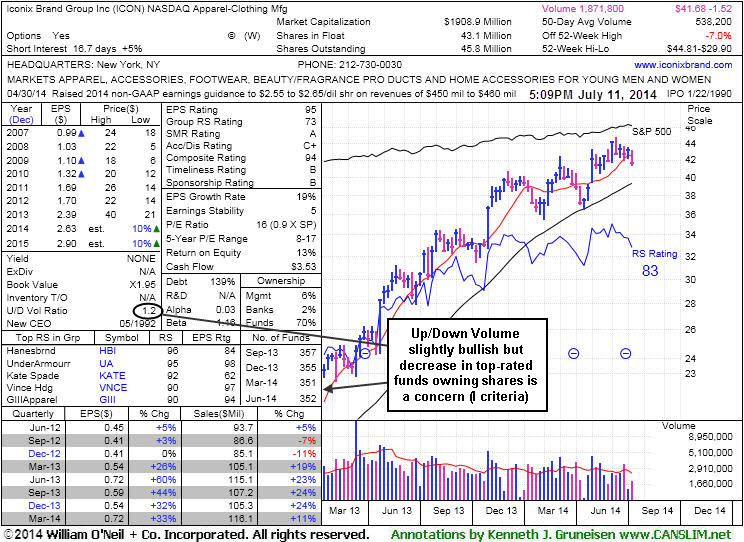
Slump Below 50-Day Moving Average Line Hurt Outlook
Kenneth J. Gruneisen - Passed the CAN SLIM® Master's Exam
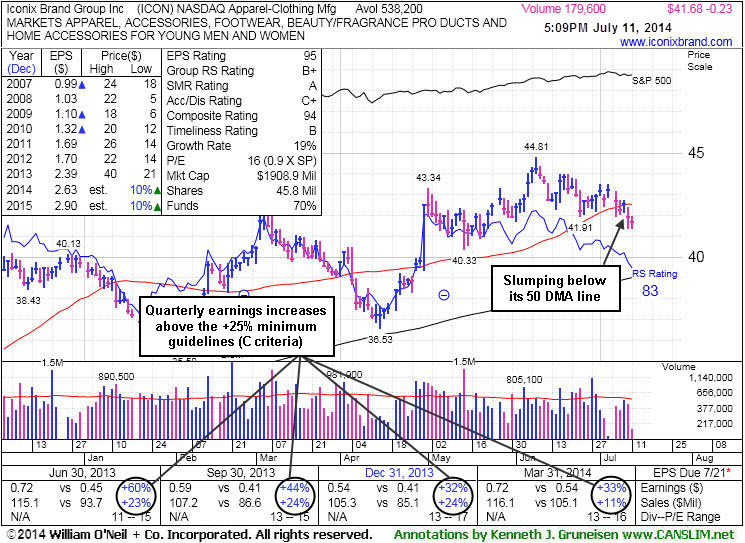
Iconix Brand Group Inc (ICON -$0.23 or -0.55% to $41.68) slumped further below its 50-day moving average (DMA) line ($42.53) this week with losses on lighter than average volume. Its failure to find support at that important short-term average raised concerns, and a prompt rebound above the 50 DMA line is needed for its outlook to improve. More damaging losses would raise greater concerns.
The stock was last shown in this FSU section on 6/18/14 with annotated graphs under the headline, "Found Support Above Prior Highs During Consolidation". It made little headway following its recent technical breakout and stalled after rallying above prior highs in the $42 area. Disciplined investors limit losses while they are small by always selling if any stock falls more than -7% from their purchase price.
It reported earnings +33% on +11% sales revenues for the Mar '14 quarter, continuing its streak of earning increases above the +25% minimum guideline (C criteria). Fundamentals remain strong for the high-ranked Apparel - Clothing Manufacturing firm. Its annual earnings (A criteria) history has been steady. It has earned a 95 Earnings Per Share Rating (EPS) which suggests that its recent earnings growth history has been stellar. Its Relative Strength rating is 83, above the 80+ minimum rank for buy candidates under the fact-based system. The number of top-rated funds owning its shares fell from 357 in Sep '13 to 352 in Jun '14, not a reassuring sign concerning the I criteria. However, its current Up/Down Volume Ratio of b is a unbiased indication its shares have seen some slight accumulation over the past 50 days.
|
|
|
Color Codes Explained :
Y - Better candidates highlighted by our
staff of experts.
G - Previously featured
in past reports as yellow but may no longer be buyable under the
guidelines.
***Last / Change / Volume data in this table is the closing quote data***
Symbol/Exchange
Company Name
Industry Group |
PRICE |
CHANGE
(%Change) |
Day High |
Volume
(% DAV)
(% 50 day avg vol) |
52 Wk Hi
% From Hi |
Featured
Date |
Price
Featured |
Pivot Featured |
|
Max Buy |
ACT
-
NYSE
Actavis plc
Medical-Generic Drugs
|
$217.65
|
+1.13
0.52% |
$217.80
|
1,067,123
46.50% of 50 DAV
50 DAV is 2,295,000
|
$230.77
-5.69%
|
6/20/2014
|
$216.53
|
PP = $230.87
|
|
MB = $242.41
|
Most Recent Note - 7/7/2014 4:33:29 PM
Y - Still hovering within close striking distance of its 52-week high. Subsequent volume-driven gains to new highs may trigger a technical buy signal.
>>> FEATURED STOCK ARTICLE : Volume Above Average as Generic Drug Firm Approaches Highs - 6/24/2014
View all notes |
Set NEW NOTE alert |
CANSLIM.net Company Profile |
SEC
News |
Chart |
Request a new note
C
A N
S L
I M


|
AFSI
-
NASDAQ
Amtrust Financial Svcs
INSURANCE - Property and; Casualty Insurance
|
$41.23
|
+0.60
1.48% |
$41.31
|
356,687
50.62% of 50 DAV
50 DAV is 704,700
|
$47.10
-12.46%
|
5/21/2014
|
$44.85
|
PP = $44.85
|
|
MB = $47.09
|
Most Recent Note - 7/7/2014 11:58:46 AM
G - Slumping below its 50 DMA line with heavier volume behind today's loss. Faces some resistance due to overhead supply up through the $47 level.
>>> FEATURED STOCK ARTICLE : Found Support Near 50-Day Average and Relative Strength Slightly Improved - 7/1/2014
View all notes |
Set NEW NOTE alert |
CANSLIM.net Company Profile |
SEC
News |
Chart |
Request a new note
C
A N
S L
I M
|
AL
-
NYSE
Air Lease Corp Cl A
DIVERSIFIED SERVICES - Rental and Leasing Services
|
$36.71
|
+0.30
0.82% |
$36.84
|
623,466
57.82% of 50 DAV
50 DAV is 1,078,200
|
$42.89
-14.41%
|
5/9/2014
|
$38.27
|
PP = $38.25
|
|
MB = $40.16
|
 Most Recent Note - 7/11/2014 5:39:50 PM
Violation of its prior low ($36.55 on 6/13/17) raised more serious concerns and triggered more worrisome technical sell signals this week. It will be dropped from the Featured Stocks list tonight.
>>> FEATURED STOCK ARTICLE : Finding Support Near 50-Day Moving Average Line - 7/2/2014
View all notes |
Set NEW NOTE alert |
CANSLIM.net Company Profile |
SEC
News |
Chart |
Request a new note
C
A N
S L
I M
|
BITA
-
NYSE
Bitauto Hldgs Ltd Ads
Internet-Content
|
$50.67
|
+2.61
5.43% |
$51.25
|
1,590,902
169.43% of 50 DAV
50 DAV is 939,000
|
$49.67
2.01%
|
6/26/2014
|
$46.20
|
PP = $47.03
|
|
MB = $49.38
|
Most Recent Note - 7/11/2014 12:11:00 PM
G - Touched a new 52-week high today after rebounding above its "max buy" level and its color code is changed to green. Managed a "positive reversal" on the prior session after trading down considerably, likely prompting disciplined investors to sell if it fell more than -7% from their purchase price. Any stock which is sold can be bought back later if strength returns, however rule number one is to always limit losses while they are small.
>>> FEATURED STOCK ARTICLE : Perched At High With No Resistance Remaining Due to Overhead Supply - 6/27/2014
View all notes |
Set NEW NOTE alert |
CANSLIM.net Company Profile |
SEC
News |
Chart |
Request a new note
C
A N
S L
I M
|
BWLD
-
NASDAQ
Buffalo Wild Wings Inc
LEISURE - Restaurants
|
$156.08
|
-1.18
-0.75% |
$157.24
|
208,482
51.10% of 50 DAV
50 DAV is 408,000
|
$167.36
-6.74%
|
6/19/2014
|
$158.52
|
PP = $159.91
|
|
MB = $167.91
|
Most Recent Note - 7/8/2014 12:40:06 PM
Y - Pulling back today amid widespread weakness. Deterioration leading to a close below the prior high close ($156.35 on 3/21/14) would raise greater concerns and completely negate the recent technical breakout.
>>> FEATURED STOCK ARTICLE : Perched Near Highs With Strong Fundamentals - 6/19/2014
View all notes |
Set NEW NOTE alert |
CANSLIM.net Company Profile |
SEC
News |
Chart |
Request a new note
C
A N
S L
I M
|
Symbol/Exchange
Company Name
Industry Group |
PRICE |
CHANGE
(%Change) |
Day High |
Volume
(% DAV)
(% 50 day avg vol) |
52 Wk Hi
% From Hi |
Featured
Date |
Price
Featured |
Pivot Featured |
|
Max Buy |
EQM
-
NYSE
E Q T Midstream Partners
ENERGY - Oil and Gas Pipelines
|
$94.06
|
+0.80
0.86% |
$94.23
|
111,986
25.74% of 50 DAV
50 DAV is 435,000
|
$102.51
-8.24%
|
12/12/2013
|
$53.17
|
PP = $56.51
|
|
MB = $59.34
|
Most Recent Note - 7/9/2014 5:54:24 PM
G - Still consolidating well above its 50 DMA line. Strength has continued despite fundamental flaws repeatedly noted.
>>> FEATURED STOCK ARTICLE : Strength Continued Despite Fundamental Flaws - 6/25/2014
View all notes |
Set NEW NOTE alert |
CANSLIM.net Company Profile |
SEC
News |
Chart |
Request a new note
C
A N
S L
I M
|
GRFS
-
NASDAQ
Grifols Sa Ads
Medical-Ethical Drugs
|
$41.68
|
+1.07
2.63% |
$41.72
|
828,993
120.84% of 50 DAV
50 DAV is 686,000
|
$46.66
-10.67%
|
5/15/2014
|
$41.14
|
PP = $43.55
|
|
MB = $45.73
|
Most Recent Note - 7/9/2014 5:48:26 PM
G - Recently slumped below its 50 DMA line with damaging losses. A rebound above the 50 DMA line is needed to help its outlook improve. See the latest FSU analysis for more details and new annotated graphs.
>>> FEATURED STOCK ARTICLE : Violation of 50-Day Moving Average Triggered Technical Sell Signal - 7/9/2014
View all notes |
Set NEW NOTE alert |
CANSLIM.net Company Profile |
SEC
News |
Chart |
Request a new note
C
A N
S L
I M
|
HF
-
NYSE
H F F Inc Cl A
REAL ESTATE - Property Management/Developmen
|
$36.84
|
+0.29
0.79% |
$37.06
|
187,989
94.47% of 50 DAV
50 DAV is 199,000
|
$38.23
-3.64%
|
6/20/2014
|
$34.60
|
PP = $36.16
|
|
MB = $37.97
|
Most Recent Note - 7/9/2014 5:52:33 PM
Y - Managed a positive reversal today and finished near the session high with a gain on above average volume. Color code was changed to yellow after retreating below its "max buy" level. Prior highs in the $35-36 area define initial support to watch on pullbacks.
>>> FEATURED STOCK ARTICLE : Approached 52-Week High With Volume-Driven Gain - 6/23/2014
View all notes |
Set NEW NOTE alert |
CANSLIM.net Company Profile |
SEC
News |
Chart |
Request a new note
C
A N
S L
I M
|
ICON
-
NASDAQ
Iconix Brand Group Inc
CONSUMER NON-DURABLES - Textile - Apparel Footwear
|
$41.68
|
-0.23
-0.55% |
$41.96
|
179,684
33.40% of 50 DAV
50 DAV is 538,000
|
$44.81
-6.99%
|
6/5/2014
|
$43.54
|
PP = $43.44
|
|
MB = $45.61
|
Most Recent Note - 7/11/2014 5:33:17 PM
G - Color code is changed to green after slumping below its 50 DMA line this week with losses on lighter volume. More damaging losses would raise greater concerns, meanwhile a rebound above the 50 DMA line is needed to help its outlook improve. See the latest FSU analysis for more details and new annotated graphs.
>>> FEATURED STOCK ARTICLE : Slump Below 50-Day Moving Average Line Hurt Outlook - 7/11/2014
View all notes |
Set NEW NOTE alert |
CANSLIM.net Company Profile |
SEC
News |
Chart |
Request a new note
C
A N
S L
I M
|
PANW
-
NYSE
Palo Alto Networks
Computer Sftwr-Security
|
$76.92
|
+0.21
0.27% |
$78.18
|
1,364,939
72.95% of 50 DAV
50 DAV is 1,871,000
|
$85.78
-10.33%
|
5/29/2014
|
$75.95
|
PP = $72.50
|
|
MB = $76.13
|
Most Recent Note - 7/10/2014 6:11:04 PM
G - Managed a "positive reversal" today after slumping near its 50 DMA line. Further deterioration would raise more serious concerns.
>>> FEATURED STOCK ARTICLE : Gap Up Gain on Above Average Volume for New Highs - 6/30/2014
View all notes |
Set NEW NOTE alert |
CANSLIM.net Company Profile |
SEC
News |
Chart |
Request a new note
C
A N
S L
I M
|
Symbol/Exchange
Company Name
Industry Group |
PRICE |
CHANGE
(%Change) |
Day High |
Volume
(% DAV)
(% 50 day avg vol) |
52 Wk Hi
% From Hi |
Featured
Date |
Price
Featured |
Pivot Featured |
|
Max Buy |
SN
-
NYSE
Sanchez Energy Corp
ENERGY - Independent Oil and Gas
|
$32.92
|
-1.33
-3.88% |
$34.28
|
1,255,661
81.06% of 50 DAV
50 DAV is 1,549,000
|
$38.95
-15.48%
|
5/22/2014
|
$33.00
|
PP = $31.59
|
|
MB = $33.17
|
Most Recent Note - 7/11/2014 5:36:20 PM
G - Slumped to a close just below its 50 DMA line with today's 8th consecutive loss on lighter than average volume. Prior highs near $32 defined important support to watch while more damaging losses would raise greater concerns.
>>> FEATURED STOCK ARTICLE : Recently Featured Stock Outpaced Benchmark S&P 500 Index - 7/3/2014
View all notes |
Set NEW NOTE alert |
CANSLIM.net Company Profile |
SEC
News |
Chart |
Request a new note
C
A N
S L
I M
|
TARO
-
NYSE
Taro Pharmaceutical Inds
DRUGS - Drug Manufacturers - Other
|
$145.75
|
+0.45
0.31% |
$148.00
|
48,604
74.78% of 50 DAV
50 DAV is 65,000
|
$146.64
-0.61%
|
6/26/2014
|
$117.31
|
PP = $118.90
|
|
MB = $124.85
|
Most Recent Note - 7/8/2014 1:09:04 PM
G - Perched near its all-time high and stubbornly holding its ground following considerable volume-driven gains, extended from its prior base. Disciplined investors avoid chasing stocks more than +5% above prior highs.
>>> FEATURED STOCK ARTICLE : Fundamentally Strong Stock Challenging Prior Resistance Level - 6/26/2014
View all notes |
Set NEW NOTE alert |
CANSLIM.net Company Profile |
SEC
News |
Chart |
Request a new note
C
A N
S L
I M
|
TRN
-
NYSE
Trinity Industries Inc
TRANSPORTATION - Railroads
|
$44.34
|
+0.31
0.70% |
$44.44
|
1,288,919
38.35% of 50 DAV
50 DAV is 3,361,000
|
$46.00
-3.61%
|
4/30/2014
|
$37.79
|
PP = $38.03
|
|
MB = $39.93
|
Most Recent Note - 7/8/2014 6:18:09 PM
G - Consolidating near its 52-week high, extended from its prior base. Its 50 DMA line defines important near-term support to watch. See the latest FSU analysis for more details and new annotated graphs.
>>> FEATURED STOCK ARTICLE : Bullish Up/Down Volume and Increasing Institutional Ownership - 7/8/2014
View all notes |
Set NEW NOTE alert |
CANSLIM.net Company Profile |
SEC
News |
Chart |
Request a new note
C
A N
S L
I M
|
UA
-
NYSE
Under Armour Inc Cl A
CONSUMER NON-DURABLES - Textile - Apparel Clothing
|
$58.74
|
+0.55
0.95% |
$58.82
|
1,366,297
38.71% of 50 DAV
50 DAV is 3,530,000
|
$62.40
-5.86%
|
7/10/2014
|
$58.50
|
PP = $60.79
|
|
MB = $63.83
|
Most Recent Note - 7/10/2014 6:05:46 PM
Y - Quarterly earnings comparisons have been above the +25% guideline (C criteria) through Mar '14 and its annual earnings (A criteria) history has been strong. It was highlighted in yellow with pivot point based on its 7/01/14 high in the earlier mid-day report (read here) trading near its 52-week high, forming a handle on the right side of a 17-week cup-with-handle base. Subsequent volume-driven gains above the pivot point are needed to trigger a proper technical buy signal. See the latest FSU analysis for more details and new annotated graphs.
>>> FEATURED STOCK ARTICLE : Forming Handle on Cup-With-Handle Base Pattern - 7/10/2014
View all notes |
Set NEW NOTE alert |
CANSLIM.net Company Profile |
SEC
News |
Chart |
Request a new note
C
A N
S L
I M
|
WLK
-
NYSE
Westlake Chemical Corp
CHEMICALS - Specialty Chemicals
|
$85.64
|
+1.28
1.52% |
$85.67
|
473,053
72.33% of 50 DAV
50 DAV is 654,000
|
$85.94
-0.35%
|
4/29/2014
|
$72.79
|
PP = $69.31
|
|
MB = $72.78
|
Most Recent Note - 7/7/2014 5:56:05 PM
G - Perched at its 52-week high, extended from any sound base pattern. Its 50 DMA line defines important near-term support to watch on pullbacks. See the latest FSU analysis for more details and new annotated graphs.
>>> FEATURED STOCK ARTICLE : Great Ranks and Reassuring Leadership in Chemical Group - 7/7/2014
View all notes |
Set NEW NOTE alert |
CANSLIM.net Company Profile |
SEC
News |
Chart |
Request a new note
C
A N
S L
I M
|
Symbol/Exchange
Company Name
Industry Group |
PRICE |
CHANGE
(%Change) |
Day High |
Volume
(% DAV)
(% 50 day avg vol) |
52 Wk Hi
% From Hi |
Featured
Date |
Price
Featured |
Pivot Featured |
|
Max Buy |
|
|
|
THESE ARE NOT BUY RECOMMENDATIONS!
Comments contained in the body of this report are technical
opinions only. The material herein has been obtained
from sources believed to be reliable and accurate, however,
its accuracy and completeness cannot be guaranteed.
This site is not an investment advisor, hence it does
not endorse or recommend any securities or other investments.
Any recommendation contained in this report may not
be suitable for all investors and it is not to be deemed
an offer or solicitation on our part with respect to
the purchase or sale of any securities. All trademarks,
service marks and trade names appearing in this report
are the property of their respective owners, and are
likewise used for identification purposes only.
This report is a service available
only to active Paid Premium Members.
You may opt-out of receiving report notifications
at any time. Questions or comments may be submitted
by writing to Premium Membership Services 665 S.E. 10 Street, Suite 201 Deerfield Beach, FL 33441-5634 or by calling 1-800-965-8307
or 954-785-1121.
|
|
|

