You are not logged in.
This means you
CAN ONLY VIEW reports that were published prior to Monday, April 14, 2025.
You
MUST UPGRADE YOUR MEMBERSHIP if you want to see any current reports.
AFTER MARKET UPDATE - WEDNESDAY, JULY 14TH, 2010
Previous After Market Report Next After Market Report >>>
|
|
|
|
DOW |
+3.70 |
10,366.72 |
+0.04% |
|
Volume |
1,058,601,050 |
-6% |
|
Volume |
2,118,320,870 |
-6% |
|
NASDAQ |
+7.81 |
2,249.84 |
+0.35% |
|
Advancers |
1,322 |
43% |
|
Advancers |
1,102 |
40% |
|
S&P 500 |
-0.17 |
1,095.17 |
-0.02% |
|
Decliners |
1,654 |
53% |
|
Decliners |
1,519 |
55% |
|
Russell 2000 |
-2.66 |
640.16 |
-0.41% |
|
52 Wk Highs |
72 |
|
|
52 Wk Highs |
46 |
|
|
S&P 600 |
-1.47 |
344.32 |
-0.43% |
|
52 Wk Lows |
8 |
|
|
52 Wk Lows |
19 |
|
|
 |
Major Averages End Mixed While News Highs List Expands
Adam Sarhan, Contributing Writer,
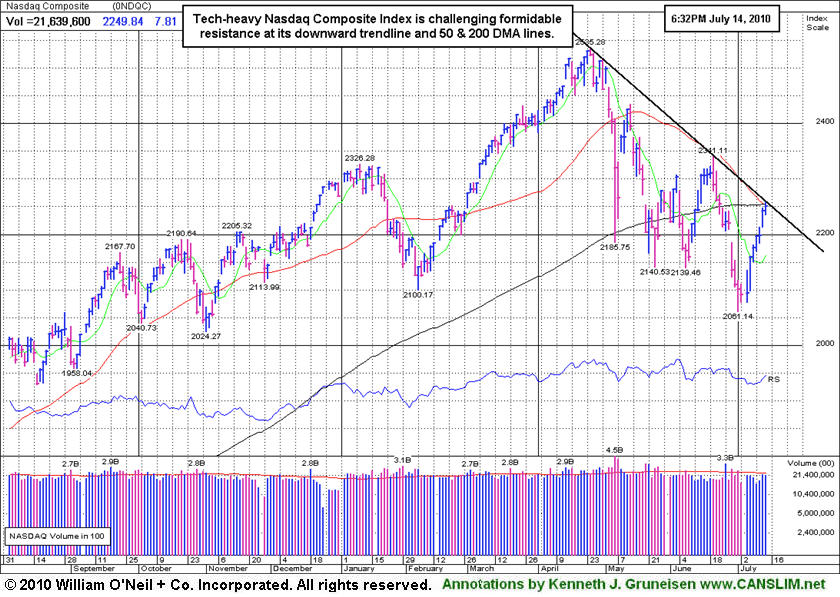
The benchmark S&P 500 Index snapped a streak of 6 straight gains after retail sales fell last month and the Fed released the minutes of its latest meeting. The major averages ended mixed and little changed while volume, a critical component of institutional sponsorship, was reported lower on the Nasdaq and the NYSE. There were 28 high-ranked companies from the CANSLIM.net Leaders List that made a new 52-week high and appeared on the CANSLIM.net BreakOuts Page, higher than the 23 issues that appeared on the prior session. Decliners led advancers by approximately a 4-to-3 ratio on the NYSE and on the Nasdaq exchange. New 52-week highs solidly outnumbered new 52-week lows on the NYSE and the Nasdaq exchange.
The Commerce Department said retail sales fell -0.5% last month which topped the Street's estimate and followed a -1.1% decline in May. Most of the decline came from the ailing automobile sector, excluding auto dealers, demand fell -0.1% which matched the median estimate. Elsewhere, the Federal Reserve released the minutes of its latest meeting which showed a less than stellar economic outlook. Fed officials said the economy has “softened” which sparked concern of a double dip recession.
Looking forward, the window remains open for disciplined investors to carefully buy high-ranked stocks. Since the current rally began on July 1, the major averages have rallied on suspiciously light volume for the most part. It is ideal to see volume expand as the major averages break above resistance and see a new batch of high ranked leaders trigger fresh technical buy signals. These latest improvements are helping to confirm this nascent rally and provide a reassurance that odds are more favorable for successful investing using the fact-based system.
PICTURED: The tech-heavy Nasdaq Composite Index posted a 7th consecutive gain. It has rallied up to formidable resistance at a downward trendline and its 50-day and 200-day moving average (DMA) lines.
|
|
|
 |
Healthcare Group Among Session's Standout Gainers
Kenneth J. Gruneisen - Passed the CAN SLIM® Master's Exam
The best group gainers on Wednesday were the Healthcare Index ($HMO +1.97%) and tech groups including the Networking Index ($NWX +1.85%) and Internet Index ($IIX +0.85%), but the Semiconductor Index ($SOX -0.27%) and Biotechnology Index ($BTK -0.20%) ended the day with slight losses. The Bank Index ($BKX -1.61%) had a negative influence on the major averages and the Broker/Dealer Index ($XBD -0.55%) and Retail Index ($RLX -0.76%) also created a drag. The Integrated Oil Index ($XOI -0.60%) also lost ground while the Gold & Silver Index ($XAU -0.14%) and Oil Services Index ($OSX +0.06%) finished the session near unchanged.
Charts courtesy www.stockcharts.com
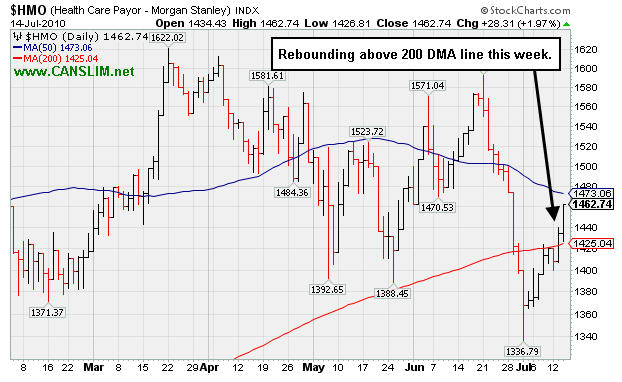
PICTURED: The Healthcare Index ($HMO +1.97%) is rebounding above its 200-day moving average (DMA) line this week.
| Oil Services |
$OSX |
177.85 |
+0.10 |
+0.06% |
-8.76% |
| Healthcare |
$HMO |
1,462.74 |
+28.31 |
+1.97% |
-0.69% |
| Integrated Oil |
$XOI |
961.90 |
-5.77 |
-0.60% |
-9.95% |
| Semiconductor |
$SOX |
361.86 |
-0.97 |
-0.27% |
+0.54% |
| Networking |
$NWX |
245.84 |
+4.46 |
+1.85% |
+6.39% |
| Internet |
$IIX |
243.08 |
+2.05 |
+0.85% |
+3.94% |
| Broker/Dealer |
$XBD |
102.97 |
-0.57 |
-0.55% |
-10.50% |
| Retail |
$RLX |
401.08 |
-3.09 |
-0.76% |
-2.44% |
| Gold & Silver |
$XAU |
173.79 |
-0.24 |
-0.14% |
+3.29% |
| Bank |
$BKX |
50.15 |
-0.82 |
-1.61% |
+17.42% |
| Biotech |
$BTK |
1,046.40 |
-2.13 |
-0.20% |
+11.07% |
|
|
|
 |
Longer Base Pattern Has Bullish Potential
Kenneth J. Gruneisen - Passed the CAN SLIM® Master's Exam
The current market (M criteria) conditions have improved since the July 7th follow-through-day confirmed a new rally. That is a green light for investors, but not a reason to select stocks with flaws in their bases. Investors usually have the best odds when they remain disciplined and trade based upon the long-standing guidelines of the fact-based investment system. A proper breakout requires a sound base pattern followed by gains above the stock's pivot point backed by at least +50% above average volume.
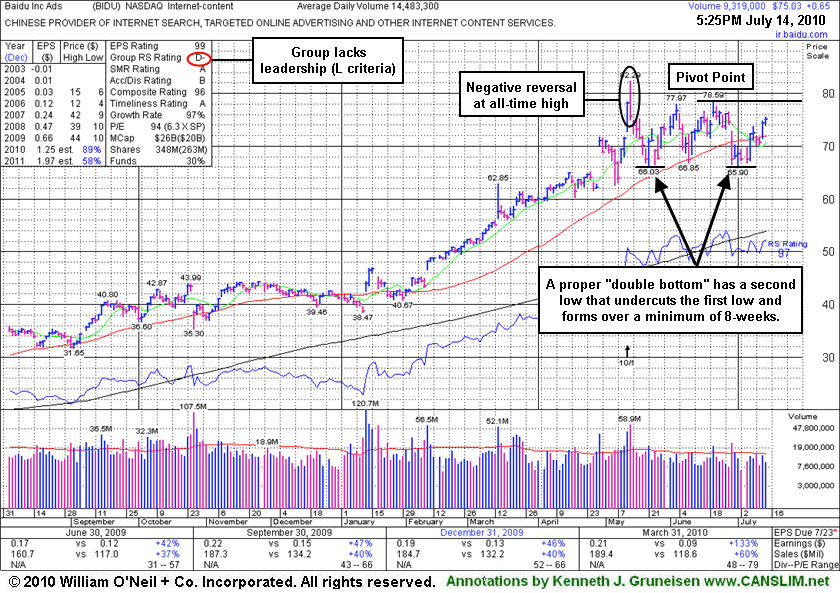
High-ranked Internet - Content firm Baidu.com, Inc. (BIDU +$0.65 or +0.87% to $75.03) edged higher today with a tiny gain on below average volume. Its color code is changed to yellow with new pivot point based on its 6/21/10 high ($78.59) as it is working on a 10-week double bottom type pattern. Gains for a new high close above recent resistance in the $78 area would be an encouraging sign, meanwhile recent lows in the $66 area define important chart support.
When it last appeared in this FSU section on 6/21/10 under the headline "Usually Not Ideal Choices When Base Pattern Has Flaws" with an annotated graph it had finished the session below its 6/03/10 high (and closing price) while we explained - "In the paper it was recently labeled an 'irregular double bottom' pattern with a pivot point based upon that day's high plus ten cents. Others might chose to call it a choppy 6-week base with a higher pivot point based upon its all-time high, or they might simply wait for a better base pattern to eventually form." Since that time a damaging gap down on 6/29/10 sent it under its 50-day moving average (DMA) line, yet it has subsequently rebounded back above that important short-term average with gains on light or near average volume. It has formed a better base of sufficient length and briefly undercut an earlier low, giving its base the right characteristics for an ideal set-up. Time will tell if a burst of buying demand might meet the guidelines to trigger a solid buy signal, meanwhile more patience is required.
BIDU has a stellar sales and earnings history that satisfies the C & A criteria, in fact, the quarter ended March 31, 2010 showed sales revenues and earnings growth accelerating impressively. The number of top-rated funds owning shares is being reported at 203 in Dec '09, and 201 in Jun '10, not a strong trend with respect to institutional ownership (I criteria). Another concern that makes it a less favorable candidate under the system guidelines is the lack of leadership (L criteria) in the group, with the Internet - Content group RS rating a 9 now, very low on the 1-99 scale.
Volume totals cooled behind recent distribution days since its worrisome negative reversal from its all-time high on 5/13/10. Its share price was impacted by a 10:1 stock split as of 5/12/10, and the split reduced the share price while it greatly increased the supply of shares (S criteria) outstanding. The best market winners typically has smaller supplies closer to its pre-split levels.
Keep in mind that BIDU has traded up more than 8-fold, and it has not been a smooth ride since it first featured on Monday, October 30, 2006 in the CANSLIM.net Mid Day Breakouts Report (read here). After making great progress it went through a multi-month consolidation under its 50 and 20 DMA lines, then later returned as a noteworthy leader featured in CANSLIM.net reports. An annotated graph showed a vivid picture at the beginning of the stock's period of greatest weakness back on January 11, 2008 under the headline, "Weakness Hurting Chances For Featured Favorite" (read here). Take a look back at that now! Remember that a dropped stock can be featured again in a future CANSLIM.net report if it repairs its technical damage and forms a new pivot point.
|
|
|
Color Codes Explained :
Y - Better candidates highlighted by our
staff of experts.
G - Previously featured
in past reports as yellow but may no longer be buyable under the
guidelines.
***Last / Change / Volume data in this table is the closing quote data***
Symbol/Exchange
Company Name
Industry Group |
PRICE |
CHANGE
(%Change) |
Day High |
Volume
(% DAV)
(% 50 day avg vol) |
52 Wk Hi
% From Hi |
Featured
Date |
Price
Featured |
Pivot Featured |
|
Max Buy |
AAPL
-
NASDAQ
Apple Inc
COMPUTER HARDWARE - Personal Computers
|
$252.73
|
+0.93
0.37% |
$255.80
|
28,996,846
101.48% of 50 DAV
50 DAV is 28,572,800
|
$279.01
-9.42%
|
6/17/2010
|
$270.95
|
PP = $272.56
|
|
MB = $286.19
|
 Most Recent Note - 7/14/2010 4:52:13 PM
G - Held its ground today following a 7/13/10 loss on heavier than average volume and close below its 50 DMA line. Recent gains lacked volume after it failed to trigger a proper technical buy signal and then encountered heavy distributional pressure. Recent lows in the $242-243 area define important chart support to watch.
>>> The latest Featured Stock Update with an annotated graph appeared on 7/12/2010. Click here.
View all notes |
Alert me of new notes |
CANSLIM.net Company Profile |
SEC |
Zacks Reports |
StockTalk |
News |
Chart |
Request a new note
C
A N
S L
I M


|
ABV
-
NYSE
Comp De Bebidas Adr
FOOD and BEVERAGE - Beverages - Brewers
|
$105.64
|
+0.07
0.07% |
$106.14
|
347,553
46.63% of 50 DAV
50 DAV is 745,400
|
$109.33
-3.38%
|
6/29/2010
|
$104.74
|
PP = $109.33
|
|
MB = $114.80
|
Most Recent Note - 7/14/2010 4:54:56 PM
Y - This Brazil-based beverage firm is quietly perched within close striking distance of its 52-week high. It found support near its 50 DMA line recently and has not yet traded above its pivot point since featured in the 6/29/10 mid-day report (read here).
>>> The latest Featured Stock Update with an annotated graph appeared on 6/29/2010. Click here.
View all notes |
Alert me of new notes |
CANSLIM.net Company Profile |
SEC |
Zacks Reports |
StockTalk |
News |
Chart |
Request a new note
C
A N
S L
I M
|
BIDU
-
NASDAQ
Baidu Inc Ads
INTERNET - Internet Information Providers
|
$75.03
|
+0.65
0.87% |
$75.48
|
9,496,329
65.43% of 50 DAV
50 DAV is 14,513,200
|
$82.29
-8.82%
|
7/14/2010
|
$75.03
|
PP = $78.59
|
|
MB = $82.52
|
Most Recent Note - 7/14/2010 5:40:06 PM
Y - Color code is changed to yellow with new pivot point cited based on 6/21/10 high after a proper double-bottom pattern of sufficient length. Disciplined investors avoid the temptation to get in "early" and watch for a proper technical buy signal.
>>> The latest Featured Stock Update with an annotated graph appeared on 7/14/2010. Click here.
View all notes |
Alert me of new notes |
CANSLIM.net Company Profile |
SEC |
Zacks Reports |
StockTalk |
News |
Chart |
Request a new note
C
A N
S L
I M
|
CRM
-
NYSE
Salesforce.Com Inc
INTERNET - Internet Software and Services
|
$95.73
|
+2.08
2.22% |
$96.43
|
2,150,191
73.01% of 50 DAV
50 DAV is 2,944,900
|
$97.94
-2.26%
|
6/2/2010
|
$88.44
|
PP = $89.60
|
|
MB = $94.08
|
Most Recent Note - 7/14/2010 5:56:11 PM
G - Approaching its 52-week high while posting a 9th consecutive gain and closing above its "max buy" level today. Color code is changed on green.
>>> The latest Featured Stock Update with an annotated graph appeared on 6/22/2010. Click here.
View all notes |
Alert me of new notes |
CANSLIM.net Company Profile |
SEC |
Zacks Reports |
StockTalk |
News |
Chart |
Request a new note
C
A N
S L
I M
|
CVLT
-
NASDAQ
Commvault Systems Inc
COMPUTER SOFTWARE and SERVICES - Business Software and Services
|
$18.60
|
+0.25
1.36% |
$18.75
|
1,482,007
248.66% of 50 DAV
50 DAV is 596,000
|
$24.51
-24.11%
|
7/6/2010
|
$23.16
|
PP = $24.45
|
|
MB = $25.67
|
Most Recent Note - 7/13/2010 10:28:22 AM
G - Gapped down today for a considerable loss after reporting weak preliminary results and analyst downgrade, violating its 50 and 200 DMA lines and 2010 lows. Based on poor technical action it will be dropped from the Featured Stocks list tonight. Disciplined investors avoid the temptation to get in "early" and can see that CVLT did not trigger a technical buy signal after it was featured in the 7/06/10 mid-day report (read here).
>>> The latest Featured Stock Update with an annotated graph appeared on 7/6/2010. Click here.
View all notes |
Alert me of new notes |
CANSLIM.net Company Profile |
SEC |
Zacks Reports |
StockTalk |
News |
Chart |
Request a new note
C
A N
S L
I M
|
Symbol/Exchange
Company Name
Industry Group |
PRICE |
CHANGE
(%Change) |
Day High |
Volume
(% DAV)
(% 50 day avg vol) |
52 Wk Hi
% From Hi |
Featured
Date |
Price
Featured |
Pivot Featured |
|
Max Buy |
DECK
-
NASDAQ
Deckers Outdoor Corp
CONSUMER NON-DURABLES - Textile - Apparel Footwear
|
$47.14
|
-0.43
-0.90% |
$48.02
|
981,515
63.75% of 50 DAV
50 DAV is 1,539,600
|
$56.12
-16.00%
|
6/11/2010
|
$157.34
|
PP = $158.57
|
|
MB = $166.50
|
Most Recent Note - 7/13/2010 6:43:02 PM
G - Small gain today with light volume, still struggling below its 50 DMA line which may now act as resistance. A rally above that short-term average would help its outlook, technically. Do not be confused, as the most recent Featured Price, Pivot Point and Max Buy levels have been adjusted to account for a stock split 3:1 effective as of 7/06/10.
>>> The latest Featured Stock Update with an annotated graph appeared on 7/1/2010. Click here.
View all notes |
Alert me of new notes |
CANSLIM.net Company Profile |
SEC |
Zacks Reports |
StockTalk |
News |
Chart |
Request a new note
C
A N
S L
I M
|
FFIV
-
NASDAQ
F 5 Networks Inc
INTERNET - Internet Software and Services
|
$77.87
|
+1.01
1.31% |
$79.21
|
1,260,022
74.09% of 50 DAV
50 DAV is 1,700,700
|
$77.96
-0.12%
|
6/16/2010
|
$74.50
|
PP = $74.10
|
|
MB = $77.81
|
Most Recent Note - 7/14/2010 6:00:30 PM
G - Gain today on light volume for a new 52-week high and close above its "max buy" level. It did not trigger a proper technical buy signal recently. Color code is changed to green.
>>> The latest Featured Stock Update with an annotated graph appeared on 7/7/2010. Click here.
View all notes |
Alert me of new notes |
CANSLIM.net Company Profile |
SEC |
Zacks Reports |
StockTalk |
News |
Chart |
Request a new note
C
A N
S L
I M
|
MELI
-
NASDAQ
Mercadolibre Inc
INTERNET - Internet Software and; Services
|
$61.00
|
+0.44
0.73% |
$61.03
|
749,557
79.07% of 50 DAV
50 DAV is 948,000
|
$62.14
-1.83%
|
5/13/2010
|
$54.21
|
PP = $55.85
|
|
MB = $58.64
|
Most Recent Note - 7/14/2010 6:12:54 PM
G - Small gain today with lighter volume for its best ever close. Color code was changed to green after rising back above its "max buy" level.
>>> The latest Featured Stock Update with an annotated graph appeared on 6/30/2010. Click here.
View all notes |
Alert me of new notes |
CANSLIM.net Company Profile |
SEC |
Zacks Reports |
StockTalk |
News |
Chart |
Request a new note
C
A N
S L
I M
|
NEM
-
NYSE
Newmont Mining Corp
METALS and MINING - Gold
|
$61.72
|
+0.04
0.06% |
$62.66
|
5,521,154
54.72% of 50 DAV
50 DAV is 10,089,700
|
$63.38
-2.62%
|
6/22/2010
|
$59.60
|
PP = $59.67
|
|
MB = $62.65
|
Most Recent Note - 7/14/2010 6:14:20 PM
Y - Holding its ground in a very tight trading range, quietly hovering near all-time highs.
>>> The latest Featured Stock Update with an annotated graph appeared on 7/9/2010. Click here.
View all notes |
Alert me of new notes |
CANSLIM.net Company Profile |
SEC |
Zacks Reports |
StockTalk |
News |
Chart |
Request a new note
C
A N
S L
I M
|
ROVI
-
NASDAQ
Rovi Corp
COMPUTER SOFTWARE andamp; SERVICES - Security Software andamp; Services
|
$43.20
|
+0.37
0.86% |
$43.67
|
815,340
55.26% of 50 DAV
50 DAV is 1,475,500
|
$43.00
0.47%
|
6/3/2010
|
$38.70
|
PP = $40.16
|
|
MB = $42.17
|
Most Recent Note - 7/14/2010 6:16:40 PM
G - Gain on lighter volume today for a new 52-week high. Prior resistance in the $40 is now an important chart support level above its 50 DMA line.
>>> The latest Featured Stock Update with an annotated graph appeared on 6/28/2010. Click here.
View all notes |
Alert me of new notes |
CANSLIM.net Company Profile |
SEC |
Zacks Reports |
StockTalk |
News |
Chart |
Request a new note
C
A N
S L
I M
|
Symbol/Exchange
Company Name
Industry Group |
PRICE |
CHANGE
(%Change) |
Day High |
Volume
(% DAV)
(% 50 day avg vol) |
52 Wk Hi
% From Hi |
Featured
Date |
Price
Featured |
Pivot Featured |
|
Max Buy |
THOR
-
NASDAQ
Thoratec Corp
HEALTH SERVICES - Medical Instruments and Supplies
|
$44.89
|
+0.07
0.16% |
$45.06
|
320,038
28.02% of 50 DAV
50 DAV is 1,142,300
|
$47.93
-6.34%
|
6/3/2010
|
$44.38
|
PP = $45.35
|
|
MB = $47.62
|
Most Recent Note - 7/12/2010 5:19:18 PM
Y - Quietly consolidating above support at its a 50 DMA line, an important support level.
>>> The latest Featured Stock Update with an annotated graph appeared on 6/23/2010. Click here.
View all notes |
Alert me of new notes |
CANSLIM.net Company Profile |
SEC |
Zacks Reports |
StockTalk |
News |
Chart |
Request a new note
C
A N
S L
I M
|
ULTA
-
NASDAQ
Ulta Salon Cosm & Frag
SPECIALTY RETAIL - Specialty Retail, Other
|
$23.60
|
-0.29
-1.21% |
$23.74
|
391,554
56.82% of 50 DAV
50 DAV is 689,100
|
$26.75
-11.78%
|
5/28/2010
|
$25.58
|
PP = $25.86
|
|
MB = $27.15
|
Most Recent Note - 7/14/2010 6:28:16 PM
G - Small loss today on light volume led to a close just under its 50 DMA line. Its May - June chart lows in the $21 area define the next support level just above its 200 DMA line.
>>> The latest Featured Stock Update with an annotated graph appeared on 6/25/2010. Click here.
View all notes |
Alert me of new notes |
CANSLIM.net Company Profile |
SEC |
Zacks Reports |
StockTalk |
News |
Chart |
Request a new note
C
A N
S L
I M
|
VIT
-
NYSE
Vanceinfo Tech Inc Ads
COMPUTER SOFTWARE and SERVICES - Business Software and Services
|
$25.00
|
-0.35
-1.38% |
$25.50
|
492,724
73.87% of 50 DAV
50 DAV is 667,000
|
$26.90
-7.06%
|
7/8/2010
|
$25.20
|
PP = $26.58
|
|
MB = $27.91
|
Most Recent Note - 7/14/2010 6:31:58 PM
Y - Its latest losses on lighter volume appear to be a "handle" forming on the right side after a near 11-week cup shaped pattern. It did not trigger a buy signal with respect to the pivot point cited after gapping up on 7/08/10, when it briefly matched its all-time high and appeared in the mid-day report (read here).
>>> The latest Featured Stock Update with an annotated graph appeared on 7/8/2010. Click here.
View all notes |
Alert me of new notes |
CANSLIM.net Company Profile |
SEC |
Zacks Reports |
StockTalk |
News |
Chart |
Request a new note
C
A N
S L
I M
|
|
|
|
THESE ARE NOT BUY RECOMMENDATIONS!
Comments contained in the body of this report are technical
opinions only. The material herein has been obtained
from sources believed to be reliable and accurate, however,
its accuracy and completeness cannot be guaranteed.
This site is not an investment advisor, hence it does
not endorse or recommend any securities or other investments.
Any recommendation contained in this report may not
be suitable for all investors and it is not to be deemed
an offer or solicitation on our part with respect to
the purchase or sale of any securities. All trademarks,
service marks and trade names appearing in this report
are the property of their respective owners, and are
likewise used for identification purposes only.
This report is a service available
only to active Paid Premium Members.
You may opt-out of receiving report notifications
at any time. Questions or comments may be submitted
by writing to Premium Membership Services 665 S.E. 10 Street, Suite 201 Deerfield Beach, FL 33441-5634 or by calling 1-800-965-8307
or 954-785-1121.
|
|
|


