You are not logged in.
This means you
CAN ONLY VIEW reports that were published prior to Monday, March 10, 2025.
You
MUST UPGRADE YOUR MEMBERSHIP if you want to see any current reports.
AFTER MARKET UPDATE - FRIDAY, JULY 13TH, 2012
Previous After Market Report Next After Market Report >>>
|
|
|
|
DOW |
+203.82 |
12,777.09 |
+1.62% |
|
Volume |
682,998,950 |
-11% |
|
Volume |
1,315,935,790 |
-21% |
|
NASDAQ |
+42.28 |
2,908.47 |
+1.48% |
|
Advancers |
2,579 |
82% |
|
Advancers |
1,829 |
71% |
|
S&P 500 |
+22.02 |
1,356.78 |
+1.65% |
|
Decliners |
505 |
16% |
|
Decliners |
662 |
26% |
|
Russell 2000 |
+11.37 |
800.99 |
+1.44% |
|
52 Wk Highs |
219 |
|
|
52 Wk Highs |
111 |
|
|
S&P 600 |
+6.27 |
447.38 |
+1.42% |
|
52 Wk Lows |
18 |
|
|
52 Wk Lows |
31 |
|
|
 |
Indices Post Big Gains Without Great Volume Conviction Following Slump
Kenneth J. Gruneisen - Passed the CAN SLIM® Master's Exam
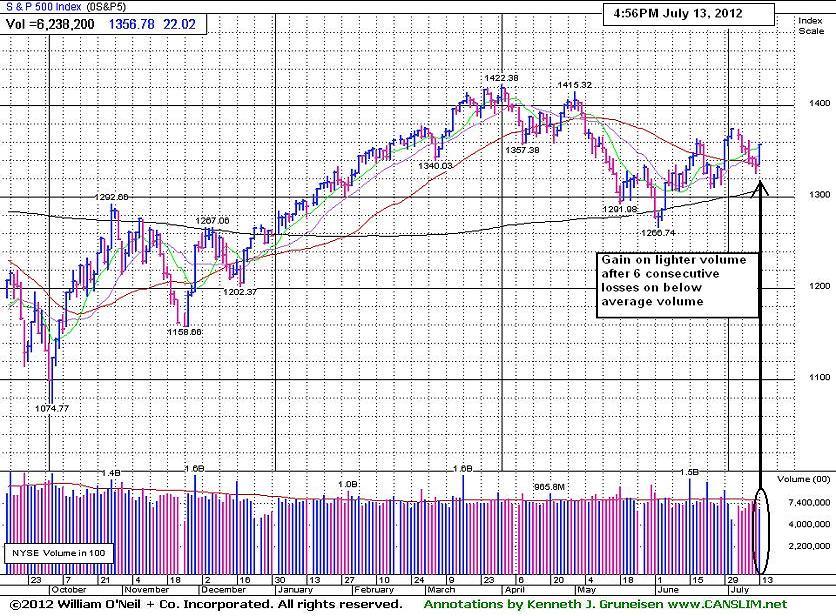
For the week, the Dow Jones Industrial Average gained 5,points and the S&P 500 Index gained 2 points, each ending essentially flat percentage-wise, meanwhile the tech-heavy Nasdaq Composite Index lost 29 points or nearly -1%. On Friday's session the indices posted large gains, however behind the gains the much lighter volume totals on the NYSE and on the Nasdaq exchange were an indication that institutional buying demand was not robust, but timid, following a streak of losses. Advancers led decliners by a 5-1 margin on the NYSE and by nearly 3-1 on the Nasdaq exchange. The total number of new 52-week highs led new 52-week lows on the NYSE and on the Nasdaq exchange. There were 51 high-ranked companies from the CANSLIM.net Leaders List made new 52-week highs and appeared on the CANSLIM.net BreakOuts Page, more than tripling the prior session total of 16 stocks. At the session's close there were gains for 16 of the 19 high-ranked companies currently included on the Featured Stocks Page.
Altisource Portfolio Solutions Sa (ASPS +4.47%) and Expedia Inc (EXPE +3.65%) were standout gainers among the stocks included on the Featured Stocks Page on Friday. Expedia is testing support near its 50-day moving average line, and both stocks are extended after rallying well above their previously cited pivot points.
Friday's morning's data showed PPI up at a hotter than expected +0.1% month over month clip. The Michigan Sentiment reported at 72.0 fell short of estimates. The equity market saw no reaction to the negative sentiment reading.
The euro hit multi-year year lows this week, but gained sharply versus the dollar shortly after Friday's U.S. equity market open. The euro finished the week at $1.2240. Treasuries endured light selling with the 10-year yield climbing two basis points to 1.50%.
Next week, earnings season will dominate the headlines and have a big influence on the market. Over 200 companies will report Q2 results, including many Dow components.
The upward trend concerning the M criteria has come under recent pressure. However, new buying efforts may be justified in worthy buy candidates with strong fundamental and technical characteristics matching all key investment criteria. The best buy candidates identified by CANSLIM.net's experts are always viewable on the Featured Stocks page.
The Q2 2012 WEBCAST is available "ON DEMAND" - CLICK HERE. Upgraded members now get access to these informative *Quarterly Webcasts included at no additional cost. (*Previously sold separately at $99 per webcast.) Links to archived webcasts and all prior reports are on the Premium Member Homepage.
PICTURED: The benchmark S&P 500 Index found support and rallied with lighter volume from its 50-day moving average (DMA) line following 6 consecutive losses with below average volume. Its +1.7% rally in stocks took the S&P 500 back to flat on the week, after a somewhat disappointing start to earnings season. It found support near its longer term 200 DMA line 6 weeks ago and halted the prior market "correction". More damaging losses below the recent lows and 200 DMA line would be a very worrisome sign, meanwhile a rally above the recent high would be a reassuring sign the rally's strength is improving.
|
 Kenneth J. Gruneisen started out as a licensed stockbroker in August 1987, a couple of months prior to the historic stock market crash that took the Dow Jones Industrial Average down -22.6% in a single day. He has published daily fact-based fundamental and technical analysis on high-ranked stocks online for two decades. Through FACTBASEDINVESTING.COM, Kenneth provides educational articles, news, market commentary, and other information regarding proven investment systems that work in good times and bad.
Comments contained in the body of this report are technical opinions only and are not necessarily those of Gruneisen Growth Corp. The material herein has been obtained from sources believed to be reliable and accurate, however, its accuracy and completeness cannot be guaranteed. Our firm, employees, and customers may effect transactions, including transactions contrary to any recommendation herein, or have positions in the securities mentioned herein or options with respect thereto. Any recommendation contained in this report may not be suitable for all investors and it is not to be deemed an offer or solicitation on our part with respect to the purchase or sale of any securities. |
|
 |
Financials Led Broad Based Group Gains
Kenneth J. Gruneisen - Passed the CAN SLIM® Master's Exam
Big gains from the Broker/Dealer Index ($XBD +2.63%) and Bank Index ($BKX +3.26%) were a positive influence as they underpinned the major averages' gains on Friday. The Retail Index ($RLX +1.39%) rose, and there were unanimous gains in the tech sector as the Networking Index ($NWX +0.65%), Semiconductor Index ($SOX +0.94%), Biotechnology Index ($BTK +1.29%), and the Internet Index ($IIX +1.36%) tallied gains. The Healthcare Index ($HMO +1.78%) traded up, and commodity-linked groups rounded out a solidly positive session for all groups as the Integrated Oil Index ($XOI +1.48%), Oil Services Index ($OSX +2.15%), and the Gold & Silver Index ($XAU +1.58%) rose.
Charts courtesy www.stockcharts.com
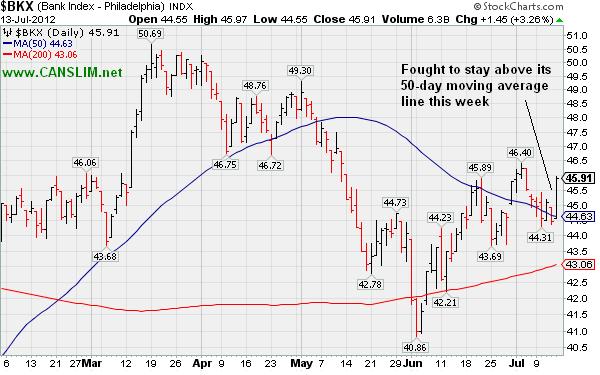
PICTURED: The Bank Index ($BKX +3.26%) fought to stay above its 50-day moving average line this week.
| Oil Services |
$OSX |
206.59 |
+4.35 |
+2.15% |
-4.48% |
| Healthcare |
$HMO |
2,412.54 |
+42.15 |
+1.78% |
+5.74% |
| Integrated Oil |
$XOI |
1,172.02 |
+17.12 |
+1.48% |
-4.64% |
| Semiconductor |
$SOX |
357.01 |
+3.32 |
+0.94% |
-2.04% |
| Networking |
$NWX |
196.03 |
+1.26 |
+0.65% |
-8.89% |
| Internet |
$IIX |
290.53 |
+3.90 |
+1.36% |
+3.12% |
| Broker/Dealer |
$XBD |
85.81 |
+2.20 |
+2.63% |
+3.05% |
| Retail |
$RLX |
613.22 |
+8.43 |
+1.39% |
+17.21% |
| Gold & Silver |
$XAU |
150.22 |
+2.34 |
+1.58% |
-16.84% |
| Bank |
$BKX |
45.91 |
+1.45 |
+3.26% |
+16.58% |
| Biotech |
$BTK |
1,485.00 |
+18.98 |
+1.29% |
+36.06% |
|
|
|
 |
Healthy Consolidation Above Prior Highs With Volume Cooling
Kenneth J. Gruneisen - Passed the CAN SLIM® Master's Exam
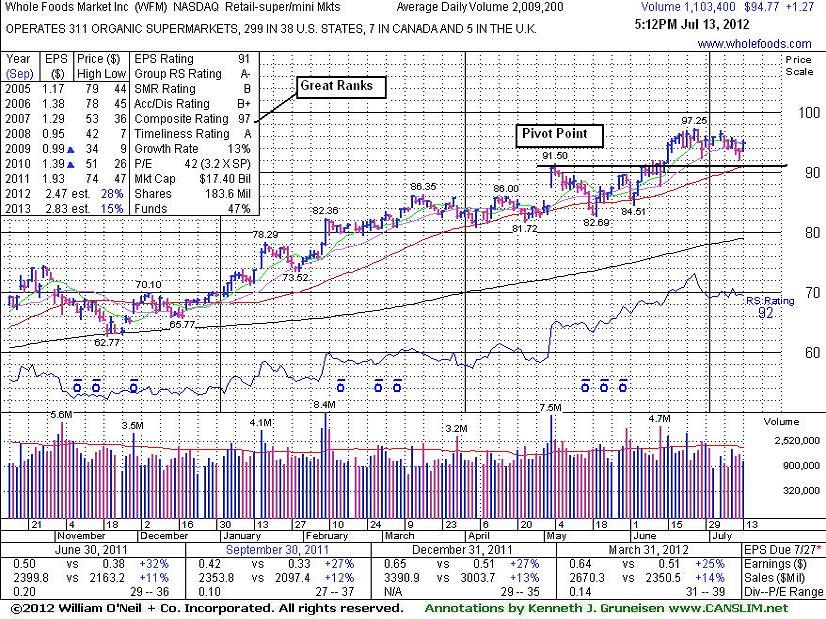
Whole Foods Market Inc (WFM +$1.27 or +1.36% to $94.77) is quietly consolidating below its "max buy" level. Volume totals have been cooling while it has been hovering above its pivot point and near its 52-week high with no resistance remaining due to overhead supply. Prior highs in the $91.50 area and its 50-day moving average DMA line define important support to watch where violations may trigger technical sell signals. It was last shown in this FSU section with an annotated graph on 6/13/12 under the headline, "New Pivot Point Cited While Contending With Distributional Pressure". A gain on 6/15/12 with +72% above average volume confirmed a technical buy signal.
The Retail - Super/Mini-Markets group has seen its Group Relative Strength Rating rise from 60 to 81 in the time since it was shown in this FSU section with an annotated graph on 5/11/12 under the headline, "Consolidating Above Prior Highs After Breakaway Gap". The improvement in group rank and ongoing leadership from a couple of other high-ranked companies in the industry group provides reassurances concerning the L criteria. Quarterly comparisons have shown strong earnings increases above the +25% guideline (C criteria). Its annual earnings (A criteria) history has been improving since a downturn in FY '08. The number of top-rated funds owning its shares rose from 1,046 in Jun '11 to 1,193 in Mar '12, a reassuring sign concerning the I criteria.
|
|
|
Color Codes Explained :
Y - Better candidates highlighted by our
staff of experts.
G - Previously featured
in past reports as yellow but may no longer be buyable under the
guidelines.
***Last / Change / Volume data in this table is the closing quote data***
Symbol/Exchange
Company Name
Industry Group |
PRICE |
CHANGE
(%Change) |
Day High |
Volume
(% DAV)
(% 50 day avg vol) |
52 Wk Hi
% From Hi |
Featured
Date |
Price
Featured |
Pivot Featured |
|
Max Buy |
ALXN
-
NASDAQ
Alexion Pharmaceuticals
DRUGS - Drug Manufacturers - Other
|
$97.35
|
+0.16
0.16% |
$98.33
|
1,139,178
51.52% of 50 DAV
50 DAV is 2,211,200
|
$104.38
-6.74%
|
5/1/2012
|
$91.73
|
PP = $95.11
|
|
MB = $99.87
|
 Most Recent Note - 7/13/2012 3:38:53 PM
Y - Halted its slide this week above prior highs in the $95 area that define support to watch above its 50 DMA line.
>>> The latest Featured Stock Update with an annotated graph appeared on 6/29/2012. Click here.
View all notes |
Alert me of new notes |
CANSLIM.net Company Profile |
SEC |
Zacks Reports |
StockTalk |
News |
Chart |
Request a new note
C
A N
S L
I M


|
ASPS
-
NASDAQ
Altisource Ptf Sltns Sa
REAL ESTATE - Property Management/Developmen
|
$73.86
|
+3.16
4.47% |
$73.86
|
98,306
72.50% of 50 DAV
50 DAV is 135,600
|
$76.20
-3.07%
|
6/5/2012
|
$60.01
|
PP = $63.00
|
|
MB = $66.15
|
Most Recent Note - 7/13/2012 3:25:36 PM
G - Up today following a damaging loss with above average volume on the prior session. Prior highs in the $65 area and its 50 DMA line define near-term support to watch.
>>> The latest Featured Stock Update with an annotated graph appeared on 7/3/2012. Click here.
View all notes |
Alert me of new notes |
CANSLIM.net Company Profile |
SEC |
Zacks Reports |
StockTalk |
News |
Chart |
Request a new note
C
A N
S L
I M
|
CERN
-
NASDAQ
Cerner Corp
COMPUTER SOFTWARE and SERVICES - Healthcare Information Service
|
$80.29
|
+0.41
0.51% |
$81.66
|
938,206
65.06% of 50 DAV
50 DAV is 1,442,100
|
$88.32
-9.09%
|
6/7/2012
|
$78.36
|
PP = $84.20
|
|
MB = $88.41
|
Most Recent Note - 7/13/2012 3:26:57 PM
G - Halted its slide near its 50 DMA line with a gain today on light volume. It has not formed a proper base since negating its prior breakout.
>>> The latest Featured Stock Update with an annotated graph appeared on 7/9/2012. Click here.
View all notes |
Alert me of new notes |
CANSLIM.net Company Profile |
SEC |
Zacks Reports |
StockTalk |
News |
Chart |
Request a new note
C
A N
S L
I M
|
CMCSA
-
NASDAQ
Comcast Corp Cl A
MEDIA - CATV Systems
|
$31.87
|
+0.77
2.48% |
$31.90
|
10,465,496
75.11% of 50 DAV
50 DAV is 13,933,000
|
$32.50
-1.94%
|
6/11/2012
|
$29.94
|
PP = $30.98
|
|
MB = $32.53
|
Most Recent Note - 7/13/2012 3:28:27 PM
Y - Trading up today after a loss with above average volume on the prior session. Still consolidating in a tight range near its 52-week high, holding ground above its pivot point. No overhead supply remains to act as resistance and it is still trading below its "max buy" level. See the latest FSU analysis for more details and a new annotated graph.
>>> The latest Featured Stock Update with an annotated graph appeared on 7/11/2012. Click here.
View all notes |
Alert me of new notes |
CANSLIM.net Company Profile |
SEC |
Zacks Reports |
StockTalk |
News |
Chart |
Request a new note
C
A N
S L
I M
|
CSTR
-
NASDAQ
Coinstar Inc
DIVERSIFIED SERVICES - Personal Services
|
$64.07
|
-2.94
-4.39% |
$67.14
|
2,860,943
281.31% of 50 DAV
50 DAV is 1,017,000
|
$71.82
-10.79%
|
6/26/2012
|
$64.05
|
PP = $67.00
|
|
MB = $70.35
|
Most Recent Note - 7/13/2012 12:22:58 PM
G - Down today with above average volume, testing support at its 50 DMA line. Color code is changed to green as it has completely negated its recent breakout, raising concerns while promptly slumping back into its prior base. Disciplined investors always limit losses by selling if any stock falls more than -7% from their purchase price.
>>> The latest Featured Stock Update with an annotated graph appeared on 6/26/2012. Click here.
View all notes |
Alert me of new notes |
CANSLIM.net Company Profile |
SEC |
Zacks Reports |
StockTalk |
News |
Chart |
Request a new note
C
A N
S L
I M
|
Symbol/Exchange
Company Name
Industry Group |
PRICE |
CHANGE
(%Change) |
Day High |
Volume
(% DAV)
(% 50 day avg vol) |
52 Wk Hi
% From Hi |
Featured
Date |
Price
Featured |
Pivot Featured |
|
Max Buy |
CTRX
-
NASDAQ
Catamaran Corp
COMPUTER SOFTWARE and SERVICES - Healthcare Information Service
|
$94.87
|
+1.84
1.98% |
$95.18
|
673,529
3,269.56% of 50 DAV
50 DAV is 20,600
|
$104.79
-9.47%
|
6/14/2012
|
$94.71
|
PP = $100.60
|
|
MB = $105.63
|
Most Recent Note - 7/13/2012 12:26:08 PM
Y - SXC Health Solutions and Catalyst Health Solutions merged and are now Catamaran Corp (CTRX). It has been testing support near its 50 DMA line after a streak of consecutive losses, churning above average volume while not making headway above its pivot point, and recent "negative reversals" were noted as signs of distributional pressure.
>>> The latest Featured Stock Update with an annotated graph appeared on 6/14/2012. Click here.
View all notes |
Alert me of new notes |
CANSLIM.net Company Profile |
SEC |
Zacks Reports |
StockTalk |
News |
Chart |
Request a new note
C
A N
S L
I M
|
DG
-
NYSE
Dollar General Corp
RETAIL - Discount, Variety Stores
|
$54.53
|
+0.53
0.98% |
$54.64
|
1,551,487
40.73% of 50 DAV
50 DAV is 3,809,000
|
$56.04
-2.69%
|
5/7/2012
|
$48.51
|
PP = $47.69
|
|
MB = $50.07
|
Most Recent Note - 7/12/2012 4:42:24 PM
G - Still hovering near its all-time high, extended from its prior base. Completed another Secondary Offering on 6/05/12, its 4th Secondary Offering since September '11. See the latest FSU analysis for more detail and a new annotated graph.
>>> The latest Featured Stock Update with an annotated graph appeared on 7/12/2012. Click here.
View all notes |
Alert me of new notes |
CANSLIM.net Company Profile |
SEC |
Zacks Reports |
StockTalk |
News |
Chart |
Request a new note
C
A N
S L
I M
|
ECHO
-
NASDAQ
Echo Global Logistics
DIVERSIFIED SERVICES - Business/Management Services
|
$19.29
|
+0.30
1.58% |
$19.35
|
176,599
146.92% of 50 DAV
50 DAV is 120,200
|
$19.48
-0.98%
|
6/22/2012
|
$18.98
|
PP = $19.48
|
|
MB = $20.45
|
Most Recent Note - 7/13/2012 3:32:56 PM
Y - Rising today with above average volume, trading within close striking distance of its 52-week high. Recent volume-driven gains were followed by a gap down on 7/03/12 with higher volume after not quite triggering a technical buy signal under the fact-based system.
>>> The latest Featured Stock Update with an annotated graph appeared on 6/22/2012. Click here.
View all notes |
Alert me of new notes |
CANSLIM.net Company Profile |
SEC |
Zacks Reports |
StockTalk |
News |
Chart |
Request a new note
C
A N
S L
I M
|
EXPE
-
NASDAQ
Expedia Inc
INTERNET - Internet Information Providers
|
$45.67
|
+1.61
3.65% |
$45.91
|
2,831,938
72.70% of 50 DAV
50 DAV is 3,895,400
|
$50.66
-9.85%
|
4/27/2012
|
$41.80
|
PP = $35.57
|
|
MB = $37.35
|
Most Recent Note - 7/13/2012 3:18:25 PM
G - Rebounding above its 50 DMA line ($45.35 now) today, showing resilience after undercutting that important short-term average on the prior session. Prior highs in the $43 area define the next support level.
>>> The latest Featured Stock Update with an annotated graph appeared on 7/10/2012. Click here.
View all notes |
Alert me of new notes |
CANSLIM.net Company Profile |
SEC |
Zacks Reports |
StockTalk |
News |
Chart |
Request a new note
C
A N
S L
I M
|
GNC
-
NYSE
G N C Holdings Inc
RETAIL - Drug Stores
|
$39.25
|
+0.86
2.24% |
$39.43
|
1,398,259
61.09% of 50 DAV
50 DAV is 2,288,800
|
$42.70
-8.08%
|
6/29/2012
|
$39.20
|
PP = $40.00
|
|
MB = $42.00
|
Most Recent Note - 7/11/2012 2:47:31 PM
Y - Loss today has it slumping below its pivot point and trading near its 50 DMA line. Disciplined investors always limit losses if any stock falls more than -7% from their purchase price.
>>> The latest Featured Stock Update with an annotated graph appeared on 7/5/2012. Click here.
View all notes |
Alert me of new notes |
CANSLIM.net Company Profile |
SEC |
Zacks Reports |
StockTalk |
News |
Chart |
Request a new note
C
A N
S L
I M
|
Symbol/Exchange
Company Name
Industry Group |
PRICE |
CHANGE
(%Change) |
Day High |
Volume
(% DAV)
(% 50 day avg vol) |
52 Wk Hi
% From Hi |
Featured
Date |
Price
Featured |
Pivot Featured |
|
Max Buy |
GPX
-
NYSE
G P Strategies Corp
DIVERSIFIED SERVICES - Education and Training Services
|
$17.85
|
+0.41
2.35% |
$17.86
|
32,485
56.79% of 50 DAV
50 DAV is 57,200
|
$18.99
-6.00%
|
6/29/2012
|
$18.01
|
PP = $18.15
|
|
MB = $19.06
|
Most Recent Note - 7/11/2012 2:50:10 PM
Y - Today's loss on lighter volume has it slumping further below its old high close. Losses completely negated the recent breakout and raised concerns. Disciplined investors always limit losses by selling any stock if it falls more than -7% from their purchase price.
>>> The latest Featured Stock Update with an annotated graph appeared on 7/6/2012. Click here.
View all notes |
Alert me of new notes |
CANSLIM.net Company Profile |
SEC |
Zacks Reports |
StockTalk |
News |
Chart |
Request a new note
C
A N
S L
I M
|
MLNX
-
NASDAQ
Mellanox Technologies
ELECTRONICS - Semiconductor - Broad Line
|
$66.07
|
-0.12
-0.18% |
$67.73
|
548,426
87.71% of 50 DAV
50 DAV is 625,300
|
$77.69
-14.96%
|
6/18/2012
|
$70.90
|
PP = $67.30
|
|
MB = $70.67
|
Most Recent Note - 7/11/2012 2:45:29 PM
G - Pulling back for a damaging 4th consecutive loss today with ever-increasing volume, undercutting its pivot point and raising concerns. Recent chart lows define important support to watch nearly coinciding with its 50 DMA line.
>>> The latest Featured Stock Update with an annotated graph appeared on 6/25/2012. Click here.
View all notes |
Alert me of new notes |
CANSLIM.net Company Profile |
SEC |
Zacks Reports |
StockTalk |
News |
Chart |
Request a new note
C
A N
S L
I M
|
N
-
NYSE
Netsuite Inc
DIVERSIFIED SERVICES - Business/Management Services
|
$50.45
|
+1.00
2.02% |
$50.60
|
675,537
121.32% of 50 DAV
50 DAV is 556,800
|
$56.06
-10.01%
|
6/20/2012
|
$51.83
|
PP = $51.88
|
|
MB = $54.47
|
Most Recent Note - 7/13/2012 3:30:50 PM
Y - Halted its slide above its 50 DMA line after damaging distributional losses this week undercut its pivot point and negated its recent breakout. Disciplined investors always limit losses by selling if any stock falls more than -7% from their purchase price.
>>> The latest Featured Stock Update with an annotated graph appeared on 6/20/2012. Click here.
View all notes |
Alert me of new notes |
CANSLIM.net Company Profile |
SEC |
Zacks Reports |
StockTalk |
News |
Chart |
Request a new note
C
A N
S L
I M
|
NSM
-
NYSE
Nationstar Mtg Hldgs Inc
FINANCIAL SERVICES - Credit Services
|
$24.78
|
+0.79
3.29% |
$24.96
|
697,006
87.89% of 50 DAV
50 DAV is 793,000
|
$24.78
0.00%
|
6/27/2012
|
$20.29
|
PP = $20.46
|
|
MB = $21.48
|
Most Recent Note - 7/13/2012 3:15:04 PM
G - Hitting yet another new 52-week high today, getting more extended from its prior base with no overhead supply to hinder its progress. Prior highs in the $20 area define important support to watch on pullbacks.
>>> The latest Featured Stock Update with an annotated graph appeared on 6/27/2012. Click here.
View all notes |
Alert me of new notes |
CANSLIM.net Company Profile |
SEC |
Zacks Reports |
StockTalk |
News |
Chart |
Request a new note
C
A N
S L
I M
|
NTES
-
NASDAQ
Netease Inc Adr
INTERNET - Internet Information Providers
|
$57.23
|
-0.16
-0.28% |
$58.13
|
516,749
71.20% of 50 DAV
50 DAV is 725,800
|
$65.54
-12.68%
|
3/19/2012
|
$56.18
|
PP = $55.10
|
|
MB = $57.86
|
Most Recent Note - 7/13/2012 3:36:33 PM
G - Holding its ground today above prior lows in the $55 area, but further deterioration would raise more serious concerns. Gains above its 50 DMA line would improve its technical stance, meanwhile it faces overhead supply that may act as resistance up through the $65 area.
>>> The latest Featured Stock Update with an annotated graph appeared on 6/19/2012. Click here.
View all notes |
Alert me of new notes |
CANSLIM.net Company Profile |
SEC |
Zacks Reports |
StockTalk |
News |
Chart |
Request a new note
C
A N
S L
I M
|
Symbol/Exchange
Company Name
Industry Group |
PRICE |
CHANGE
(%Change) |
Day High |
Volume
(% DAV)
(% 50 day avg vol) |
52 Wk Hi
% From Hi |
Featured
Date |
Price
Featured |
Pivot Featured |
|
Max Buy |
TDG
-
NYSE
Transdigm Group Inc
AEROSPACE/DEFENSE - Aerospace/Defense Products and; Services
|
$130.83
|
+3.46
2.72% |
$131.22
|
239,694
45.26% of 50 DAV
50 DAV is 529,600
|
$136.34
-4.04%
|
6/18/2012
|
$127.00
|
PP = $132.79
|
|
MB = $139.43
|
Most Recent Note - 7/13/2012 3:21:10 PM
Y - Halted its slide today at its 50 DMA line which defines important support to watch. The 6/29/12 gain above its pivot point was backed by only +32% above average volume, below the minimum threshold need to trigger a proper new (or add-on) technical buy signal.
>>> The latest Featured Stock Update with an annotated graph appeared on 6/18/2012. Click here.
View all notes |
Alert me of new notes |
CANSLIM.net Company Profile |
SEC |
Zacks Reports |
StockTalk |
News |
Chart |
Request a new note
C
A N
S L
I M
|
TNGO
-
NASDAQ
Tangoe Inc
COMPUTER SOFTWARE and SERVICES - Technical and System Software
|
$20.47
|
+0.53
2.66% |
$20.73
|
252,065
46.83% of 50 DAV
50 DAV is 538,300
|
$23.05
-11.19%
|
6/27/2012
|
$21.70
|
PP = $23.15
|
|
MB = $24.31
|
Most Recent Note - 7/13/2012 3:22:34 PM
G - Trading up today on light volume, but still below its 50 DMA line following a streak of 6 consecutive losses on light volume. Gains back above that important short-term average are needed to help its outlook, and gains above the pivot point backed by +40% above average volume or greater could trigger a new technical buy signal.
>>> The latest Featured Stock Update with an annotated graph appeared on 6/28/2012. Click here.
View all notes |
Alert me of new notes |
CANSLIM.net Company Profile |
SEC |
Zacks Reports |
StockTalk |
News |
Chart |
Request a new note
C
A N
S L
I M
|
VSI
-
NYSE
Vitamin Shoppe Inc
SPECIALTY RETAIL - Specialty Retail, Other
|
$56.16
|
+0.99
1.79% |
$56.88
|
179,389
35.39% of 50 DAV
50 DAV is 506,900
|
$58.22
-3.54%
|
6/29/2012
|
$54.93
|
PP = $55.03
|
|
MB = $57.78
|
Most Recent Note - 7/11/2012 2:51:27 PM
Y - Pulling back today from its 52-week high hit on the prior session. Recent gains helped it trade above the new pivot point based on its 6/22/12 high after forming an 8-week cup-with-handle base, but the gains have lacked the volume required to trigger a proper new (or add-on) technical buy signal.
>>> The latest Featured Stock Update with an annotated graph appeared on 7/2/2012. Click here.
View all notes |
Alert me of new notes |
CANSLIM.net Company Profile |
SEC |
Zacks Reports |
StockTalk |
News |
Chart |
Request a new note
C
A N
S L
I M
|
WFM
-
NASDAQ
Whole Foods Market Inc
RETAIL - Grocery Stores
|
$94.77
|
+1.27
1.36% |
$95.25
|
1,103,411
54.92% of 50 DAV
50 DAV is 2,009,200
|
$97.25
-2.55%
|
6/13/2012
|
$89.90
|
PP = $91.60
|
|
MB = $96.18
|
Most Recent Note - 7/13/2012 5:46:20 PM
Y - Volume totals have been cooling while consolidating below its "max buy" level. Prior highs in the $91.50 area and its 50 DMA line define important support to watch where violations may trigger technical sell signals. See the latest FSU analysis for more details and a new annotated graph.
>>> The latest Featured Stock Update with an annotated graph appeared on 7/13/2012. Click here.
View all notes |
Alert me of new notes |
CANSLIM.net Company Profile |
SEC |
Zacks Reports |
StockTalk |
News |
Chart |
Request a new note
C
A N
S L
I M
|
|
|
|
THESE ARE NOT BUY RECOMMENDATIONS!
Comments contained in the body of this report are technical
opinions only. The material herein has been obtained
from sources believed to be reliable and accurate, however,
its accuracy and completeness cannot be guaranteed.
This site is not an investment advisor, hence it does
not endorse or recommend any securities or other investments.
Any recommendation contained in this report may not
be suitable for all investors and it is not to be deemed
an offer or solicitation on our part with respect to
the purchase or sale of any securities. All trademarks,
service marks and trade names appearing in this report
are the property of their respective owners, and are
likewise used for identification purposes only.
This report is a service available
only to active Paid Premium Members.
You may opt-out of receiving report notifications
at any time. Questions or comments may be submitted
by writing to Premium Membership Services 665 S.E. 10 Street, Suite 201 Deerfield Beach, FL 33441-5634 or by calling 1-800-965-8307
or 954-785-1121.
|
|
|

