You are not logged in.
This means you
CAN ONLY VIEW reports that were published prior to Monday, April 14, 2025.
You
MUST UPGRADE YOUR MEMBERSHIP if you want to see any current reports.
AFTER MARKET UPDATE - FRIDAY, JULY 12TH, 2013
Previous After Market Report Next After Market Report >>>
|
|
|
|
DOW |
+3.38 |
15,464.30 |
+0.02% |
|
Volume |
681,038,180 |
-8% |
|
Volume |
1,508,773,420 |
-10% |
|
NASDAQ |
+21.78 |
3,600.08 |
+0.61% |
|
Advancers |
1,511 |
49% |
|
Advancers |
1,357 |
53% |
|
S&P 500 |
+5.17 |
1,680.19 |
+0.31% |
|
Decliners |
1,483 |
48% |
|
Decliners |
1,105 |
43% |
|
Russell 2000 |
+3.35 |
1,036.52 |
+0.32% |
|
52 Wk Highs |
242 |
|
|
52 Wk Highs |
301 |
|
|
S&P 600 |
+1.21 |
583.89 |
+0.21% |
|
52 Wk Lows |
16 |
|
|
52 Wk Lows |
11 |
|
|
 |
Rallying Major Indices Post 3rd Straight Weekly Gains
Kenneth J. Gruneisen - Passed the CAN SLIM® Master's Exam
For the week, the Dow Jones Industrial Average was up +2.2%, the S&P 500 Index advanced +3.0% and the Nasdaq Composite index climbed +3.5%, collectively gaining ground for the third consecutive week. The volume totals cooled behind Friday's small gains, coming in lighter than the prior session volume totals on the NYSE and on the Nasdaq exchange. Breadth was slightly positive as advancers led decliners by a narrow margin on the Nasdaq exchange and on the NYSE. There were 107 high-ranked companies from the CANSLIM.net Leaders List made new 52-week highs and appeared on the CANSLIM.net BreakOuts Page, down from the prior session total of 147 stocks. The list of stocks hitting new 52-week highs outnumbered new 52-week lows on both the NYSE and the Nasdaq exchange. There were gains for 6 of the 11 high-ranked companies currently included on the Featured Stocks Page.
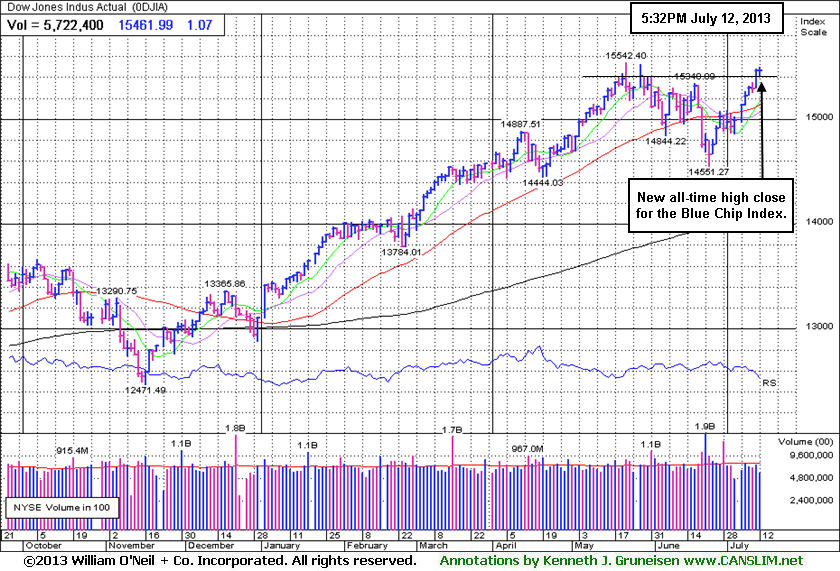
The Dow Jones Industrial Average and the S&P 500 Index both ended the week at new all-time highs after returning to rally mode. The major averages finished in positive territory as investors weighed comments by members of the Fed. The market moved lower after Philadelphia President Charles Plosser said the central bank should begin tapering its asset purchases in September. Stocks recovered after St. Louis President James Bullard indicated the Fed should maintain its accommodative policy until inflation reaches its 2.0% target. On the economic front, producer prices rose +0.8% in June, more than the consensus projection to increase +0.5%. A separate report showed consumer confidence edged lower in July.
In earnings news, JP Morgan Chase & Co (JPM -0.31%) edged lower after posting quarterly results ahead of analyst estimates. Shares of United Parcel Service Inc (UPS -5.31%) fell on its reduced full year forecast. The Boeing Co (BA -4.69%) shares fell after a 787 Dreamliner caught fire at London's Heathrow Airport. Financials outperformed with Genworth Financial Inc (GNW +2.74%) among the group's solid gainers. Telecom was the worst performing sector with Verizon Communications Inc (VZ -1.56%) edging lower.
Treasuries declined with the 10-year note down 2/32 to yield 2.58%.
The market (M criteria) has flashed substantial strength and leadership on Thursday's session, making a favorable shift. Now in a confirmed rally, odds are considered favorable for investors' success with new buying efforts. Investors who have preserved their cash and confidence will be disciplined and selective while looking to be proactive and focused exclusively on the individual leaders best matching the winning models of the fact-based investment system. Study the companies on the CANSLIM.net Featured Stocks Page - a page showing the most action-worthy candidates' latest notes and links to additional resources including detailed analysis with data-packed graphs which are annotated by a Certified expert. The Premium Member Homepage - includes "dynamic archives" to all prior pay reports published. Watch for an announcement via email concerning the next WEBCAST.
PICTURED: The Dow Jones Industrial Average edged higher for another new all-time high close, and the Blue Chip index is up +18% year-to-date.
|
 Kenneth J. Gruneisen started out as a licensed stockbroker in August 1987, a couple of months prior to the historic stock market crash that took the Dow Jones Industrial Average down -22.6% in a single day. He has published daily fact-based fundamental and technical analysis on high-ranked stocks online for two decades. Through FACTBASEDINVESTING.COM, Kenneth provides educational articles, news, market commentary, and other information regarding proven investment systems that work in good times and bad.
Comments contained in the body of this report are technical opinions only and are not necessarily those of Gruneisen Growth Corp. The material herein has been obtained from sources believed to be reliable and accurate, however, its accuracy and completeness cannot be guaranteed. Our firm, employees, and customers may effect transactions, including transactions contrary to any recommendation herein, or have positions in the securities mentioned herein or options with respect thereto. Any recommendation contained in this report may not be suitable for all investors and it is not to be deemed an offer or solicitation on our part with respect to the purchase or sale of any securities. |
|
 |
Bank, Retail, Tech and Energy-Linked Groups Rose; Defensive Groups Fell
Kenneth J. Gruneisen - Passed the CAN SLIM® Master's Exam
The Bank Index ($BKX +1.29%) and Broker/Dealer Index ($XBD +0.38%) had a positive influence on the major averages on Friday. Gains in energy related shares boosted the Integrated Oil Index ($XOI +0.45%) and the Oil Services Index ($OSX +0.72%). The Biotechnology Index ($BTK +2.50%) led the tech sector higher and the Internet Index ($IIX +1.43%), Networking Index ($NWX +0.50%), and Semiconductor Index ($SOX +0.63%) ended unanimously higher. Defensive groups pulled back and lagged growth-oriented areas as the Gold & Silver Index ($XAU -2.33%) outpaced the Healthcare Index ($HMO -0.59%) to the downside.
Charts courtesy www.stockcharts.com
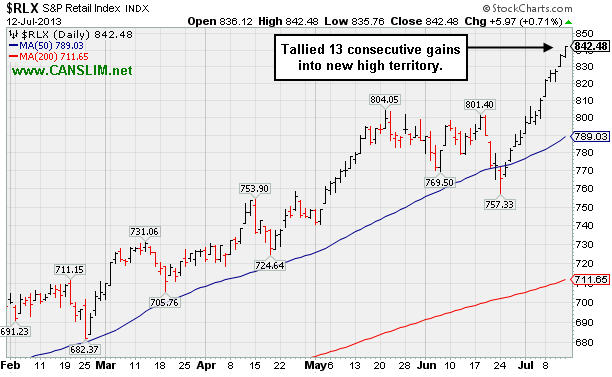
PICTURED: The Retail Index ($RLX +0.71%) has tallied 13 consecutive gains while rallying into new all-time high territory.
| Oil Services |
$OSX |
267.05 |
+1.90 |
+0.72% |
+21.30% |
| Healthcare |
$HMO |
3,316.15 |
-19.64 |
-0.59% |
+31.90% |
| Integrated Oil |
$XOI |
1,382.68 |
+6.16 |
+0.45% |
+11.34% |
| Semiconductor |
$SOX |
489.61 |
+3.05 |
+0.63% |
+27.48% |
| Networking |
$NWX |
274.52 |
+1.37 |
+0.50% |
+21.18% |
| Internet |
$IIX |
403.10 |
+5.67 |
+1.43% |
+23.27% |
| Broker/Dealer |
$XBD |
133.03 |
+0.50 |
+0.38% |
+41.02% |
| Retail |
$RLX |
842.48 |
+5.97 |
+0.71% |
+29.00% |
| Gold & Silver |
$XAU |
89.57 |
-2.14 |
-2.33% |
-45.91% |
| Bank |
$BKX |
64.49 |
+0.82 |
+1.29% |
+25.76% |
| Biotech |
$BTK |
2,178.67 |
+53.21 |
+2.50% |
+40.83% |
|
|
|
 |
Extended From Prior Base Following Gap Up Gains
Kenneth J. Gruneisen - Passed the CAN SLIM® Master's Exam
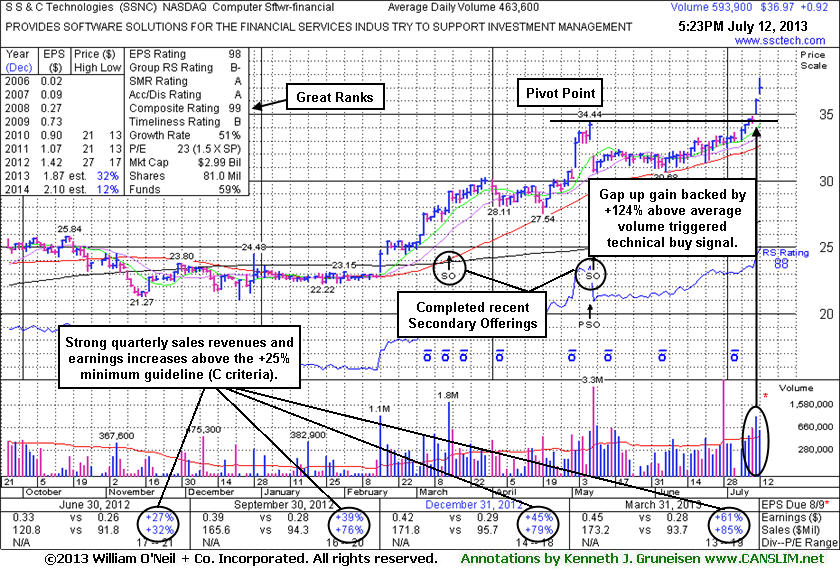
S S & C Technologies Holdings, Inc (SSNC +$0.92 or +2.55% to $36.97) gapped up again, rallying further above its "max buy" level today with lighter but still above average volume. Its color code was changed to green while getting extended from its prior base. Disciplined investors avoid chansing stock extended more than +5% above their prior highs. The stock convincingly cleared the pivot point based on its 5/08/13 high plus 10 cents which was cited in the 7/11/13 mid-day report (read here), triggering a technical buy signal while rising from an orderly base pattern formed above its 50-day moving average (DMA) line. The breakout gain was backed by +124% above average volume, well above the +40% above average volume threshold which is the bare minimum volume needed to trigger a proper technical buy signal.
SSNC completed another Secondary Offering on 5/09/13, while it was previously noted in the 5/20/13 mid-day report - "The high-ranked Computer Software - Financial firm completed previously noted Secondary Offerings on 3/14/13 and on 7/19/12." New institutional owners are often attracted when a company has the help of underwriters in placing shares during offerings.
It has earned high ranks due to its strong earnings history. The past 4 quarterly comparisons through Mar '13 showed earnings increases above the +25% minimum guideline (C criteria) for buy candidates. Its annual earnings (A criteria) history has also been very strong. The number of top-rated funds owning its shares rose from 260 in Dec' 12 to 287 in Jun '13, a reassuring sign concerning the I criteria of the fact-based investment system. Its small supply of only 39.1 million shares in the publicly traded float can contribute to greater price volatility in the event of institutional buying or selling pressure. The Computer Software - Financial industry group currently has a B- Rating, and leadership among other individual issues in the group is a reassuring sign concerning the L criteria.
|
|
|
Color Codes Explained :
Y - Better candidates highlighted by our
staff of experts.
G - Previously featured
in past reports as yellow but may no longer be buyable under the
guidelines.
***Last / Change / Volume data in this table is the closing quote data***
Symbol/Exchange
Company Name
Industry Group |
PRICE |
CHANGE
(%Change) |
Day High |
Volume
(% DAV)
(% 50 day avg vol) |
52 Wk Hi
% From Hi |
Featured
Date |
Price
Featured |
Pivot Featured |
|
Max Buy |
AMBA
-
NASDAQ
Ambarella Inc
ELECTRONICS - Semiconductor - Specialized
|
$17.79
|
-0.01
-0.06% |
$18.10
|
830,249
69.86% of 50 DAV
50 DAV is 1,188,500
|
$18.58
-4.25%
|
5/6/2013
|
$15.31
|
PP = $16.10
|
|
MB = $16.91
|
Most Recent Note - 7/11/2013 7:35:18 PM
G - Posted a solid gain today with average volume. It is extended from a sound base and consolidating above its 50 DMA line - important chart support where a violation would trigger a worrisome technical sell signal.
>>> The latest Featured Stock Update with an annotated graph appeared on 6/27/2013. Click here.
View all notes |
Alert me of new notes |
CANSLIM.net Company Profile |
SEC |
Zacks Reports |
StockTalk |
News |
Chart |
Request a new note
C
A N
S L
I M


|
CELG
-
NASDAQ
Celgene Corp
DRUGS - Drug Manufacturers - Major
|
$134.56
|
-0.36
-0.27% |
$136.36
|
4,005,255
134.31% of 50 DAV
50 DAV is 2,982,000
|
$136.36
-1.32%
|
7/11/2013
|
$133.25
|
PP = $131.92
|
|
MB = $138.52
|
 Most Recent Note - 7/12/2013 6:21:32 PM
Y - Held its ground today. Breakaway gap and solid gain with twice average volume triggered a technical buy signal on the prior session as it finished above the new pivot point cited based on its 5/14/13 high plus 10 cents. See the latest FSU analysis for more details and an annotated graph.
>>> The latest Featured Stock Update with an annotated graph appeared on 7/11/2013. Click here.
View all notes |
Alert me of new notes |
CANSLIM.net Company Profile |
SEC |
Zacks Reports |
StockTalk |
News |
Chart |
Request a new note
C
A N
S L
I M
|
FLT
-
NYSE
Fleetcor Technologies
DIVERSIFIED SERVICES - Business/Management Services
|
$85.97
|
-0.68
-0.78% |
$87.41
|
560,003
64.09% of 50 DAV
50 DAV is 873,800
|
$89.75
-4.21%
|
5/29/2013
|
$86.02
|
PP = $85.66
|
|
MB = $89.94
|
Most Recent Note - 7/9/2013 5:50:14 PM
G- Rose from its 50 DMA line and finished near the session high with below average volume behind its gain. The recent low ($80.28 on 6/21/13) defines important near-term support where a violation would raise more serious concerns.
>>> The latest Featured Stock Update with an annotated graph appeared on 6/28/2013. Click here.
View all notes |
Alert me of new notes |
CANSLIM.net Company Profile |
SEC |
Zacks Reports |
StockTalk |
News |
Chart |
Request a new note
C
A N
S L
I M
|
LOPE
-
NASDAQ
Grand Canyon Education
DIVERSIFIED SERVICES - Education and; Training Services
|
$35.94
|
+0.24
0.67% |
$36.19
|
423,249
95.33% of 50 DAV
50 DAV is 444,000
|
$36.38
-1.21%
|
6/19/2013
|
$31.47
|
PP = $34.17
|
|
MB = $35.88
|
Most Recent Note - 7/12/2013 6:15:29 PM
G - Color code is changed to green after rallying beyond its "max buy" level with today's 5th consecutive gain into new 52-week high territory. Volume-driven gains this week triggered a new technical buy signal. Prior highs in the $34 area define initial support above its 50 DMA line.
>>> The latest Featured Stock Update with an annotated graph appeared on 7/2/2013. Click here.
View all notes |
Alert me of new notes |
CANSLIM.net Company Profile |
SEC |
Zacks Reports |
StockTalk |
News |
Chart |
Request a new note
C
A N
S L
I M
|
PCLN
-
NASDAQ
Priceline.Com Inc
INTERNET - Internet Software and Services
|
$920.39
|
+10.04
1.10% |
$920.92
|
657,534
88.71% of 50 DAV
50 DAV is 741,200
|
$912.86
0.82%
|
7/8/2013
|
$878.28
|
PP = $847.43
|
|
MB = $889.80
|
Most Recent Note - 7/12/2013 6:17:28 PM
G - Posted its 12th gain in the span of 13 sessions getting very extended from its prior base. Prior highs in the $847 area define initial support to watch on pullbacks.
>>> The latest Featured Stock Update with an annotated graph appeared on 7/9/2013. Click here.
View all notes |
Alert me of new notes |
CANSLIM.net Company Profile |
SEC |
Zacks Reports |
StockTalk |
News |
Chart |
Request a new note
C
A N
S L
I M
|
Symbol/Exchange
Company Name
Industry Group |
PRICE |
CHANGE
(%Change) |
Day High |
Volume
(% DAV)
(% 50 day avg vol) |
52 Wk Hi
% From Hi |
Featured
Date |
Price
Featured |
Pivot Featured |
|
Max Buy |
PRLB
-
NYSE
Proto Labs Inc
MANUFACTURING - Small Tools and Accessories
|
$64.07
|
-0.54
-0.84% |
$64.95
|
310,686
67.63% of 50 DAV
50 DAV is 459,400
|
$67.40
-4.94%
|
6/17/2013
|
$59.37
|
PP = $59.94
|
|
MB = $62.94
|
Most Recent Note - 7/8/2013 2:08:25 PM
G- Still holding its ground stubbornly near its 52-week high with volume totals cooling following a "negative reversal" on 6/28/13 with heavy volume. Prior highs near $59 define important near-term support above its 50 DMA line.
>>> The latest Featured Stock Update with an annotated graph appeared on 6/26/2013. Click here.
View all notes |
Alert me of new notes |
CANSLIM.net Company Profile |
SEC |
Zacks Reports |
StockTalk |
News |
Chart |
Request a new note
C
A N
S L
I M
|
RRTS
-
NYSE
Roadrunner Trans Systems
TRANSPORTATION - Air Delivery and Freight Service
|
$29.78
|
+0.04
0.13% |
$30.22
|
123,470
59.59% of 50 DAV
50 DAV is 207,200
|
$30.50
-2.36%
|
4/3/2013
|
$22.77
|
PP = $23.75
|
|
MB = $24.94
|
Most Recent Note - 7/5/2013 6:32:20 PM
G - Finished at the session high and 2 cents off its best-ever close with a gain on below average volume. Wedged higher without great volume conviction after finding support above its 50 DMA line. Perched within close striking distance of its 52-week high.
>>> The latest Featured Stock Update with an annotated graph appeared on 7/3/2013. Click here.
View all notes |
Alert me of new notes |
CANSLIM.net Company Profile |
SEC |
Zacks Reports |
StockTalk |
News |
Chart |
Request a new note
C
A N
S L
I M
|
SSNC
-
NASDAQ
S S & C Technologies
COMPUTER SOFTWARE and SERVICES - Application Software
|
$36.97
|
+0.92
2.55% |
$37.72
|
592,087
127.72% of 50 DAV
50 DAV is 463,600
|
$36.18
2.18%
|
7/11/2013
|
$35.80
|
PP = $34.54
|
|
MB = $36.27
|
Most Recent Note - 7/12/2013 6:11:49 PM
G - Rallied above its "max buy" level and its color code was changed to green. Cleared the pivot point based on its 5/08/13 high plus 10 cents cited in the 7/11/13 mid-day report (read here) and triggered a technical buy signal while rising from an orderly base with a considerable gain backed by +124% above average volume. See the latest FSU analysis for more details and a new annotated graph.
>>> The latest Featured Stock Update with an annotated graph appeared on 7/12/2013. Click here.
View all notes |
Alert me of new notes |
CANSLIM.net Company Profile |
SEC |
Zacks Reports |
StockTalk |
News |
Chart |
Request a new note
C
A N
S L
I M
|
SSYS
-
NASDAQ
Stratasys Ltd
COMPUTER HARDWARE - Computer Peripherals
|
$92.32
|
-1.15
-1.23% |
$94.00
|
612,642
74.14% of 50 DAV
50 DAV is 826,300
|
$95.75
-3.58%
|
7/8/2013
|
$91.44
|
PP = $95.00
|
|
MB = $99.75
|
Most Recent Note - 7/11/2013 1:14:01 PM
Y - Touched a new 52-week high today amid widespread gains. Finished near the session high at a best-ever close with a solid gain on above average volume on the prior session when noted - "Subsequent volume-driven gains above the pivot point based on its 5/14/13 high plus 10 cents may trigger a technical buy signal. Very little resistance remains due to overhead supply."
>>> The latest Featured Stock Update with an annotated graph appeared on 7/8/2013. Click here.
View all notes |
Alert me of new notes |
CANSLIM.net Company Profile |
SEC |
Zacks Reports |
StockTalk |
News |
Chart |
Request a new note
C
A N
S L
I M
|
VRX
-
NYSE
Valeant Pharmaceuticals
DRUGS - Drug Manufacturers - Other
|
$92.90
|
+0.43
0.47% |
$93.36
|
1,346,252
65.72% of 50 DAV
50 DAV is 2,048,600
|
$96.25
-3.48%
|
4/30/2013
|
$60.24
|
PP = $76.66
|
|
MB = $80.49
|
Most Recent Note - 7/12/2013 6:20:00 PM
G- Wedged to a new high close with today's 3rd consecutive gain lacking great volume conviction. Completed a new Public Offering on 6/18/13 following recent M&A news. Concerns were raised by its sub par Mar '13 earnings report.
>>> The latest Featured Stock Update with an annotated graph appeared on 7/5/2013. Click here.
View all notes |
Alert me of new notes |
CANSLIM.net Company Profile |
SEC |
Zacks Reports |
StockTalk |
News |
Chart |
Request a new note
C
A N
S L
I M
|
Symbol/Exchange
Company Name
Industry Group |
PRICE |
CHANGE
(%Change) |
Day High |
Volume
(% DAV)
(% 50 day avg vol) |
52 Wk Hi
% From Hi |
Featured
Date |
Price
Featured |
Pivot Featured |
|
Max Buy |
YNDX
-
NASDAQ
Yandex N V Class A
INTERNET - Internet Information Providers
|
$30.75
|
+0.36
1.18% |
$31.11
|
2,807,056
119.85% of 50 DAV
50 DAV is 2,342,200
|
$30.68
0.23%
|
7/10/2013
|
$29.29
|
PP = $29.59
|
|
MB = $31.07
|
Most Recent Note - 7/12/2013 1:51:16 PM
Y - Hit another new 52-week high with today's 6th consecutive gain. Its gain with +130% above average volume triggered a technical buy signal while rallying above its pivot point on the prior session. When challenging its prior high an annotated weekly graph was included in the 7/10/13 mid-day report (read here) and it was covered in greater detail with an annotated daily graph in that evening's Featured Stock Update (FSU) section of the After Market Update.
>>> The latest Featured Stock Update with an annotated graph appeared on 7/10/2013. Click here.
View all notes |
Alert me of new notes |
CANSLIM.net Company Profile |
SEC |
Zacks Reports |
StockTalk |
News |
Chart |
Request a new note
C
A N
S L
I M
|
|
|
|
THESE ARE NOT BUY RECOMMENDATIONS!
Comments contained in the body of this report are technical
opinions only. The material herein has been obtained
from sources believed to be reliable and accurate, however,
its accuracy and completeness cannot be guaranteed.
This site is not an investment advisor, hence it does
not endorse or recommend any securities or other investments.
Any recommendation contained in this report may not
be suitable for all investors and it is not to be deemed
an offer or solicitation on our part with respect to
the purchase or sale of any securities. All trademarks,
service marks and trade names appearing in this report
are the property of their respective owners, and are
likewise used for identification purposes only.
This report is a service available
only to active Paid Premium Members.
You may opt-out of receiving report notifications
at any time. Questions or comments may be submitted
by writing to Premium Membership Services 665 S.E. 10 Street, Suite 201 Deerfield Beach, FL 33441-5634 or by calling 1-800-965-8307
or 954-785-1121.
|
|
|

