You are not logged in.
This means you
CAN ONLY VIEW reports that were published prior to Monday, April 14, 2025.
You
MUST UPGRADE YOUR MEMBERSHIP if you want to see any current reports.
AFTER MARKET UPDATE - THURSDAY, JULY 10TH, 2014
Previous After Market Report Next After Market Report >>>
|
|
|
|
DOW |
-70.54 |
16,915.07 |
-0.42% |
|
Volume |
639,820,640 |
+15% |
|
Volume |
1,577,328,920 |
-3% |
|
NASDAQ |
-22.83 |
4,396.20 |
-0.52% |
|
Advancers |
941 |
30% |
|
Advancers |
677 |
23% |
|
S&P 500 |
-8.15 |
1,964.68 |
-0.41% |
|
Decliners |
2,127 |
67% |
|
Decliners |
2,207 |
74% |
|
Russell 2000 |
-11.95 |
1,161.86 |
-1.02% |
|
52 Wk Highs |
86 |
|
|
52 Wk Highs |
20 |
|
|
S&P 600 |
-7.02 |
669.21 |
-1.04% |
|
52 Wk Lows |
32 |
|
|
52 Wk Lows |
52 |
|
|
 |
Breadth Negative as Indices Slumped Again
Kenneth J. Gruneisen - Passed the CAN SLIM® Master's Exam
The major averages retreated on Thursday. Volume on the session was mixed, higher than the prior session's volume total on the NYSE and lower on the Nasdaq exchange. Breadth was negative as decliners led advancers by more than a 2-1 margin on the NYSE and by more than a 3-1 margin on the Nasdaq exchange. There were 15 high-ranked companies from the CANSLIM.net Leaders List that made new 52-week highs and appeared on the CANSLIM.net BreakOuts Page, down from the prior session total of 20 stocks. New 52-week highs outnumbered new 52-week lows on the NYSE but new lows trumped new highs on the Nasdaq exchange. There were gains for 4 of the 15 high-ranked companies currently included on the Featured Stocks Page. The market (M criteria) uptrend has clearly come under pressure this week while leadership quickly evaporated. Any new buying efforts should be selective and focused in stocks meeting all key criteria of the fact-based investment system.
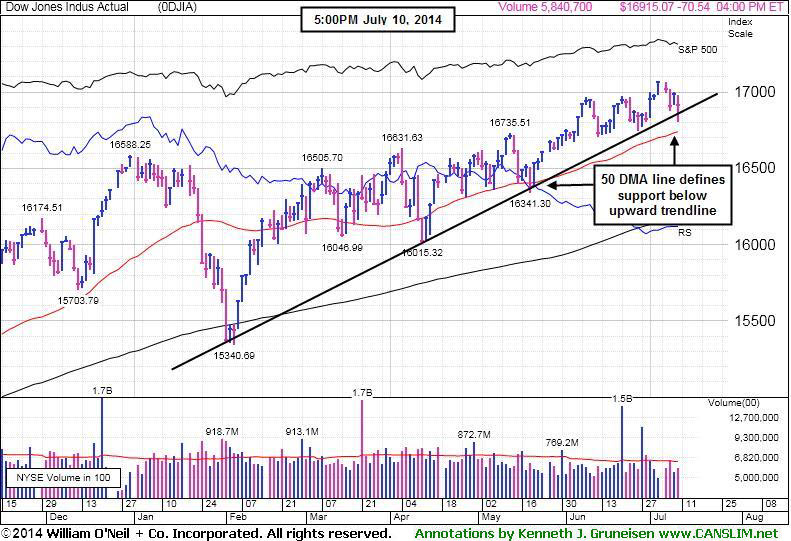
PICTURED: The Dow Jones Industrial Average lost 70 points to 16,915 while testing a multi-month upward trendline defining near-term support above its 50-day moving average (DMA) line.
Stocks fell as renewed sovereign debt fears and prompted another round of profit taking. As a result, a positive employment update was on the back burner. Jobless claims unexpectedly fell by 11,000 last week to more than a one-month low of 304,000. A separate report showed wholesale inventories increased by a less than anticipated +0.5% in May.
Overall, eight of the 10 S&P 500 sectors declined. Consumer discretionary and energy were the worst performing groups. Lumber Liquidators (LL -21.3%) after posting disappointing earnings results and the company cut its full-year forecast. Schlumberger (SLB -1.4%) edged lower. Financials also weighed on the market as Bank of America (BAC -1.1%) and JPMorgan Chase & Co (JPM -0.8%) fell ahead of their second-quarter profit tallies next week. On the upside, telecom and utilities advanced including Verizon (VZ +1.3%) and Dominion Resources (D +1.1%) as investors turned to defensive issues.
Treasuries advanced for a fourth day and a government auction of 30-year bonds attracted average demand. The 10-year note rose 4/32 to yield 2.54%. The 30-year bond gained 2/32 to yield 3.37%.
The CANSLIM.net Featured Stocks Page shows the most action-worthy candidates and their latest notes and a Headline Link directs members to the latest detailed analysis with data-packed graphs annotated by a Certified expert along with links to additional resources. The Premium Member Homepage includes "dynamic archives" to all prior pay reports published. Watch for an announcement via email concerning the next WEBCAST.
|
 Kenneth J. Gruneisen started out as a licensed stockbroker in August 1987, a couple of months prior to the historic stock market crash that took the Dow Jones Industrial Average down -22.6% in a single day. He has published daily fact-based fundamental and technical analysis on high-ranked stocks online for two decades. Through FACTBASEDINVESTING.COM, Kenneth provides educational articles, news, market commentary, and other information regarding proven investment systems that work in good times and bad.
Comments contained in the body of this report are technical opinions only and are not necessarily those of Gruneisen Growth Corp. The material herein has been obtained from sources believed to be reliable and accurate, however, its accuracy and completeness cannot be guaranteed. Our firm, employees, and customers may effect transactions, including transactions contrary to any recommendation herein, or have positions in the securities mentioned herein or options with respect thereto. Any recommendation contained in this report may not be suitable for all investors and it is not to be deemed an offer or solicitation on our part with respect to the purchase or sale of any securities. |
|
 |
Financial, Retail, Tech, and Commodity-Linked Groups Fell
Kenneth J. Gruneisen - Passed the CAN SLIM® Master's Exam
The Retail Index ($RLX -1.19%) and financial shares were negative influences on the major averages on Thursday. The Broker/Dealer Index ($XBD -1.23%) and the Bank Index ($BKX -0.74%) fell. Commodity-linked groups retreated as the Gold & Silver Index ($XAU -1.98%), Oil Services Index ($OSX -1.34%), and the Integrated Oil Index ($XOI -0.85%) slumped. Modest losses for the Networking Index ($NWX -0.72%), Semiconductor Index ($SOX -0.48%), and Biotechnology Index ($BTK -0.44%) rounded out the widely negative session.
Charts courtesy www.stockcharts.com
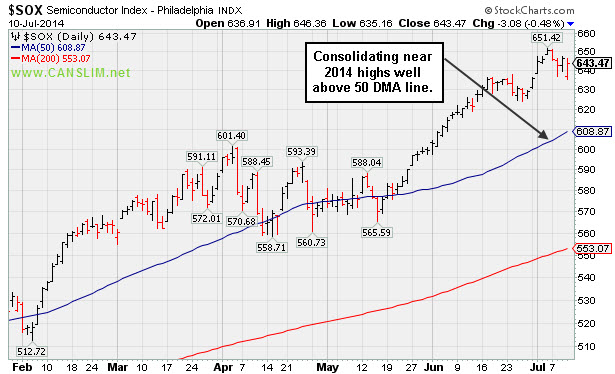
PICTURED: The Semiconductor Index ($SOX -0.48%) is consolidating near 2014 highs well above its 50-day moving average (DMA) line.
| Oil Services |
$OSX |
302.99 |
-4.12 |
-1.34% |
+7.81% |
| Integrated Oil |
$XOI |
1,663.16 |
-14.18 |
-0.85% |
+10.65% |
| Semiconductor |
$SOX |
643.47 |
-3.09 |
-0.48% |
+20.27% |
| Networking |
$NWX |
330.13 |
-2.41 |
-0.72% |
+1.91% |
| Broker/Dealer |
$XBD |
154.63 |
-1.92 |
-1.23% |
-3.70% |
| Retail |
$RLX |
891.55 |
-10.71 |
-1.19% |
-5.13% |
| Gold & Silver |
$XAU |
101.72 |
-2.05 |
-1.98% |
+20.88% |
| Bank |
$BKX |
70.83 |
-0.53 |
-0.74% |
+2.27% |
| Biotech |
$BTK |
2,766.77 |
-12.23 |
-0.44% |
+18.72% |
|
|
|
 |
Forming Handle on Cup-With-Handle Base Pattern
Kenneth J. Gruneisen - Passed the CAN SLIM® Master's Exam
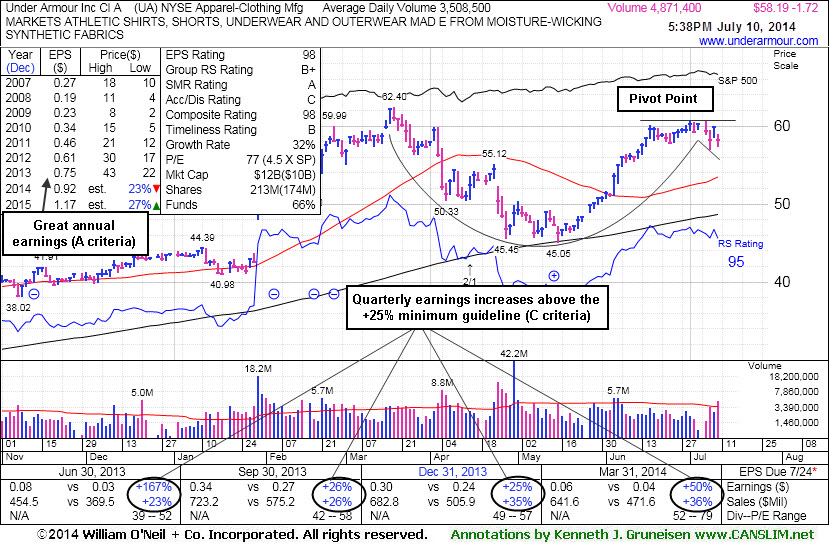
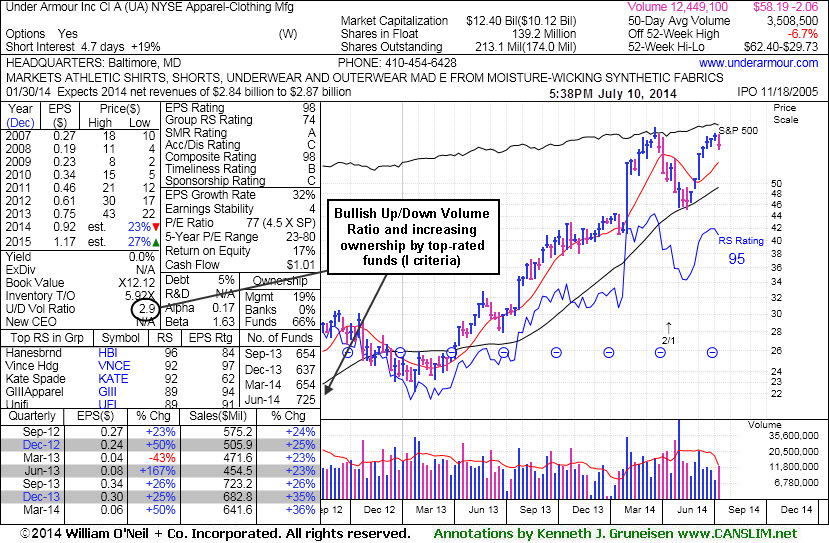
Under Armour Inc (UA -$1.72 or -2.87% to $58.19) encountered distributional pressure today while leadership contracted and the broader market averages retreated from their record highs. It was highlighted in yellow with pivot point based on its 7/01/14 high in the earlier mid-day report (read here). Subsequent volume-driven gains above the pivot point are needed to trigger a proper technical buy signal.
Perched near its 52-week high, it has been forming a handle on the right side of a 17-week cup-with-handle base. One concern is that the recent losses have been backed by near or above average volume, whereas the fact-based investment system's winning models typically saw volume dry up while the handle was formed. That is all the more reason that patience and discipline are paramount, as there is no advantage to be gained by getting in "early" before fresh proof of new and meaningful institutional buying demand drives the price to new highs.
The high-ranked Apparel - Clothing manufacturing firm's quarterly earnings comparisons have been above the +25% guideline (C criteria) through Mar '14 and its annual earnings (A criteria) history has also been strong. The stock found support at its 200-day moving average (DMA) line during its consolidation then rebounded since noted in the 3/20/14 mid-day report with caution - "Since a downturn in the Mar '13 quarter its recent quarterly comparisons have shown earnings increases above the +25% minimum guideline (C criteria) and it has a strong annual earnings (A criteria) history. Patient investors may watch for a new base or secondary buy point to develop and be noted in the weeks ahead."
The number of top-rated funds owning its shares rose from 637 in Dec '13 to 725 in Jun '14, a reassuring trend concerning the I criteria. Its current Up/Down Volume Ratio of 2.9 is an unbiased indication that its shares have been under accumulation over the past 50 days.
|
|
|
Color Codes Explained :
Y - Better candidates highlighted by our
staff of experts.
G - Previously featured
in past reports as yellow but may no longer be buyable under the
guidelines.
***Last / Change / Volume data in this table is the closing quote data***
Symbol/Exchange
Company Name
Industry Group |
PRICE |
CHANGE
(%Change) |
Day High |
Volume
(% DAV)
(% 50 day avg vol) |
52 Wk Hi
% From Hi |
Featured
Date |
Price
Featured |
Pivot Featured |
|
Max Buy |
ACT
-
NYSE
Actavis plc
Medical-Generic Drugs
|
$216.52
|
-0.76
-0.35% |
$217.16
|
1,413,748
61.20% of 50 DAV
50 DAV is 2,310,000
|
$230.77
-6.17%
|
6/20/2014
|
$216.53
|
PP = $230.87
|
|
MB = $242.41
|
Most Recent Note - 7/7/2014 4:33:29 PM
Y - Still hovering within close striking distance of its 52-week high. Subsequent volume-driven gains to new highs may trigger a technical buy signal.
>>> FEATURED STOCK ARTICLE : Volume Above Average as Generic Drug Firm Approaches Highs - 6/24/2014
View all notes |
Set NEW NOTE alert |
CANSLIM.net Company Profile |
SEC
News |
Chart |
Request a new note
C
A N
S L
I M


|
AFSI
-
NASDAQ
Amtrust Financial Svcs
INSURANCE - Property and; Casualty Insurance
|
$40.63
|
-0.67
-1.62% |
$41.50
|
494,385
70.46% of 50 DAV
50 DAV is 701,700
|
$47.10
-13.74%
|
5/21/2014
|
$44.85
|
PP = $44.85
|
|
MB = $47.09
|
Most Recent Note - 7/7/2014 11:58:46 AM
G - Slumping below its 50 DMA line with heavier volume behind today's loss. Faces some resistance due to overhead supply up through the $47 level.
>>> FEATURED STOCK ARTICLE : Found Support Near 50-Day Average and Relative Strength Slightly Improved - 7/1/2014
View all notes |
Set NEW NOTE alert |
CANSLIM.net Company Profile |
SEC
News |
Chart |
Request a new note
C
A N
S L
I M
|
AL
-
NYSE
Air Lease Corp Cl A
DIVERSIFIED SERVICES - Rental and Leasing Services
|
$36.41
|
-0.55
-1.49% |
$36.62
|
953,554
89.03% of 50 DAV
50 DAV is 1,071,000
|
$42.89
-15.11%
|
5/9/2014
|
$38.27
|
PP = $38.25
|
|
MB = $40.16
|
Most Recent Note - 7/7/2014 4:35:01 PM
G - Slumped further below its 50 DMA line today. A subsequent violation of its recent low ($36.55 on 6/13/17) would raise more serious concerns and trigger a worrisome technical sell signal.
>>> FEATURED STOCK ARTICLE : Finding Support Near 50-Day Moving Average Line - 7/2/2014
View all notes |
Set NEW NOTE alert |
CANSLIM.net Company Profile |
SEC
News |
Chart |
Request a new note
C
A N
S L
I M
|
BITA
-
NYSE
Bitauto Hldgs Ltd Ads
Internet-Content
|
$48.06
|
+1.33
2.85% |
$48.17
|
685,293
72.67% of 50 DAV
50 DAV is 943,000
|
$49.67
-3.24%
|
6/26/2014
|
$46.20
|
PP = $47.03
|
|
MB = $49.38
|
 Most Recent Note - 7/10/2014 6:08:51 PM
Y - Managed a "positive reversal" today after trading down considerably earlier. Color code was changed to yellow after the volume-driven loss on 7/08/14. Keep in mind that odds are far more favorable for investors who buy while stocks are rising, rather than accumulating on pullbacks.
>>> FEATURED STOCK ARTICLE : Perched At High With No Resistance Remaining Due to Overhead Supply - 6/27/2014
View all notes |
Set NEW NOTE alert |
CANSLIM.net Company Profile |
SEC
News |
Chart |
Request a new note
C
A N
S L
I M
|
BWLD
-
NASDAQ
Buffalo Wild Wings Inc
LEISURE - Restaurants
|
$157.26
|
-2.20
-1.38% |
$158.56
|
352,315
79.71% of 50 DAV
50 DAV is 442,000
|
$167.36
-6.03%
|
6/19/2014
|
$158.52
|
PP = $159.91
|
|
MB = $167.91
|
Most Recent Note - 7/8/2014 12:40:06 PM
Y - Pulling back today amid widespread weakness. Deterioration leading to a close below the prior high close ($156.35 on 3/21/14) would raise greater concerns and completely negate the recent technical breakout.
>>> FEATURED STOCK ARTICLE : Perched Near Highs With Strong Fundamentals - 6/19/2014
View all notes |
Set NEW NOTE alert |
CANSLIM.net Company Profile |
SEC
News |
Chart |
Request a new note
C
A N
S L
I M
|
Symbol/Exchange
Company Name
Industry Group |
PRICE |
CHANGE
(%Change) |
Day High |
Volume
(% DAV)
(% 50 day avg vol) |
52 Wk Hi
% From Hi |
Featured
Date |
Price
Featured |
Pivot Featured |
|
Max Buy |
EQM
-
NYSE
E Q T Midstream Partners
ENERGY - Oil and Gas Pipelines
|
$93.26
|
+0.01
0.01% |
$94.41
|
208,919
48.36% of 50 DAV
50 DAV is 432,000
|
$102.51
-9.02%
|
12/12/2013
|
$53.17
|
PP = $56.51
|
|
MB = $59.34
|
Most Recent Note - 7/9/2014 5:54:24 PM
G - Still consolidating well above its 50 DMA line. Strength has continued despite fundamental flaws repeatedly noted.
>>> FEATURED STOCK ARTICLE : Strength Continued Despite Fundamental Flaws - 6/25/2014
View all notes |
Set NEW NOTE alert |
CANSLIM.net Company Profile |
SEC
News |
Chart |
Request a new note
C
A N
S L
I M
|
GRFS
-
NASDAQ
Grifols Sa Ads
Medical-Ethical Drugs
|
$40.61
|
-0.37
-0.90% |
$40.84
|
424,090
61.55% of 50 DAV
50 DAV is 689,000
|
$46.66
-12.97%
|
5/15/2014
|
$41.14
|
PP = $43.55
|
|
MB = $45.73
|
Most Recent Note - 7/9/2014 5:48:26 PM
G - Recently slumped below its 50 DMA line with damaging losses. A rebound above the 50 DMA line is needed to help its outlook improve. See the latest FSU analysis for more details and new annotated graphs.
>>> FEATURED STOCK ARTICLE : Violation of 50-Day Moving Average Triggered Technical Sell Signal - 7/9/2014
View all notes |
Set NEW NOTE alert |
CANSLIM.net Company Profile |
SEC
News |
Chart |
Request a new note
C
A N
S L
I M
|
HF
-
NYSE
H F F Inc Cl A
REAL ESTATE - Property Management/Developmen
|
$36.55
|
-0.56
-1.51% |
$36.82
|
111,406
55.98% of 50 DAV
50 DAV is 199,000
|
$38.23
-4.39%
|
6/20/2014
|
$34.60
|
PP = $36.16
|
|
MB = $37.97
|
Most Recent Note - 7/9/2014 5:52:33 PM
Y - Managed a positive reversal today and finished near the session high with a gain on above average volume. Color code was changed to yellow after retreating below its "max buy" level. Prior highs in the $35-36 area define initial support to watch on pullbacks.
>>> FEATURED STOCK ARTICLE : Approached 52-Week High With Volume-Driven Gain - 6/23/2014
View all notes |
Set NEW NOTE alert |
CANSLIM.net Company Profile |
SEC
News |
Chart |
Request a new note
C
A N
S L
I M
|
ICON
-
NASDAQ
Iconix Brand Group Inc
CONSUMER NON-DURABLES - Textile - Apparel Footwear
|
$41.91
|
-0.66
-1.55% |
$42.42
|
435,239
80.01% of 50 DAV
50 DAV is 544,000
|
$44.81
-6.47%
|
6/5/2014
|
$43.54
|
PP = $43.44
|
|
MB = $45.61
|
Most Recent Note - 7/8/2014 6:22:48 PM
Y - Small loss on light volume today led to a close just below its 50 DMA line ($42.44). More damaging losses would raise greater concerns.
>>> FEATURED STOCK ARTICLE : Found Support Above Prior Highs During Consolidation - 6/18/2014
View all notes |
Set NEW NOTE alert |
CANSLIM.net Company Profile |
SEC
News |
Chart |
Request a new note
C
A N
S L
I M
|
PANW
-
NYSE
Palo Alto Networks
Computer Sftwr-Security
|
$76.71
|
+0.55
0.72% |
$76.86
|
1,596,210
85.31% of 50 DAV
50 DAV is 1,871,000
|
$85.78
-10.57%
|
5/29/2014
|
$75.95
|
PP = $72.50
|
|
MB = $76.13
|
Most Recent Note - 7/10/2014 6:11:04 PM
G - Managed a "positive reversal" today after slumping near its 50 DMA line. Further deterioration would raise more serious concerns.
>>> FEATURED STOCK ARTICLE : Gap Up Gain on Above Average Volume for New Highs - 6/30/2014
View all notes |
Set NEW NOTE alert |
CANSLIM.net Company Profile |
SEC
News |
Chart |
Request a new note
C
A N
S L
I M
|
Symbol/Exchange
Company Name
Industry Group |
PRICE |
CHANGE
(%Change) |
Day High |
Volume
(% DAV)
(% 50 day avg vol) |
52 Wk Hi
% From Hi |
Featured
Date |
Price
Featured |
Pivot Featured |
|
Max Buy |
SN
-
NYSE
Sanchez Energy Corp
ENERGY - Independent Oil and Gas
|
$34.25
|
-0.55
-1.58% |
$34.61
|
1,195,193
77.56% of 50 DAV
50 DAV is 1,541,000
|
$38.95
-12.07%
|
5/22/2014
|
$33.00
|
PP = $31.59
|
|
MB = $33.17
|
Most Recent Note - 7/9/2014 5:55:48 PM
G - Consolidating above its 50 DMA line ($32.83) and prior highs near $32 defining important support to watch on pullbacks.
>>> FEATURED STOCK ARTICLE : Recently Featured Stock Outpaced Benchmark S&P 500 Index - 7/3/2014
View all notes |
Set NEW NOTE alert |
CANSLIM.net Company Profile |
SEC
News |
Chart |
Request a new note
C
A N
S L
I M
|
TARO
-
NYSE
Taro Pharmaceutical Inds
DRUGS - Drug Manufacturers - Other
|
$145.30
|
+0.81
0.56% |
$145.70
|
75,302
115.85% of 50 DAV
50 DAV is 65,000
|
$146.64
-0.91%
|
6/26/2014
|
$117.31
|
PP = $118.90
|
|
MB = $124.85
|
Most Recent Note - 7/8/2014 1:09:04 PM
G - Perched near its all-time high and stubbornly holding its ground following considerable volume-driven gains, extended from its prior base. Disciplined investors avoid chasing stocks more than +5% above prior highs.
>>> FEATURED STOCK ARTICLE : Fundamentally Strong Stock Challenging Prior Resistance Level - 6/26/2014
View all notes |
Set NEW NOTE alert |
CANSLIM.net Company Profile |
SEC
News |
Chart |
Request a new note
C
A N
S L
I M
|
TRN
-
NYSE
Trinity Industries Inc
TRANSPORTATION - Railroads
|
$44.13
|
-0.40
-0.90% |
$44.42
|
1,928,968
56.82% of 50 DAV
50 DAV is 3,395,000
|
$46.00
-4.07%
|
4/30/2014
|
$37.79
|
PP = $38.03
|
|
MB = $39.93
|
Most Recent Note - 7/8/2014 6:18:09 PM
G - Consolidating near its 52-week high, extended from its prior base. Its 50 DMA line defines important near-term support to watch. See the latest FSU analysis for more details and new annotated graphs.
>>> FEATURED STOCK ARTICLE : Bullish Up/Down Volume and Increasing Institutional Ownership - 7/8/2014
View all notes |
Set NEW NOTE alert |
CANSLIM.net Company Profile |
SEC
News |
Chart |
Request a new note
C
A N
S L
I M
|
UA
-
NYSE
Under Armour Inc Cl A
CONSUMER NON-DURABLES - Textile - Apparel Clothing
|
$58.19
|
-1.72
-2.87% |
$58.95
|
4,897,243
139.60% of 50 DAV
50 DAV is 3,508,000
|
$62.40
-6.74%
|
7/10/2014
|
$58.50
|
PP = $60.79
|
|
MB = $63.83
|
Most Recent Note - 7/10/2014 6:05:46 PM
Y - Quarterly earnings comparisons have been above the +25% guideline (C criteria) through Mar '14 and its annual earnings (A criteria) history has been strong. It was highlighted in yellow with pivot point based on its 7/01/14 high in the earlier mid-day report (read here) trading near its 52-week high, forming a handle on the right side of a 17-week cup-with-handle base. Subsequent volume-driven gains above the pivot point are needed to trigger a proper technical buy signal. See the latest FSU analysis for more details and new annotated graphs.
>>> FEATURED STOCK ARTICLE : Forming Handle on Cup-With-Handle Base Pattern - 7/10/2014
View all notes |
Set NEW NOTE alert |
CANSLIM.net Company Profile |
SEC
News |
Chart |
Request a new note
C
A N
S L
I M
|
WLK
-
NYSE
Westlake Chemical Corp
CHEMICALS - Specialty Chemicals
|
$84.36
|
-1.02
-1.19% |
$84.81
|
383,892
54.30% of 50 DAV
50 DAV is 707,000
|
$85.94
-1.84%
|
4/29/2014
|
$72.79
|
PP = $69.31
|
|
MB = $72.78
|
Most Recent Note - 7/7/2014 5:56:05 PM
G - Perched at its 52-week high, extended from any sound base pattern. Its 50 DMA line defines important near-term support to watch on pullbacks. See the latest FSU analysis for more details and new annotated graphs.
>>> FEATURED STOCK ARTICLE : Great Ranks and Reassuring Leadership in Chemical Group - 7/7/2014
View all notes |
Set NEW NOTE alert |
CANSLIM.net Company Profile |
SEC
News |
Chart |
Request a new note
C
A N
S L
I M
|
Symbol/Exchange
Company Name
Industry Group |
PRICE |
CHANGE
(%Change) |
Day High |
Volume
(% DAV)
(% 50 day avg vol) |
52 Wk Hi
% From Hi |
Featured
Date |
Price
Featured |
Pivot Featured |
|
Max Buy |
|
|
|
THESE ARE NOT BUY RECOMMENDATIONS!
Comments contained in the body of this report are technical
opinions only. The material herein has been obtained
from sources believed to be reliable and accurate, however,
its accuracy and completeness cannot be guaranteed.
This site is not an investment advisor, hence it does
not endorse or recommend any securities or other investments.
Any recommendation contained in this report may not
be suitable for all investors and it is not to be deemed
an offer or solicitation on our part with respect to
the purchase or sale of any securities. All trademarks,
service marks and trade names appearing in this report
are the property of their respective owners, and are
likewise used for identification purposes only.
This report is a service available
only to active Paid Premium Members.
You may opt-out of receiving report notifications
at any time. Questions or comments may be submitted
by writing to Premium Membership Services 665 S.E. 10 Street, Suite 201 Deerfield Beach, FL 33441-5634 or by calling 1-800-965-8307
or 954-785-1121.
|
|
|

