You are not logged in.
This means you
CAN ONLY VIEW reports that were published prior to Monday, April 14, 2025.
You
MUST UPGRADE YOUR MEMBERSHIP if you want to see any current reports.
AFTER MARKET UPDATE - WEDNESDAY, JULY 9TH, 2014
Previous After Market Report Next After Market Report >>>
|
|
|
|
DOW |
+78.99 |
16,985.61 |
+0.47% |
|
Volume |
557,146,660 |
-17% |
|
Volume |
1,622,683,240 |
-20% |
|
NASDAQ |
+27.57 |
4,419.03 |
+0.63% |
|
Advancers |
1,755 |
55% |
|
Advancers |
1,516 |
53% |
|
S&P 500 |
+9.12 |
1,972.83 |
+0.46% |
|
Decliners |
1,274 |
40% |
|
Decliners |
1,209 |
43% |
|
Russell 2000 |
+1.66 |
1,173.81 |
+0.14% |
|
52 Wk Highs |
96 |
|
|
52 Wk Highs |
35 |
|
|
S&P 600 |
+0.60 |
676.23 |
+0.09% |
|
52 Wk Lows |
17 |
|
|
52 Wk Lows |
27 |
|
|
 |
Major Indices Rose With Less Volume Conviction
Kenneth J. Gruneisen - Passed the CAN SLIM® Master's Exam
Stocks finished higher for the first time in three sessions on Wednesday as the major averages posted gains. Volume on the session was lighter than the prior session's volume totals on both the NYSE and on the Nasdaq exchange which indicated a lack of buying enthusiasm from the institutional crowd. Advancers led decliners by almost a 3-2 margin on the NYSE and by a 5-4 margin on the Nasdaq exchange. There were 20 high-ranked companies from the CANSLIM.net Leaders List that made new 52-week highs and appeared on the CANSLIM.net BreakOuts Page, up from the prior session total of 6 stocks. New 52-week highs outnumbered new 52-week lows on the NYSE and on the Nasdaq exchange. There were gains for 11 of the 14 high-ranked companies currently included on the Featured Stocks Page. The market (M criteria) uptrend clearly came under pressure on the prior session while leadership quickly evaporated. Any new buying efforts should be selective and focused in stocks meeting all key criteria of the fact-based investment system.
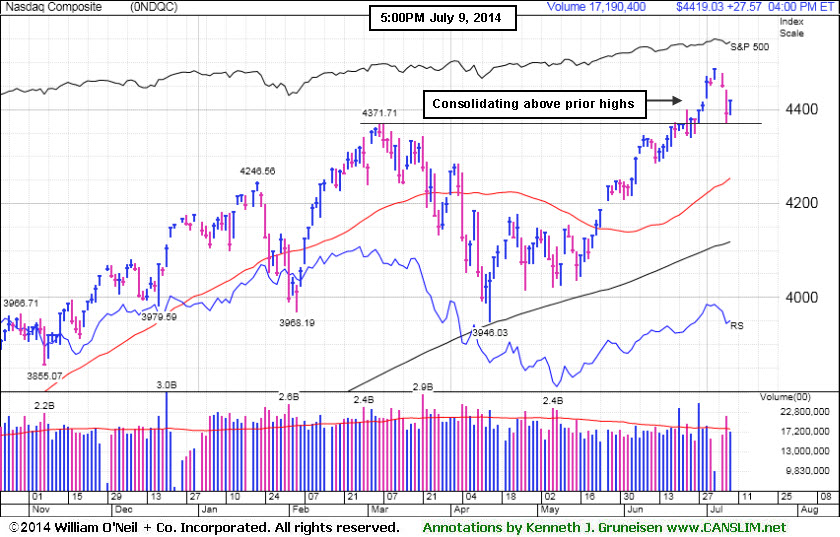
PICTURED: The Nasdaq Composite Index rebounded from its worst day since May as it increased 27 points to 4,419 while consolidating above its prior highs.
Investors were focused on the start of second-quarter earnings season and the Fed. Alcoa (AA +5.5%) rose after posting earnings results well above analyst estimates. Other profit tallies were weak. The Container Store (TCS -8.4%) fell and Bob Evans (BOBE -4.4%) slumped after both companies missed profit expectations and delivered disappointing full-year outlooks.
On the monetary policy front, minutes from the June FOMC meeting revealed the central bank will end its monthly bond-buying program in October and interest rates will likely remain low for a "considerable time". In addition, some officials expressed concern about low volatility in the market and said the central bank should monitor excessive risk-taking.
Nine of the 10 S&P 500 sectors advanced. Consumer discretionary and energy were the best performing groups as Comcast (CMCSA +2.6%) and Exxon Mobil (XOM +0.7%) rose.
Treasuries were little changed and a government auction of 10-year notes attracted below-average demand. The 10-year note increased 1/32 to yield 2.55%. The 30-year bond was flat to yield 3.37%.
The CANSLIM.net Featured Stocks Page shows the most action-worthy candidates and their latest notes and a Headline Link directs members to the latest detailed analysis with data-packed graphs annotated by a Certified expert along with links to additional resources. The Premium Member Homepage includes "dynamic archives" to all prior pay reports published. Watch for an announcement via email concerning the next WEBCAST.
|
 Kenneth J. Gruneisen started out as a licensed stockbroker in August 1987, a couple of months prior to the historic stock market crash that took the Dow Jones Industrial Average down -22.6% in a single day. He has published daily fact-based fundamental and technical analysis on high-ranked stocks online for two decades. Through FACTBASEDINVESTING.COM, Kenneth provides educational articles, news, market commentary, and other information regarding proven investment systems that work in good times and bad.
Comments contained in the body of this report are technical opinions only and are not necessarily those of Gruneisen Growth Corp. The material herein has been obtained from sources believed to be reliable and accurate, however, its accuracy and completeness cannot be guaranteed. Our firm, employees, and customers may effect transactions, including transactions contrary to any recommendation herein, or have positions in the securities mentioned herein or options with respect thereto. Any recommendation contained in this report may not be suitable for all investors and it is not to be deemed an offer or solicitation on our part with respect to the purchase or sale of any securities. |
|
 |
Gold & Silver, Retail, and Tech Indices Rose
Kenneth J. Gruneisen - Passed the CAN SLIM® Master's Exam
The Retail Index ($RLX +0.82%) was a positive influence on the major averages on Wednesday. The tech sector saw unanimous gains from the Networking Index ($NWX +0.60%), Semiconductor Index ($SOX +0.61%), and the Biotechnology Index ($BTK +1.40%). Financial shares were mixed as the Broker/Dealer Index ($XBD -0.46%) edged lower and the Bank Index ($BKX +0.38%) posted a small gain. Energy-related shares drifted higher as the Integrated Oil Index ($XOI +0.33%) and the Oil Services Index ($OSX +0.37%) both posted small gains. The Gold & Silver Index ($XAU +2.59%) was a standout gainer.
Charts courtesy www.stockcharts.com
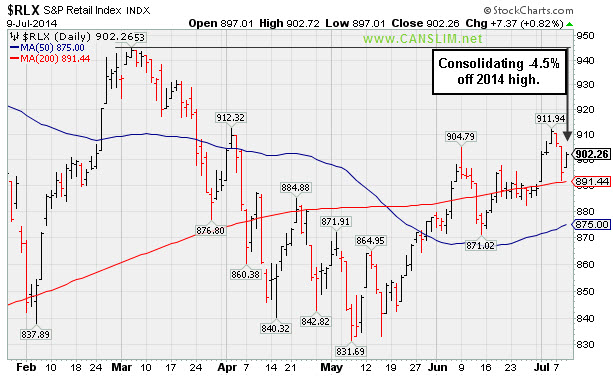
PICTURED: The Retail Index ($RLX +0.82%) is consolidating above its 50-day moving average (DMA) line and -4.5% off its 2014 high.
| Oil Services |
$OSX |
307.11 |
+1.13 |
+0.37% |
+9.28% |
| Integrated Oil |
$XOI |
1,677.33 |
+5.59 |
+0.33% |
+11.59% |
| Semiconductor |
$SOX |
646.56 |
+3.92 |
+0.61% |
+20.85% |
| Networking |
$NWX |
332.53 |
+1.97 |
+0.60% |
+2.65% |
| Broker/Dealer |
$XBD |
156.55 |
-0.72 |
-0.46% |
-2.50% |
| Retail |
$RLX |
902.26 |
+7.37 |
+0.82% |
-3.99% |
| Gold & Silver |
$XAU |
103.77 |
+2.62 |
+2.59% |
+23.32% |
| Bank |
$BKX |
71.36 |
+0.27 |
+0.38% |
+3.03% |
| Biotech |
$BTK |
2,778.99 |
+38.40 |
+1.40% |
+19.25% |
|
|
|
 |
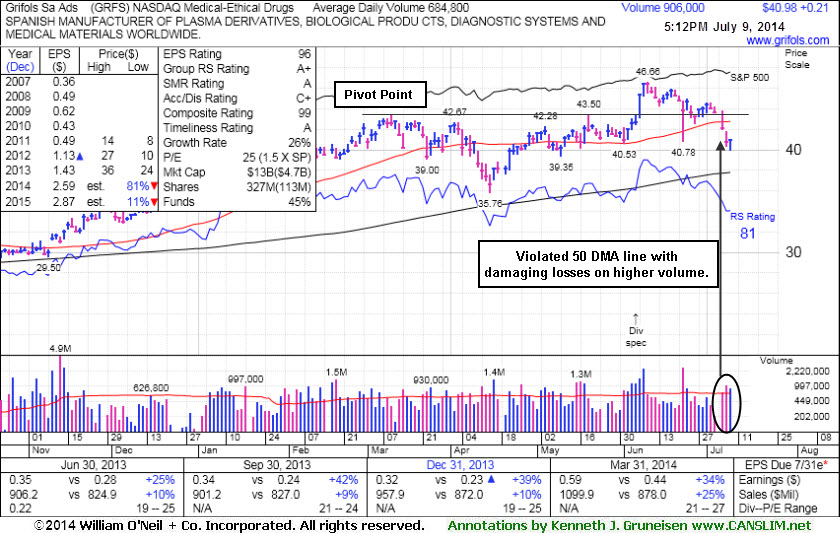
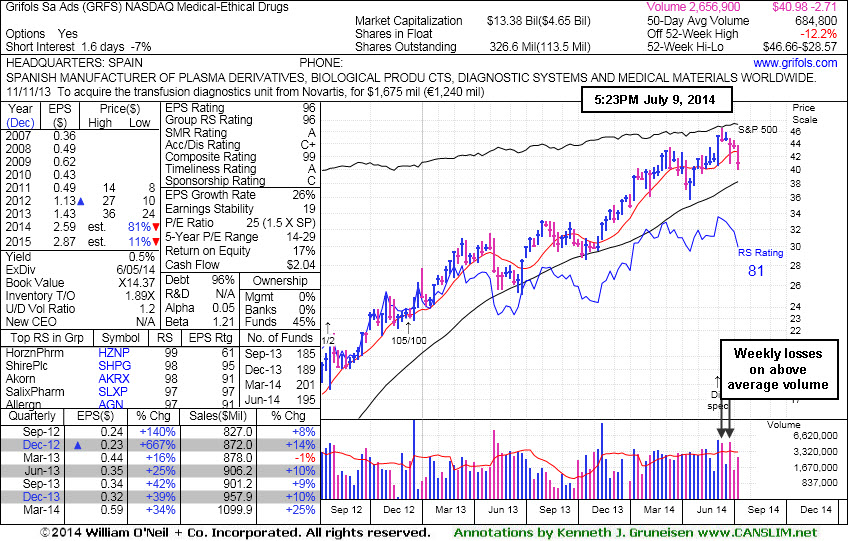
Violation of 50-Day Moving Average Triggered Technical Sell Signal
Kenneth J. Gruneisen - Passed the CAN SLIM® Master's Exam
Grifols Sa Ads (GRFS +$0.21 or +0.52% to $40.98) recently slumped below its 50-day moving average (DMA) line with damaging losses on higher volume. A rebound above its 50 DMA line is needed for its outlook to improve. Disciplined investors always limit losses by selling any stock that falls more than -7% from their purchase price. It was last shown in this FSU section on 6/17/14 with annotated graphs under the headline, "Consolidating Just Below 'Max Buy' Level", following its technical breakout.
This Spanish firm from the Medical- Ethical Drugs industry was first highlighted in yellow at $41.14 with pivot point cited based on its 3/11/14 high plus 10 cents in the 5/15/14 mid-day report (read here). Technically, it triggered a buy signal with a volume-driven gain on 6/06/14 but stalled soon thereafter.
It reported earnings +34% on +25% sales revenues for the Mar '14 quarter, marking its 4th consecutive quarter with earnings above the +25% minimum guideline (C criteria). Its annual earnings history (A criteria) has also been strong. The number of top-rated funds owning its shares rose from 186 in Sep '13 to 195 in Jun '14, a reassuring sign of institutional buying demand (I criteria). Its current Up/Down Volume Ratio of 1.2 is an unbiased indication that its shares have been under accumulation over the past 50 days.
|
|
|
Color Codes Explained :
Y - Better candidates highlighted by our
staff of experts.
G - Previously featured
in past reports as yellow but may no longer be buyable under the
guidelines.
***Last / Change / Volume data in this table is the closing quote data***
Symbol/Exchange
Company Name
Industry Group |
PRICE |
CHANGE
(%Change) |
Day High |
Volume
(% DAV)
(% 50 day avg vol) |
52 Wk Hi
% From Hi |
Featured
Date |
Price
Featured |
Pivot Featured |
|
Max Buy |
ACT
-
NYSE
Actavis plc
Medical-Generic Drugs
|
$217.28
|
+0.39
0.18% |
$217.78
|
2,263,909
97.92% of 50 DAV
50 DAV is 2,312,000
|
$230.77
-5.85%
|
6/20/2014
|
$216.53
|
PP = $230.87
|
|
MB = $242.41
|
Most Recent Note - 7/7/2014 4:33:29 PM
Y - Still hovering within close striking distance of its 52-week high. Subsequent volume-driven gains to new highs may trigger a technical buy signal.
>>> FEATURED STOCK ARTICLE : Volume Above Average as Generic Drug Firm Approaches Highs - 6/24/2014
View all notes |
Set NEW NOTE alert |
CANSLIM.net Company Profile |
SEC
News |
Chart |
Request a new note
C
A N
S L
I M


|
AFSI
-
NASDAQ
Amtrust Financial Svcs
INSURANCE - Property and; Casualty Insurance
|
$41.30
|
-0.03
-0.07% |
$41.67
|
247,111
35.16% of 50 DAV
50 DAV is 702,900
|
$47.10
-12.31%
|
5/21/2014
|
$44.85
|
PP = $44.85
|
|
MB = $47.09
|
Most Recent Note - 7/7/2014 11:58:46 AM
G - Slumping below its 50 DMA line with heavier volume behind today's loss. Faces some resistance due to overhead supply up through the $47 level.
>>> FEATURED STOCK ARTICLE : Found Support Near 50-Day Average and Relative Strength Slightly Improved - 7/1/2014
View all notes |
Set NEW NOTE alert |
CANSLIM.net Company Profile |
SEC
News |
Chart |
Request a new note
C
A N
S L
I M
|
AL
-
NYSE
Air Lease Corp Cl A
DIVERSIFIED SERVICES - Rental and Leasing Services
|
$36.96
|
+0.23
0.63% |
$37.32
|
680,297
62.87% of 50 DAV
50 DAV is 1,082,000
|
$42.89
-13.83%
|
5/9/2014
|
$38.27
|
PP = $38.25
|
|
MB = $40.16
|
Most Recent Note - 7/7/2014 4:35:01 PM
G - Slumped further below its 50 DMA line today. A subsequent violation of its recent low ($36.55 on 6/13/17) would raise more serious concerns and trigger a worrisome technical sell signal.
>>> FEATURED STOCK ARTICLE : Finding Support Near 50-Day Moving Average Line - 7/2/2014
View all notes |
Set NEW NOTE alert |
CANSLIM.net Company Profile |
SEC
News |
Chart |
Request a new note
C
A N
S L
I M
|
BITA
-
NYSE
Bitauto Hldgs Ltd Ads
Internet-Content
|
$46.73
|
+0.68
1.48% |
$47.21
|
754,114
79.63% of 50 DAV
50 DAV is 947,000
|
$49.67
-5.92%
|
6/26/2014
|
$46.20
|
PP = $47.03
|
|
MB = $49.38
|
Most Recent Note - 7/8/2014 12:25:36 PM
Y - Down considerably today with above average volume amid widespread weakness in China-based companies. Prior highs near $46 define initial support to watch. Color code is changed to yellow after the pullback. Keep in mind that odds are far more favorable for investors who buy while stocks are rising, rather than accumulating on pullbacks.
>>> FEATURED STOCK ARTICLE : Perched At High With No Resistance Remaining Due to Overhead Supply - 6/27/2014
View all notes |
Set NEW NOTE alert |
CANSLIM.net Company Profile |
SEC
News |
Chart |
Request a new note
C
A N
S L
I M
|
BWLD
-
NASDAQ
Buffalo Wild Wings Inc
LEISURE - Restaurants
|
$159.46
|
+2.50
1.59% |
$160.11
|
322,573
70.43% of 50 DAV
50 DAV is 458,000
|
$167.36
-4.72%
|
6/19/2014
|
$158.52
|
PP = $159.91
|
|
MB = $167.91
|
Most Recent Note - 7/8/2014 12:40:06 PM
Y - Pulling back today amid widespread weakness. Deterioration leading to a close below the prior high close ($156.35 on 3/21/14) would raise greater concerns and completely negate the recent technical breakout.
>>> FEATURED STOCK ARTICLE : Perched Near Highs With Strong Fundamentals - 6/19/2014
View all notes |
Set NEW NOTE alert |
CANSLIM.net Company Profile |
SEC
News |
Chart |
Request a new note
C
A N
S L
I M
|
Symbol/Exchange
Company Name
Industry Group |
PRICE |
CHANGE
(%Change) |
Day High |
Volume
(% DAV)
(% 50 day avg vol) |
52 Wk Hi
% From Hi |
Featured
Date |
Price
Featured |
Pivot Featured |
|
Max Buy |
EQM
-
NYSE
E Q T Midstream Partners
ENERGY - Oil and Gas Pipelines
|
$93.25
|
+0.56
0.60% |
$93.60
|
196,969
45.91% of 50 DAV
50 DAV is 429,000
|
$102.51
-9.03%
|
12/12/2013
|
$53.17
|
PP = $56.51
|
|
MB = $59.34
|
 Most Recent Note - 7/9/2014 5:54:24 PM
G - Still consolidating well above its 50 DMA line. Strength has continued despite fundamental flaws repeatedly noted.
>>> FEATURED STOCK ARTICLE : Strength Continued Despite Fundamental Flaws - 6/25/2014
View all notes |
Set NEW NOTE alert |
CANSLIM.net Company Profile |
SEC
News |
Chart |
Request a new note
C
A N
S L
I M
|
GRFS
-
NASDAQ
Grifols Sa Ads
Medical-Ethical Drugs
|
$40.98
|
+0.21
0.52% |
$41.00
|
906,061
132.47% of 50 DAV
50 DAV is 684,000
|
$46.66
-12.17%
|
5/15/2014
|
$41.14
|
PP = $43.55
|
|
MB = $45.73
|
Most Recent Note - 7/9/2014 5:48:26 PM
G - Recently slumped below its 50 DMA line with damaging losses. A rebound above the 50 DMA line is needed to help its outlook improve. See the latest FSU analysis for more details and new annotated graphs.
>>> FEATURED STOCK ARTICLE : Violation of 50-Day Moving Average Triggered Technical Sell Signal - 7/9/2014
View all notes |
Set NEW NOTE alert |
CANSLIM.net Company Profile |
SEC
News |
Chart |
Request a new note
C
A N
S L
I M
|
HF
-
NYSE
H F F Inc Cl A
REAL ESTATE - Property Management/Developmen
|
$37.11
|
+0.70
1.92% |
$37.22
|
269,047
137.27% of 50 DAV
50 DAV is 196,000
|
$38.23
-2.93%
|
6/20/2014
|
$34.60
|
PP = $36.16
|
|
MB = $37.97
|
Most Recent Note - 7/9/2014 5:52:33 PM
Y - Managed a positive reversal today and finished near the session high with a gain on above average volume. Color code was changed to yellow after retreating below its "max buy" level. Prior highs in the $35-36 area define initial support to watch on pullbacks.
>>> FEATURED STOCK ARTICLE : Approached 52-Week High With Volume-Driven Gain - 6/23/2014
View all notes |
Set NEW NOTE alert |
CANSLIM.net Company Profile |
SEC
News |
Chart |
Request a new note
C
A N
S L
I M
|
ICON
-
NASDAQ
Iconix Brand Group Inc
CONSUMER NON-DURABLES - Textile - Apparel Footwear
|
$42.57
|
+0.31
0.73% |
$42.76
|
501,657
90.55% of 50 DAV
50 DAV is 554,000
|
$44.81
-5.00%
|
6/5/2014
|
$43.54
|
PP = $43.44
|
|
MB = $45.61
|
Most Recent Note - 7/8/2014 6:22:48 PM
Y - Small loss on light volume today led to a close just below its 50 DMA line ($42.44). More damaging losses would raise greater concerns.
>>> FEATURED STOCK ARTICLE : Found Support Above Prior Highs During Consolidation - 6/18/2014
View all notes |
Set NEW NOTE alert |
CANSLIM.net Company Profile |
SEC
News |
Chart |
Request a new note
C
A N
S L
I M
|
PANW
-
NYSE
Palo Alto Networks
Computer Sftwr-Security
|
$76.16
|
+0.80
1.06% |
$76.74
|
1,284,616
68.15% of 50 DAV
50 DAV is 1,885,000
|
$85.78
-11.21%
|
5/29/2014
|
$75.95
|
PP = $72.50
|
|
MB = $76.13
|
Most Recent Note - 7/8/2014 1:27:25 PM
G - Down considerably today on above average volume. On the prior session it was noted as it finished near the session low and below its 3/18/14 closing price ($79.82) raising some concerns.
>>> FEATURED STOCK ARTICLE : Gap Up Gain on Above Average Volume for New Highs - 6/30/2014
View all notes |
Set NEW NOTE alert |
CANSLIM.net Company Profile |
SEC
News |
Chart |
Request a new note
C
A N
S L
I M
|
Symbol/Exchange
Company Name
Industry Group |
PRICE |
CHANGE
(%Change) |
Day High |
Volume
(% DAV)
(% 50 day avg vol) |
52 Wk Hi
% From Hi |
Featured
Date |
Price
Featured |
Pivot Featured |
|
Max Buy |
SN
-
NYSE
Sanchez Energy Corp
ENERGY - Independent Oil and Gas
|
$34.80
|
-0.04
-0.11% |
$35.32
|
1,063,360
68.52% of 50 DAV
50 DAV is 1,552,000
|
$38.95
-10.65%
|
5/22/2014
|
$33.00
|
PP = $31.59
|
|
MB = $33.17
|
Most Recent Note - 7/9/2014 5:55:48 PM
G - Consolidating above its 50 DMA line ($32.83) and prior highs near $32 defining important support to watch on pullbacks.
>>> FEATURED STOCK ARTICLE : Recently Featured Stock Outpaced Benchmark S&P 500 Index - 7/3/2014
View all notes |
Set NEW NOTE alert |
CANSLIM.net Company Profile |
SEC
News |
Chart |
Request a new note
C
A N
S L
I M
|
TARO
-
NYSE
Taro Pharmaceutical Inds
DRUGS - Drug Manufacturers - Other
|
$144.49
|
-0.96
-0.66% |
$146.64
|
59,786
93.42% of 50 DAV
50 DAV is 64,000
|
$146.64
-1.47%
|
6/26/2014
|
$117.31
|
PP = $118.90
|
|
MB = $124.85
|
Most Recent Note - 7/8/2014 1:09:04 PM
G - Perched near its all-time high and stubbornly holding its ground following considerable volume-driven gains, extended from its prior base. Disciplined investors avoid chasing stocks more than +5% above prior highs.
>>> FEATURED STOCK ARTICLE : Fundamentally Strong Stock Challenging Prior Resistance Level - 6/26/2014
View all notes |
Set NEW NOTE alert |
CANSLIM.net Company Profile |
SEC
News |
Chart |
Request a new note
C
A N
S L
I M
|
TRN
-
NYSE
Trinity Industries Inc
TRANSPORTATION - Railroads
|
$44.53
|
+0.57
1.30% |
$44.70
|
1,315,889
38.39% of 50 DAV
50 DAV is 3,428,000
|
$46.00
-3.20%
|
4/30/2014
|
$37.79
|
PP = $38.03
|
|
MB = $39.93
|
Most Recent Note - 7/8/2014 6:18:09 PM
G - Consolidating near its 52-week high, extended from its prior base. Its 50 DMA line defines important near-term support to watch. See the latest FSU analysis for more details and new annotated graphs.
>>> FEATURED STOCK ARTICLE : Bullish Up/Down Volume and Increasing Institutional Ownership - 7/8/2014
View all notes |
Set NEW NOTE alert |
CANSLIM.net Company Profile |
SEC
News |
Chart |
Request a new note
C
A N
S L
I M
|
WLK
-
NYSE
Westlake Chemical Corp
CHEMICALS - Specialty Chemicals
|
$85.38
|
+1.16
1.38% |
$85.41
|
440,263
61.83% of 50 DAV
50 DAV is 712,000
|
$85.94
-0.65%
|
4/29/2014
|
$72.79
|
PP = $69.31
|
|
MB = $72.78
|
Most Recent Note - 7/7/2014 5:56:05 PM
G - Perched at its 52-week high, extended from any sound base pattern. Its 50 DMA line defines important near-term support to watch on pullbacks. See the latest FSU analysis for more details and new annotated graphs.
>>> FEATURED STOCK ARTICLE : Great Ranks and Reassuring Leadership in Chemical Group - 7/7/2014
View all notes |
Set NEW NOTE alert |
CANSLIM.net Company Profile |
SEC
News |
Chart |
Request a new note
C
A N
S L
I M
|
|
|
|
THESE ARE NOT BUY RECOMMENDATIONS!
Comments contained in the body of this report are technical
opinions only. The material herein has been obtained
from sources believed to be reliable and accurate, however,
its accuracy and completeness cannot be guaranteed.
This site is not an investment advisor, hence it does
not endorse or recommend any securities or other investments.
Any recommendation contained in this report may not
be suitable for all investors and it is not to be deemed
an offer or solicitation on our part with respect to
the purchase or sale of any securities. All trademarks,
service marks and trade names appearing in this report
are the property of their respective owners, and are
likewise used for identification purposes only.
This report is a service available
only to active Paid Premium Members.
You may opt-out of receiving report notifications
at any time. Questions or comments may be submitted
by writing to Premium Membership Services 665 S.E. 10 Street, Suite 201 Deerfield Beach, FL 33441-5634 or by calling 1-800-965-8307
or 954-785-1121.
|
|
|

