You are not logged in.
This means you
CAN ONLY VIEW reports that were published prior to Monday, April 14, 2025.
You
MUST UPGRADE YOUR MEMBERSHIP if you want to see any current reports.
AFTER MARKET UPDATE - MONDAY, JULY 8TH, 2013
Previous After Market Report Next After Market Report >>>
|
|
|
|
DOW |
+88.85 |
15,224.69 |
+0.59% |
|
Volume |
906,704,350 |
+45% |
|
Volume |
1,458,920,600 |
+19% |
|
NASDAQ |
+5.45 |
3,484.83 |
+0.16% |
|
Advancers |
1,789 |
57% |
|
Advancers |
1,401 |
54% |
|
S&P 500 |
+8.57 |
1,640.46 |
+0.53% |
|
Decliners |
1,264 |
40% |
|
Decliners |
1,093 |
42% |
|
Russell 2000 |
+3.86 |
1,009.25 |
+0.38% |
|
52 Wk Highs |
279 |
|
|
52 Wk Highs |
387 |
|
|
S&P 600 |
+1.97 |
570.12 |
+0.35% |
|
52 Wk Lows |
47 |
|
|
52 Wk Lows |
17 |
|
|
 |
Leadership Expands Behind Latest Rally Effort
Kenneth J. Gruneisen - Passed the CAN SLIM® Master's Exam
The major averages built upon 2 winning weeks as Monday's gains helped them to rebound further above their respective 50-day moving average lines. Higher volume totals on the NYSE and on the Nasdaq exchange also hinted at an increase in institutional buying demand. Breadth was positive as advancers outnumbered decliners by nearly a 3-2 margin on the NYSE and on the Nasdaq exchange. There were 133 high-ranked companies from the CANSLIM.net Leaders List made new 52-week highs and appeared on the CANSLIM.net BreakOuts Page, up from the prior session total of 96 stocks. The list of stocks hitting new 52-week highs expanded and easily outnumbered new 52-week lows on both the NYSE and the Nasdaq exchange. However, there were gains for only 4 of the 10 high-ranked companies currently included on the Featured Stocks Page, a disconcertingly weak showing versus the broader market's positive breadth.
On the economic front, a report showed consumer credit unexpectedly climbed $19.6 billion in May, above the consensus estimate for a $12.5 billion increase.
Wal-Mart Stores Inc (WMT +2.0%) and United Health Inc (UNH +2.1%) contributed as the major averages extended their gains for a third straight session. Eight of 10 sectors were higher on the session. Utilities including Exelon Corp ( EXC +2.4%) and the consumer discretionary group were best performers. Netflix Inc (NFLX +3.6%) rose after the online video streaming company said it extended a multi-year licensing agreement with CBS Corp (CBS +1.6%). Telecom was the worst performing sector as Sprint Nextel Corp (S -1.3%) edged lower. Technology also underperformed led by Intel Corp's (INTC -3.6%) loss. Attention turned to the start of second-quarter earnings season as Alcoa Inc (AA +1.4%) reported following the close.
Treasuries were higher to snap a three day retreat. The price of the 10-year note rose 26/32 to yield 2.64%.
Tuesday's session marks Day 10 of the current rally attempt. Disciplined investors will note that the market (M criteria) did not produce a follow-through day within the most ideal period between days 4-7 of a new rally attempt. In spite of the recent rebound there is still a need for caution until a new rally is confirmed by a proper follow-through day (FTD) of meaningful gains (+1.4% or greater) from at least one of the major averages on higher volume coupled with an expansion in leadership (stocks hitting new 52-week highs). The rally attempt remains valid unless the Day 1 lows are violated which would clearly indicate deterioration and signal that the correction is worsening.
Upcoming CANSLIM.net reports will observe and explain any noteworthy shifts in the market direction (M criteria) while especially highlighting the characteristics and important details in the bold portion of this commentary. Regular readers are aware via prior reports since early June repeatedly reminding members - "Be protective of any gains, and limit losses! Be especially watchful for any individual issues flashing technical sell signals. It is vitally important to your success with the fact-based investment system to reduce exposure and preserve cash during market downdrafts."
Individual leaders best matching the winning models of the fact-based investment system are on the Featured Stocks Page - with our Certified experts' latest notes and links to additional resources including detailed analysis with annotated graphs. The Premium Member Homepage - includes "dynamic archives" to all prior pay reports published. Watch for an announcement via email concerning the next WEBCAST.
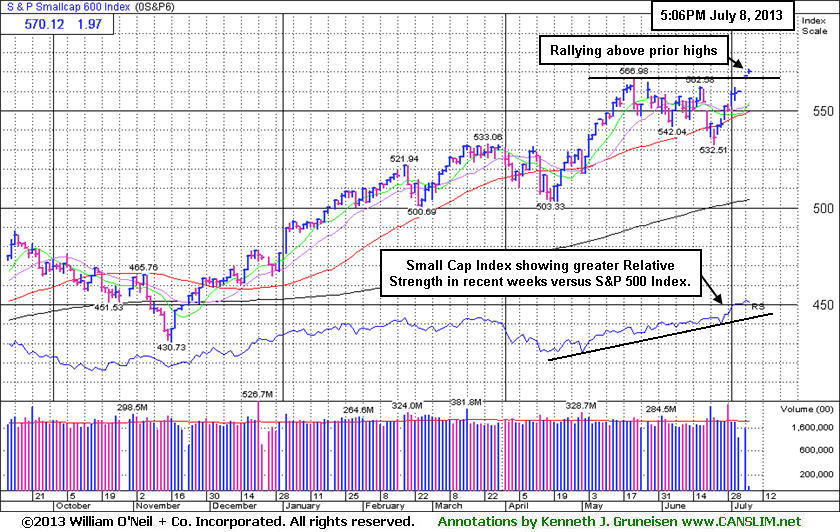
PICTURED: The S&P 600 Small Cap Index has again been first among the indices surging into new all-time high territory. It promptly repaired its 50-day moving average (DMA) line violation in recent weeks. Its Relative Strength line also has turned upward, a sign that small cap stocks have been outperforming the S&P 500 Index lately. This improvement is good news for followers of the fact-based investment system which focuses buying efforts mostly on small and medium sized companies with superior earnings growth rates.
|
 Kenneth J. Gruneisen started out as a licensed stockbroker in August 1987, a couple of months prior to the historic stock market crash that took the Dow Jones Industrial Average down -22.6% in a single day. He has published daily fact-based fundamental and technical analysis on high-ranked stocks online for two decades. Through FACTBASEDINVESTING.COM, Kenneth provides educational articles, news, market commentary, and other information regarding proven investment systems that work in good times and bad.
Comments contained in the body of this report are technical opinions only and are not necessarily those of Gruneisen Growth Corp. The material herein has been obtained from sources believed to be reliable and accurate, however, its accuracy and completeness cannot be guaranteed. Our firm, employees, and customers may effect transactions, including transactions contrary to any recommendation herein, or have positions in the securities mentioned herein or options with respect thereto. Any recommendation contained in this report may not be suitable for all investors and it is not to be deemed an offer or solicitation on our part with respect to the purchase or sale of any securities. |
|
 |
Retail, Financial, Healthcare, and Energy Groups Rose
Kenneth J. Gruneisen - Passed the CAN SLIM® Master's Exam
The Retail Index ($RLX +1.48%) was a standout gainer and financial shares were also a positive influence on the major averages on Monday as the Broker/Dealer Index ($XBD +0.34%) and the Bank Index ($BKX +0.55%) posted modest gains. The Healthcare Index ($HMO +0.80%) rose and gains in energy-related shares also gave the Integrated Oil Index ($XOI +0.75%) and the Oil Services Index ($OSX +0.91%) a boost. The Gold & Silver Index ($XAU -1.69%) lost ground. The Biotechnology Index ($BTK -0.42%) and the Networking Index ($NWX -0.30%) edged lower while the Internet Index ($IIX +0.43%) posted a small gain.
Charts courtesy www.stockcharts.com
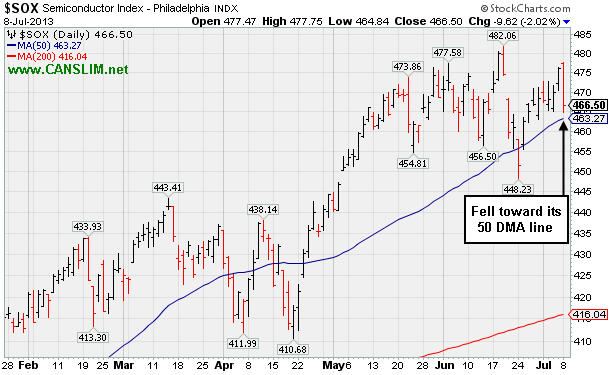
PICTURED: The Semiconductor Index ($SOX -2.02%) fell toward its 50-day moving (DMA) line.
| Oil Services |
$OSX |
263.35 |
+2.38 |
+0.91% |
+19.62% |
| Healthcare |
$HMO |
3,283.84 |
+26.06 |
+0.80% |
+30.61% |
| Integrated Oil |
$XOI |
1,350.87 |
+10.10 |
+0.75% |
+8.78% |
| Semiconductor |
$SOX |
466.50 |
-9.62 |
-2.02% |
+21.47% |
| Networking |
$NWX |
263.79 |
-0.80 |
-0.30% |
+16.44% |
| Internet |
$IIX |
385.30 |
+1.65 |
+0.43% |
+17.83% |
| Broker/Dealer |
$XBD |
131.18 |
+0.45 |
+0.34% |
+39.06% |
| Retail |
$RLX |
821.68 |
+11.98 |
+1.48% |
+25.82% |
| Gold & Silver |
$XAU |
84.98 |
-1.46 |
-1.69% |
-48.68% |
| Bank |
$BKX |
64.29 |
+0.35 |
+0.55% |
+25.37% |
| Biotech |
$BTK |
2,028.43 |
-8.52 |
-0.42% |
+31.12% |
|
|
|
 |
Finished Lower Following "Negative Reversal" After Challenging High
Kenneth J. Gruneisen - Passed the CAN SLIM® Master's Exam
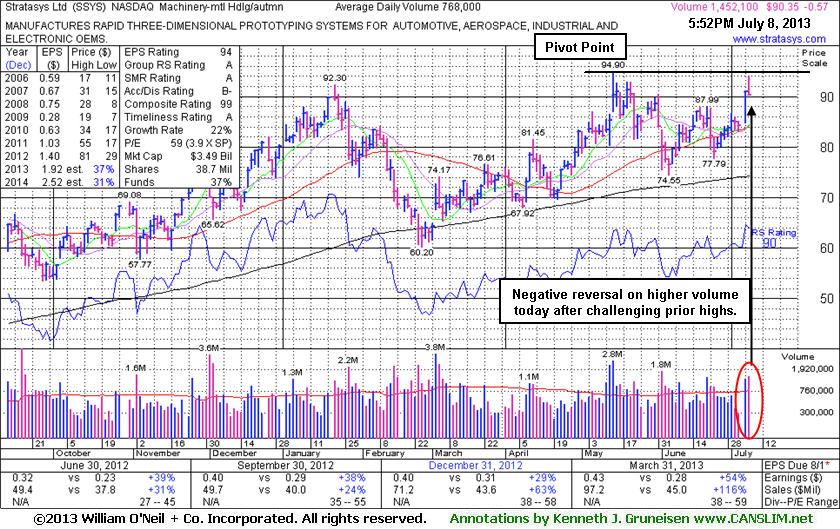
Stratasys Inc (SSYS -$0.57 or -0.63% to $90.35) was highlighted in yellow with a pivot point cited based on its 5/14/13 high plus 10 cents in the earlier mid-day report (read here). Volume-driven gains had it rallying toward multi-month resistance in the $92-94 area, and little resistance remains due to overhead supply. However, after challenging its prior high it ended near the session low with a loss on higher volume - action which is technically termed a "negative reversal". When poised for a best-ever close, and while the broader market showed mostly positive action, the weak finish was a clear sign that it was encountering distributional pressure. Disciplined investors will watch for a proper technical breakout and more reassuring from the broader market (M criteria) before considering new buying efforts.
Its strong quarterly earnings history above the +25% minimum guideline satisfies the C criteria. The 7/05/13 mid-day report noted - "Reported earnings +54% on +116% sales revenues for the Mar '13 quarter versus the year ago period. Downward turn in its FY '09 earnings was previously noted as a flaw with respect to the investment system's A criteria. Found support near its 200 DMA line during a deep consolidation earlier this year. Ownership by top-rated funds rose from 246 in Sep '12 to 277 in Jun '13, a reassuring sign concerning the I criteria. It is an interesting turn around story with a small supply of 36.7 million shares (S criteria) outstanding. Longtime members may recall that SSYS was long ago (2003) featured in reports."
|
|
|
Color Codes Explained :
Y - Better candidates highlighted by our
staff of experts.
G - Previously featured
in past reports as yellow but may no longer be buyable under the
guidelines.
***Last / Change / Volume data in this table is the closing quote data***
Symbol/Exchange
Company Name
Industry Group |
PRICE |
CHANGE
(%Change) |
Day High |
Volume
(% DAV)
(% 50 day avg vol) |
52 Wk Hi
% From Hi |
Featured
Date |
Price
Featured |
Pivot Featured |
|
Max Buy |
AMBA
-
NASDAQ
Ambarella Inc
ELECTRONICS - Semiconductor - Specialized
|
$16.98
|
-0.25
-1.42% |
$17.34
|
573,446
48.23% of 50 DAV
50 DAV is 1,189,100
|
$18.58
-8.61%
|
5/6/2013
|
$15.31
|
PP = $16.10
|
|
MB = $16.91
|
 Most Recent Note - 7/8/2013 2:03:36 PM
G - Quietly consolidating near its "max buy" level. Found support while recently consolidating above its 50 DMA line - important chart support where a violation would trigger a worrisome technical sell signal.
>>> The latest Featured Stock Update with an annotated graph appeared on 6/27/2013. Click here.
View all notes |
Alert me of new notes |
CANSLIM.net Company Profile |
SEC |
Zacks Reports |
StockTalk |
News |
Chart |
Request a new note
C
A N
S L
I M


|
EQM
-
NYSE
E Q T Midstream Partners
ENERGY - Oil and Gas Pipelines
|
$47.45
|
+0.27
0.57% |
$47.98
|
485,048
317.02% of 50 DAV
50 DAV is 153,000
|
$51.72
-8.26%
|
4/25/2013
|
$40.16
|
PP = $40.84
|
|
MB = $42.88
|
Most Recent Note - 7/8/2013 2:05:10 PM
G - Lingering just below its 50 DMA line after a recent streak of losses marked by above average volume. The prior low ($44.83 on 6/05/13) defines the next important support level.
>>> The latest Featured Stock Update with an annotated graph appeared on 7/1/2013. Click here.
View all notes |
Alert me of new notes |
CANSLIM.net Company Profile |
SEC |
Zacks Reports |
StockTalk |
News |
Chart |
Request a new note
C
A N
S L
I M
|
FLT
-
NYSE
Fleetcor Technologies
DIVERSIFIED SERVICES - Business/Management Services
|
$84.26
|
-0.08
-0.09% |
$85.31
|
542,616
60.25% of 50 DAV
50 DAV is 900,600
|
$89.75
-6.12%
|
5/29/2013
|
$86.02
|
PP = $85.66
|
|
MB = $89.94
|
Most Recent Note - 7/5/2013 6:35:06 PM
G- Rebounded to finish the week above its 50 DMA line with light volume behind its gains following distributional pressure.
>>> The latest Featured Stock Update with an annotated graph appeared on 6/28/2013. Click here.
View all notes |
Alert me of new notes |
CANSLIM.net Company Profile |
SEC |
Zacks Reports |
StockTalk |
News |
Chart |
Request a new note
C
A N
S L
I M
|
LOPE
-
NASDAQ
Grand Canyon Education
DIVERSIFIED SERVICES - Education and; Training Services
|
$34.51
|
+0.66
1.95% |
$34.61
|
360,270
85.05% of 50 DAV
50 DAV is 423,600
|
$35.17
-1.88%
|
6/19/2013
|
$31.47
|
PP = $34.17
|
|
MB = $35.88
|
Most Recent Note - 7/5/2013 6:36:54 PM
Y - Touched a new 52-week high but reversed into the red at the close. Subsequent volume driven gains above its pivot point may trigger a new technical buy signal. Its 50 DMA line and recent lows define support in the $30-31 area.
>>> The latest Featured Stock Update with an annotated graph appeared on 7/2/2013. Click here.
View all notes |
Alert me of new notes |
CANSLIM.net Company Profile |
SEC |
Zacks Reports |
StockTalk |
News |
Chart |
Request a new note
C
A N
S L
I M
|
PCLN
-
NASDAQ
Priceline.Com Inc
INTERNET - Internet Software and Services
|
$888.63
|
+33.47
3.91% |
$889.40
|
1,161,673
161.28% of 50 DAV
50 DAV is 720,300
|
$856.12
3.80%
|
7/8/2013
|
$878.28
|
PP = $847.43
|
|
MB = $889.80
|
Most Recent Note - 7/8/2013 1:15:42 PM
Y - Gapped up today for new 52-week and all-time highs. Color code is changed to yellow with pivot point cited based on its 5/21/13 high plus 10 cents. Wedged higher with recent gains lacking great volume conviction while rising from an orderly base formed after clearing its 2012 highs with a streak of volume-driven gains in May. Quarterly earnings increases remained above the +25% minimum guideline (C criteria) since dropped from the Featured Stocks list on 5/14/12.
>>> The latest Featured Stock Update with an annotated graph appeared on 5/14/2012. Click here.
View all notes |
Alert me of new notes |
CANSLIM.net Company Profile |
SEC |
Zacks Reports |
StockTalk |
News |
Chart |
Request a new note
C
A N
S L
I M
|
Symbol/Exchange
Company Name
Industry Group |
PRICE |
CHANGE
(%Change) |
Day High |
Volume
(% DAV)
(% 50 day avg vol) |
52 Wk Hi
% From Hi |
Featured
Date |
Price
Featured |
Pivot Featured |
|
Max Buy |
PRAA
-
NASDAQ
Portfolio Recovery Assoc
DIVERSIFIED SERVICES - Business/Management Services
|
$149.36
|
-9.57
-6.02% |
$152.75
|
271,610
313.64% of 50 DAV
50 DAV is 86,600
|
$163.87
-8.85%
|
5/1/2013
|
$130.77
|
PP = $127.88
|
|
MB = $134.27
|
Most Recent Note - 7/8/2013 2:01:26 PM
G - Gapped down today for a damaging volume-driven loss triggering a technical sell signal. Testing important support at its 50 DMA line. More damaging losses would raise greater concerns and trigger additional technical sell signals.
>>> The latest Featured Stock Update with an annotated graph appeared on 6/25/2013. Click here.
View all notes |
Alert me of new notes |
CANSLIM.net Company Profile |
SEC |
Zacks Reports |
StockTalk |
News |
Chart |
Request a new note
C
A N
S L
I M
|
PRLB
-
NYSE
Proto Labs Inc
MANUFACTURING - Small Tools and Accessories
|
$64.14
|
-1.35
-2.06% |
$65.92
|
259,054
52.42% of 50 DAV
50 DAV is 494,200
|
$67.40
-4.84%
|
6/17/2013
|
$59.37
|
PP = $59.94
|
|
MB = $62.94
|
Most Recent Note - 7/8/2013 2:08:25 PM
G- Still holding its ground stubbornly near its 52-week high with volume totals cooling following a "negative reversal" on 6/28/13 with heavy volume. Prior highs near $59 define important near-term support above its 50 DMA line.
>>> The latest Featured Stock Update with an annotated graph appeared on 6/26/2013. Click here.
View all notes |
Alert me of new notes |
CANSLIM.net Company Profile |
SEC |
Zacks Reports |
StockTalk |
News |
Chart |
Request a new note
C
A N
S L
I M
|
RRTS
-
NYSE
Roadrunner Trans Systems
TRANSPORTATION - Air Delivery and Freight Service
|
$28.36
|
-0.64
-2.21% |
$29.09
|
122,582
59.80% of 50 DAV
50 DAV is 205,000
|
$29.52
-3.93%
|
4/3/2013
|
$22.77
|
PP = $23.75
|
|
MB = $24.94
|
Most Recent Note - 7/5/2013 6:32:20 PM
G - Finished at the session high and 2 cents off its best-ever close with a gain on below average volume. Wedged higher without great volume conviction after finding support above its 50 DMA line. Perched within close striking distance of its 52-week high.
>>> The latest Featured Stock Update with an annotated graph appeared on 7/3/2013. Click here.
View all notes |
Alert me of new notes |
CANSLIM.net Company Profile |
SEC |
Zacks Reports |
StockTalk |
News |
Chart |
Request a new note
C
A N
S L
I M
|
SSYS
-
NASDAQ
Stratasys Ltd
COMPUTER HARDWARE - Computer Peripherals
|
$90.35
|
-0.57
-0.63% |
$94.00
|
1,452,122
189.08% of 50 DAV
50 DAV is 768,000
|
$94.90
-4.79%
|
7/8/2013
|
$91.44
|
PP = $95.00
|
|
MB = $99.75
|
Most Recent Note - 7/8/2013 6:18:12 PM
Y - Finished lower after a "negative reversal" on higher volume. Color code was changed to yellow with pivot point cited based on its 5/14/13 high plus 10 cents. Challenged multi-month resistance in the $92-94 area and little resistance remains due to overhead supply. Earnings history above the +25% minimum guideline satisfies the C criteria. The 7/05/13 mid-day report noted - "Reported earnings +54% on +116% sales revenues for the Mar '13 quarter versus the year ago period." See the latest FSU analysis for more details and a new annotated graph.
>>> The latest Featured Stock Update with an annotated graph appeared on 7/8/2013. Click here.
View all notes |
Alert me of new notes |
CANSLIM.net Company Profile |
SEC |
Zacks Reports |
StockTalk |
News |
Chart |
Request a new note
C
A N
S L
I M
|
VRX
-
NYSE
Valeant Pharmaceuticals
DRUGS - Drug Manufacturers - Other
|
$90.03
|
+1.26
1.42% |
$90.16
|
1,246,951
59.50% of 50 DAV
50 DAV is 2,095,800
|
$96.25
-6.46%
|
4/30/2013
|
$60.24
|
PP = $76.66
|
|
MB = $80.49
|
Most Recent Note - 7/5/2013 6:33:02 PM
G- Holding its ground since completing a new Public Offering on 6/18/13 following recent M&A news. Concerns were raised by its sub par Mar '13 earnings report. See the latest FSU analysis for more details and a new annotated graph.
>>> The latest Featured Stock Update with an annotated graph appeared on 7/5/2013. Click here.
View all notes |
Alert me of new notes |
CANSLIM.net Company Profile |
SEC |
Zacks Reports |
StockTalk |
News |
Chart |
Request a new note
C
A N
S L
I M
|
Symbol/Exchange
Company Name
Industry Group |
PRICE |
CHANGE
(%Change) |
Day High |
Volume
(% DAV)
(% 50 day avg vol) |
52 Wk Hi
% From Hi |
Featured
Date |
Price
Featured |
Pivot Featured |
|
Max Buy |
|
|
|
THESE ARE NOT BUY RECOMMENDATIONS!
Comments contained in the body of this report are technical
opinions only. The material herein has been obtained
from sources believed to be reliable and accurate, however,
its accuracy and completeness cannot be guaranteed.
This site is not an investment advisor, hence it does
not endorse or recommend any securities or other investments.
Any recommendation contained in this report may not
be suitable for all investors and it is not to be deemed
an offer or solicitation on our part with respect to
the purchase or sale of any securities. All trademarks,
service marks and trade names appearing in this report
are the property of their respective owners, and are
likewise used for identification purposes only.
This report is a service available
only to active Paid Premium Members.
You may opt-out of receiving report notifications
at any time. Questions or comments may be submitted
by writing to Premium Membership Services 665 S.E. 10 Street, Suite 201 Deerfield Beach, FL 33441-5634 or by calling 1-800-965-8307
or 954-785-1121.
|
|
|

