You are not logged in.
This means you
CAN ONLY VIEW reports that were published prior to Monday, April 14, 2025.
You
MUST UPGRADE YOUR MEMBERSHIP if you want to see any current reports.
AFTER MARKET UPDATE - TUESDAY, JULY 5TH, 2011
Previous After Market Report Next After Market Report >>>
|
|
|
|
DOW |
-12.90 |
12,569.87 |
-0.10% |
|
Volume |
906,954,730 |
+5% |
|
Volume |
1,525,007,900 |
-6% |
|
NASDAQ |
+9.74 |
2,825.77 |
+0.35% |
|
Advancers |
1,476 |
47% |
|
Advancers |
1,300 |
48% |
|
S&P 500 |
-1.79 |
1,337.88 |
-0.13% |
|
Decliners |
1,525 |
49% |
|
Decliners |
1,273 |
47% |
|
Russell 2000 |
+1.58 |
841.62 |
+0.19% |
|
52 Wk Highs |
173 |
|
|
52 Wk Highs |
149 |
|
|
S&P 600 |
+1.59 |
453.51 |
+0.35% |
|
52 Wk Lows |
7 |
|
|
52 Wk Lows |
27 |
|
|
 |
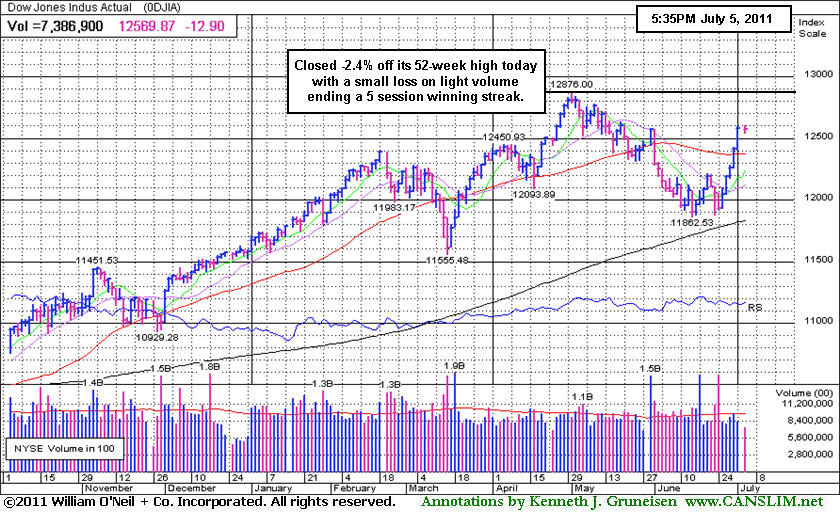
Major Averages Mixed While New Highs List Expands Again
Kenneth J. Gruneisen - Passed the CAN SLIM® Master's Exam
A warning from Moody's about Portugal's debt revived worries about Europe's debt crisis. The major averages finished mixed on Tuesday with post-holiday volume totals reported higher than the prior session on the NYSE and lower on the Nasdaq exchange. Broader action was also clearly mixed as declining issues narrowly outnumbered advancers on the NYSE while advancing issues narrowly led decliners on the Nasdaq exchange. New 52-week highs outnumbered new 52-week lows on both the Nasdaq exchange and the NYSE. New lows on the NYSE were in the single digits for a second consecutive session. There were 126 high-ranked companies from the CANSLIM.net Leaders List that made new 52-week highs and appeared on the CANSLIM.net BreakOuts Page, up from the total of 107 on the prior session. There were 11 gainers out of the 14 high-ranked leaders currently included on the Featured Stocks Page.
Energy stocks were a standout on merger news and as crude oil closed above $96. National Oilwell Varco Inc (NOV +2.22%) agreed to buy Ameron Int'l Corp (AMN +28.38%) for $772 million. Southern Union Co (SUG +4.21%) rose after Energy Transfer Equity, LP (ETE +0.69%) raised its offer for the pipeline company. Exxon Mobil Corp (XOM -0.5%) was down slightly on news the company slowed production at a Montana refinery after a leaking crude supply line was shut.
Netflix Inc (NFLX +8.07%) spiked higher, gaining the most in the S&P 500, after the online video service said it is expanding to Latin America. This well-known online movie services firm gapped up today, hitting new all-time highs. It is quickly getting very extended while rallying from an even riskier "late-stage" consolidation shorter than the minimum length for a sound new base pattern. Its 50-day moving average (DMA) line and prior highs acted as support. It has maintained high ranks and its earnings history still satisfies the C and A criteria. Choppy action has made it challenging to make a proper entry since NFLX was previously dropped from the Featured Stocks page on 3/03/11, yet it has made impressive progress.
The total number of high-ranked stocks hitting new 52-week highs and the totals cited for hitting the Breakouts Page rose over the past 8 trading sessions from 15, to 28, 34, 67, 71, 74, 107, and finally, 126 on Tuesday's post-July 4th session. Friday's commentary noted - "The expansion in leadership (new highs) and technical improvement in the major averages has not met the definition of a convincing follow-through day, but regular readers may have noticed that the overall action in sum suggests that the market's rally effort has gathered more upward momentum."
The official assessment of the market direction (M criteria) has changed from being defined as, "In a correction, requiring a follow- through day as confirmation of a new rally", back to a, "Market uptrend", while still absent a follow-through day. This is referenced in Paul Whitfield's latest column in the 7/05/11 paper which stated - "The preponderance of the evidence is that the market is in an uptrend, not a correction." The column also said it is possible the 6/21/11 gain of +1.3% in the S&P 500 Index was a follow-through day confirming the market's rally attempt. Regular readers may note that the CANSLIM.net Market Commentary on Tuesday June 21 (read here) stated - "The S&P 500 Index posted a +1.34% gain, which might be considered a questionable gain borderline with the minimum gain expected for a follow-through day. The S&P 400 Mid-Cap Index and S&P 600 Small-Cap Index both posted +1.9% gains on Day 3 and Day 4 of their rally attempts, respectively. The strength in small stocks and expansion in the new 52-week highs list were encouraging signs for growth-oriented investors who might cautiously look to accumulate ideal buy candidates."
Our July 2011 issue of CANSLIM.net News is due to be released soon with a comprehensive summary of current market conditions that further clarifies matters concerning the M criteria! The Q2 2011 CANSLIM.net Webcast is available "ON DEMAND" now to UPGRADED MEMBERS ONLY - (CLICK HERE).
PICTURED: The Dow Jones Industrial Average's winning streak was halted at five as it closed -2.4% off its 52-week high.
|
 Kenneth J. Gruneisen started out as a licensed stockbroker in August 1987, a couple of months prior to the historic stock market crash that took the Dow Jones Industrial Average down -22.6% in a single day. He has published daily fact-based fundamental and technical analysis on high-ranked stocks online for two decades. Through FACTBASEDINVESTING.COM, Kenneth provides educational articles, news, market commentary, and other information regarding proven investment systems that work in good times and bad.
Comments contained in the body of this report are technical opinions only and are not necessarily those of Gruneisen Growth Corp. The material herein has been obtained from sources believed to be reliable and accurate, however, its accuracy and completeness cannot be guaranteed. Our firm, employees, and customers may effect transactions, including transactions contrary to any recommendation herein, or have positions in the securities mentioned herein or options with respect thereto. Any recommendation contained in this report may not be suitable for all investors and it is not to be deemed an offer or solicitation on our part with respect to the purchase or sale of any securities. |
|
 |
Financial Groups Sink; XAU Rallies Above 50-Day Average
Kenneth J. Gruneisen - Passed the CAN SLIM® Master's Exam
The Bank Index ($BKX -1.16%) and Broker/Dealer Index ($XBD -1.05%) sank early in the session and failed to recover. The Gold & Silver Index ($XAU +2.50%) was a standout gainer and energy related shares' positive bias lifted the Oil Services Index ($OSX +1.00%) and the Integrated Oil Index ($XOI +0.29%).
Modest gains from the Retail Index ($RLX +0.53%) and the Internet Index ($IIX +0.77%) were a positive influence, meanwhile the Semiconductor Index ($SOX -0.99%) created a drag on the tech sector. The Networking Index ($NWX -0.12%), Biotechnology Index ($BTK +0.08%), and the Healthcare Index ($HMO +0.07%) were little changed.
Charts courtesy www.stockcharts.com
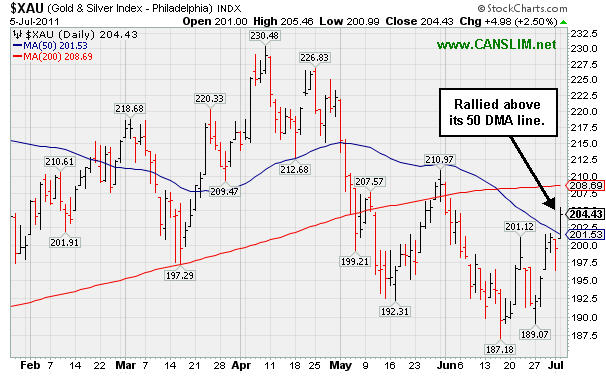
PICTURED: The Gold & Silver Index ($XAU +2.50%) rallied above its 50-day moving average (DMA) today.
| Oil Services |
$OSX |
272.38 |
+2.71 |
+1.00% |
+11.12% |
| Healthcare |
$HMO |
2,502.68 |
+1.86 |
+0.07% |
+47.91% |
| Integrated Oil |
$XOI |
1,322.14 |
+3.76 |
+0.29% |
+8.98% |
| Semiconductor |
$SOX |
414.94 |
-4.17 |
-0.99% |
+0.76% |
| Networking |
$NWX |
306.44 |
-0.38 |
-0.12% |
+9.22% |
| Internet |
$IIX |
318.39 |
+2.42 |
+0.77% |
+3.46% |
| Broker/Dealer |
$XBD |
108.33 |
-1.15 |
-1.05% |
-10.85% |
| Retail |
$RLX |
543.01 |
+2.87 |
+0.53% |
+6.81% |
| Gold & Silver |
$XAU |
204.43 |
+4.98 |
+2.50% |
-9.78% |
| Bank |
$BKX |
48.65 |
-0.57 |
-1.16% |
-6.82% |
| Biotech |
$BTK |
1,478.30 |
+1.16 |
+0.08% |
+13.92% |
|
|
|
 |
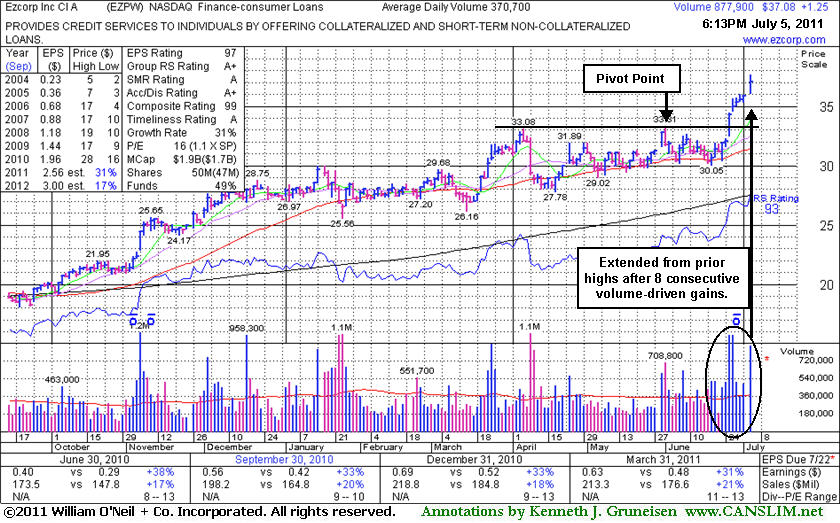
Streak Of Gains Leaves Firm Extended From Prior Highs
Kenneth J. Gruneisen - Passed the CAN SLIM® Master's Exam
Ezcorp Inc (EZPW +$1.25 or +3.49% to $37.08) spiked higher with today's 8th consecutive volume-driven gain, getting very extended from prior highs in the $33 area that define support to watch on pullbacks. Following its last appearance in this FSU section on 6/13/11 with an annotated graph under the headline, "Choppy New Base Formed But Patience Remains Paramount", it eventually broke out with help from an analyst upgrade as its considerable gap up gain on heavy volume on 6/27/11 triggered a technical buy signal. Earnings have remained above the +25% guideline in its quarterly comparisons versus the year ago period, satisfying the C criteria. It also has a strong annual earnings history (A criteria). The number of top-rated funds owning its shares rose from 369 in Mar '10 to 419 in Mar '11, an encouraging sign with respect to the I criteria.
While disciplined investors waited for better confirmation of the current rally with a follow-through day of meaningful gains from at least one of the major averages, the M criteria of the investment system, EZPW's color code was changed to green after its streak of gains led to it getting extended from the previously noted base. Patient investors may watch for secondary buy points or additional bases to form and be noted rather than chasing a stock that is extended from the ideal buying range up more than +5% above prior highs.
|
|
|
Color Codes Explained :
Y - Better candidates highlighted by our
staff of experts.
G - Previously featured
in past reports as yellow but may no longer be buyable under the
guidelines.
***Last / Change / Volume data in this table is the closing quote data***
Symbol/Exchange
Company Name
Industry Group |
PRICE |
CHANGE
(%Change) |
Day High |
Volume
(% DAV)
(% 50 day avg vol) |
52 Wk Hi
% From Hi |
Featured
Date |
Price
Featured |
Pivot Featured |
|
Max Buy |
CACC
-
NASDAQ
Credit Acceptance Corp
FINANCIAL SERVICES - Credit Services
|
$85.25
|
-0.81
-0.94% |
$85.98
|
57,870
140.12% of 50 DAV
50 DAV is 41,300
|
$86.87
-1.86%
|
6/2/2011
|
$76.10
|
PP = $82.39
|
|
MB = $86.51
|
 Most Recent Note - 7/5/2011 12:13:29 PM
Y - Pulling back below its "max buy" level with today's loss on higher volume, and its color code is changed to yellow. Approximately 40% of successful breakouts pull back and test support at old highs after a breakout before continuing higher. CACC triggered a technical buy signal with its rally above its pivot point backed by +52% above average volume on 6/30/11. Prior highs in the $80-82 area define initial support to watch on pullbacks.
>>> The latest Featured Stock Update with an annotated graph appeared on 6/27/2011. Click here.
View all notes |
Alert me of new notes |
CANSLIM.net Company Profile |
SEC |
Zacks Reports |
StockTalk |
News |
Chart |
Request a new note
C
A N
S L
I M


|
CMG
-
NYSE
Chipotle Mexican Grill
LEISURE - Restaurants
|
$321.45
|
+5.73
1.81% |
$322.63
|
881,900
88.14% of 50 DAV
50 DAV is 1,000,600
|
$316.85
1.45%
|
4/1/2011
|
$274.00
|
PP = $275.10
|
|
MB = $288.86
|
Most Recent Note - 7/1/2011 3:50:57 PM
G - Hitting another new all-time high with below average volume behind its gain today. Getting extended from prior highs that define initial chart support to watch.
>>> The latest Featured Stock Update with an annotated graph appeared on 6/15/2011. Click here.
View all notes |
Alert me of new notes |
CANSLIM.net Company Profile |
SEC |
Zacks Reports |
StockTalk |
News |
Chart |
Request a new note
C
A N
S L
I M
|
EZPW
-
NASDAQ
Ezcorp Inc Cl A
SPECIALTY RETAIL - Specialty Retail, Other
|
$37.08
|
+1.25
3.49% |
$37.65
|
878,003
236.85% of 50 DAV
50 DAV is 370,700
|
$35.98
3.06%
|
6/13/2011
|
$31.18
|
PP = $33.41
|
|
MB = $35.08
|
Most Recent Note - 7/5/2011 12:19:05 PM
G - Spiking higher with today's 8th consecutive volume-driven gain. Getting very extended from prior highs in the $33 area that define support to watch on pullbacks.
>>> The latest Featured Stock Update with an annotated graph appeared on 7/5/2011. Click here.
View all notes |
Alert me of new notes |
CANSLIM.net Company Profile |
SEC |
Zacks Reports |
StockTalk |
News |
Chart |
Request a new note
C
A N
S L
I M
|
FCFS
-
NASDAQ
First Cash Financial Svs
SPECIALTY RETAIL - Specialty Retail, Other
|
$43.83
|
+1.41
3.32% |
$44.33
|
299,352
162.43% of 50 DAV
50 DAV is 184,300
|
$42.75
2.53%
|
5/31/2011
|
$42.00
|
PP = $40.23
|
|
MB = $42.24
|
Most Recent Note - 7/5/2011 2:27:36 PM
Y - Up today for a 3rd consecutive gain, hitting a new all-time high and getting extended from its prior base. Color code is changed to green. Prior highs in the $40-42 area define initial support areas to watch.
>>> The latest Featured Stock Update with an annotated graph appeared on 6/22/2011. Click here.
View all notes |
Alert me of new notes |
CANSLIM.net Company Profile |
SEC |
Zacks Reports |
StockTalk |
News |
Chart |
Request a new note
C
A N
S L
I M
|
FOSL
-
NASDAQ
Fossil Inc
CONSUMER DURABLES - Recreational Goods, Other
|
$122.63
|
+0.67
0.55% |
$123.47
|
825,633
112.07% of 50 DAV
50 DAV is 736,700
|
$122.00
0.52%
|
2/1/2011
|
$73.30
|
PP = $74.44
|
|
MB = $78.16
|
Most Recent Note - 7/1/2011 3:45:43 PM
G - Hitting yet another new all-time high with below average volume behind its gain today , getting more extended from prior highs in the $107 area that now define initial support to watch above its 50 DMA line.
>>> The latest Featured Stock Update with an annotated graph appeared on 6/28/2011. Click here.
View all notes |
Alert me of new notes |
CANSLIM.net Company Profile |
SEC |
Zacks Reports |
StockTalk |
News |
Chart |
Request a new note
C
A N
S L
I M
|
Symbol/Exchange
Company Name
Industry Group |
PRICE |
CHANGE
(%Change) |
Day High |
Volume
(% DAV)
(% 50 day avg vol) |
52 Wk Hi
% From Hi |
Featured
Date |
Price
Featured |
Pivot Featured |
|
Max Buy |
HS
-
NYSE
Healthspring Inc
HEALTH SERVICES - Health Care Plans
|
$48.26
|
+1.13
2.40% |
$48.95
|
1,044,369
117.17% of 50 DAV
50 DAV is 891,300
|
$47.78
1.00%
|
6/16/2011
|
$42.44
|
PP = $45.21
|
|
MB = $47.47
|
Most Recent Note - 7/5/2011 2:09:56 PM
G - Up again today with volume running at an above average pace while rising above its "max buy" level. Color code is changed to green after getting extended from its latest base. Prior resistance near $45 defines support after its recent streak of gains with above average volume to new all-time highs.
>>> The latest Featured Stock Update with an annotated graph appeared on 6/16/2011. Click here.
View all notes |
Alert me of new notes |
CANSLIM.net Company Profile |
SEC |
Zacks Reports |
StockTalk |
News |
Chart |
Request a new note
C
A N
S L
I M
|
INFA
-
NASDAQ
Informatica Corp
COMPUTER SOFTWARE and SERVICES - Business Software and Services
|
$60.86
|
+1.46
2.46% |
$61.12
|
1,286,938
103.16% of 50 DAV
50 DAV is 1,247,500
|
$59.98
1.47%
|
7/1/2011
|
$59.36
|
PP = $60.08
|
|
MB = $63.08
|
Most Recent Note - 7/5/2011 2:29:13 PM
Y - Quiet gain today has it inching above its new pivot point recently cited based on its prior high plus 10 cents after a 5-week flat base during which it found support near its 50 DMA line. This high-ranked Computer Software - Database firm faces no overhead supply. A volume-driven breakout may trigger a new (or add-on) technical buy signal.
>>> The latest Featured Stock Update with an annotated graph appeared on 6/17/2011. Click here.
View all notes |
Alert me of new notes |
CANSLIM.net Company Profile |
SEC |
Zacks Reports |
StockTalk |
News |
Chart |
Request a new note
C
A N
S L
I M
|
LULU
-
NASDAQ
Lululemon Athletica
MANUFACTURING - Textile Manufacturing
|
$118.75
|
+3.13
2.71% |
$119.88
|
2,322,831
116.10% of 50 DAV
50 DAV is 2,000,800
|
$115.93
2.43%
|
6/21/2011
|
$102.95
|
PP = $101.14
|
|
MB = $106.20
|
Most Recent Note - 7/5/2011 2:30:22 PM
G - Again hitting new 52-week and all-time highs today, getting more extended from its latest base. Disciplined investors avoid chasing extended stocks. Prior highs define important chart support to watch.
>>> The latest Featured Stock Update with an annotated graph appeared on 6/21/2011. Click here.
View all notes |
Alert me of new notes |
CANSLIM.net Company Profile |
SEC |
Zacks Reports |
StockTalk |
News |
Chart |
Request a new note
C
A N
S L
I M
|
MWIV
-
NASDAQ
M W I Veterinary Supply
HEALTH SERVICES - Medical Instruments and; Supplies
|
$82.07
|
+0.21
0.26% |
$82.73
|
51,504
65.53% of 50 DAV
50 DAV is 78,600
|
$86.99
-5.66%
|
11/4/2010
|
$61.79
|
PP = $59.60
|
|
MB = $62.58
|
Most Recent Note - 7/1/2011 4:09:19 PM
G - Gains in recent weeks lacked volume conviction, yet today it quietly climbed above its 50 DMA line which has been acting as a stubborn resistance level.
>>> The latest Featured Stock Update with an annotated graph appeared on 6/30/2011. Click here.
View all notes |
Alert me of new notes |
CANSLIM.net Company Profile |
SEC |
Zacks Reports |
StockTalk |
News |
Chart |
Request a new note
C
A N
S L
I M
|
OPNT
-
NASDAQ
Opnet Technologies
INTERNET - Internet Software and Services
|
$40.12
|
-0.45
-1.11% |
$41.03
|
316,315
267.61% of 50 DAV
50 DAV is 118,200
|
$42.51
-5.62%
|
6/28/2011
|
$40.87
|
PP = $42.61
|
|
MB = $44.74
|
Most Recent Note - 7/5/2011 2:33:16 PM
Y - Down today with above average volume, an indication of distributional pressure following its latest rally attempt challenging its 52-week high after building an orderly base. Color code was changed to yellow and a new pivot point cited based on its 52-week high plus ten cents. Disciplined investors watch for a confirming technical buy signal before taking action. Recent lows near $36 define important near-term chart support.
>>> The latest Featured Stock Update with an annotated graph appeared on 7/1/2011. Click here.
View all notes |
Alert me of new notes |
CANSLIM.net Company Profile |
SEC |
Zacks Reports |
StockTalk |
News |
Chart |
Request a new note
C
A N
S L
I M
|
Symbol/Exchange
Company Name
Industry Group |
PRICE |
CHANGE
(%Change) |
Day High |
Volume
(% DAV)
(% 50 day avg vol) |
52 Wk Hi
% From Hi |
Featured
Date |
Price
Featured |
Pivot Featured |
|
Max Buy |
OTEX
-
NASDAQ
Open Text Corp
INTERNET - Internet Software and Services
|
$65.05
|
+0.40
0.62% |
$66.04
|
288,730
92.36% of 50 DAV
50 DAV is 312,600
|
$67.08
-3.03%
|
6/1/2011
|
$65.86
|
PP = $67.18
|
|
MB = $70.54
|
Most Recent Note - 7/1/2011 4:13:30 PM
Y - Lighter volume was behind today's 5th consecutive gain to a close -3.5% off its 52-week high. Color code was changed to yellow based on recent resilience, yet volume-driven gains above the previously cited pivot point are necessary to trigger a technical buy signal.
>>> The latest Featured Stock Update with an annotated graph appeared on 6/24/2011. Click here.
View all notes |
Alert me of new notes |
CANSLIM.net Company Profile |
SEC |
Zacks Reports |
StockTalk |
News |
Chart |
Request a new note
C
A N
S L
I M
|
SWI
-
NYSE
Solarwinds Inc
COMPUTER SOFTWARE and SERVICES - Application Software
|
$25.62
|
-0.30
-1.16% |
$26.03
|
695,542
83.20% of 50 DAV
50 DAV is 836,000
|
$26.68
-3.97%
|
6/7/2011
|
$24.22
|
PP = $25.05
|
|
MB = $26.30
|
Most Recent Note - 7/1/2011 4:15:09 PM
Y - Quietly holding its ground between its pivot point and "max buy" level. Prior resistance in the $24-25 area defines support. A subsequent close under its old high close ($24.77 on 4/25/11) would raise concerns by negating its recent breakout.
>>> The latest Featured Stock Update with an annotated graph appeared on 6/29/2011. Click here.
View all notes |
Alert me of new notes |
CANSLIM.net Company Profile |
SEC |
Zacks Reports |
StockTalk |
News |
Chart |
Request a new note
C
A N
S L
I M
|
ULTA
-
NASDAQ
Ulta Salon Cosm & Frag
SPECIALTY RETAIL - Specialty Retail, Other
|
$66.82
|
+1.64
2.52% |
$67.03
|
686,704
82.06% of 50 DAV
50 DAV is 836,800
|
$65.35
2.25%
|
1/6/2011
|
$36.12
|
PP = $37.34
|
|
MB = $39.21
|
Most Recent Note - 7/1/2011 4:16:20 PM
G - Hit yet another new all-time high with a gain on light volume today, getting more extended from any sound base pattern. It may produce more climactic gains, but disciplined investors avoid chasing extended stocks.
>>> The latest Featured Stock Update with an annotated graph appeared on 6/20/2011. Click here.
View all notes |
Alert me of new notes |
CANSLIM.net Company Profile |
SEC |
Zacks Reports |
StockTalk |
News |
Chart |
Request a new note
C
A N
S L
I M
|
ZAGG
-
NASDAQ
Zagg Inc
SPECIALTY RETAIL - Specialty Retail, Other
|
$13.73
|
+0.88
6.85% |
$14.35
|
3,778,203
204.88% of 50 DAV
50 DAV is 1,844,100
|
$15.85
-13.38%
|
6/1/2011
|
$10.92
|
PP = $10.59
|
|
MB = $11.12
|
Most Recent Note - 7/5/2011 1:59:35 PM
G - Spiking higher today after enduring recent distributional pressure. It is extended from a sound base, and prior highs define initial support to watch on pullbacks.
>>> The latest Featured Stock Update with an annotated graph appeared on 6/23/2011. Click here.
View all notes |
Alert me of new notes |
CANSLIM.net Company Profile |
SEC |
Zacks Reports |
StockTalk |
News |
Chart |
Request a new note
C
A N
S L
I M
|
|
|
|
THESE ARE NOT BUY RECOMMENDATIONS!
Comments contained in the body of this report are technical
opinions only. The material herein has been obtained
from sources believed to be reliable and accurate, however,
its accuracy and completeness cannot be guaranteed.
This site is not an investment advisor, hence it does
not endorse or recommend any securities or other investments.
Any recommendation contained in this report may not
be suitable for all investors and it is not to be deemed
an offer or solicitation on our part with respect to
the purchase or sale of any securities. All trademarks,
service marks and trade names appearing in this report
are the property of their respective owners, and are
likewise used for identification purposes only.
This report is a service available
only to active Paid Premium Members.
You may opt-out of receiving report notifications
at any time. Questions or comments may be submitted
by writing to Premium Membership Services 665 S.E. 10 Street, Suite 201 Deerfield Beach, FL 33441-5634 or by calling 1-800-965-8307
or 954-785-1121.
|
|
|

