You are not logged in.
This means you
CAN ONLY VIEW reports that were published prior to Monday, April 14, 2025.
You
MUST UPGRADE YOUR MEMBERSHIP if you want to see any current reports.
AFTER MARKET UPDATE - WEDNESDAY, JULY 3RD, 2013
Previous After Market Report Next After Market Report >>>
|
|
|
|
DOW |
+56.14 |
14,988.55 |
+0.38% |
|
Volume |
482,054,000 |
-33% |
|
Volume |
896,483,250 |
-45% |
|
NASDAQ |
+10.27 |
3,443.67 |
+0.30% |
|
Advancers |
1,161 |
38% |
|
Advancers |
1,350 |
54% |
|
S&P 500 |
+1.33 |
1,615.41 |
+0.08% |
|
Decliners |
1,806 |
59% |
|
Decliners |
1,027 |
41% |
|
Russell 2000 |
+1.59 |
991.13 |
+0.16% |
|
52 Wk Highs |
52 |
|
|
52 Wk Highs |
102 |
|
|
S&P 600 |
+0.77 |
559.93 |
+0.14% |
|
52 Wk Lows |
38 |
|
|
52 Wk Lows |
16 |
|
|
 |
Major Averages End Shortened Session With Quiet Gains
Kenneth J. Gruneisen - Passed the CAN SLIM® Master's Exam
The major averages ended higher on Wednesday's shortened session with volume totals clearly lighter than the prior session totals reported on the NYSE and on the Nasdaq exchange. Breadth was mixed as decliners outnumbered advancers by a 3-2 margin on the NYSE while advancers led decliners by a 7-5 margin on the Nasdaq exchange. There were 25 high-ranked companies from the CANSLIM.net Leaders List made new 52-week highs and appeared on the CANSLIM.net BreakOuts Page, about half of the prior session total of 48 stocks. The list of stocks hitting new 52-week highs clearly contracted, yet new highs still outnumbered new 52-week lows on both the NYSE and the Nasdaq exchange. There were gains for 4 of the 8 high-ranked companies currently included on the Featured Stocks Page.
The major averages managed to shake off their early losses as a batch of better-than-expected employment reports helped investors overlook soft economic data out of China and growing political unrest in Egypt. Looking at the data, ADP's private payrolls expanded more than expected in June, while weekly jobless claims came lower than anticipated.
Six of the 10 sectors on the S&P were higher, led by gains in tech stocks as International Business Machines Inc (IBM +0.91%) edged higher and Apple Inc (AAPL +0.55%) added to its recent winning streak. Energy stocks were active in the session as crude oil prices rose +1.5% to $101.06 per barrel.
Turning to fixed income markets, Treasuries were modestly lower along the curve. The benchmark 10-year note was down 7/32 to yield 2.50% and the 30-year bond gave up 5/16 of a point to yield 3.50%.
Friday's session marks Day 8 of the current rally attempt. Disciplined investors will note that the market (M criteria) did not produce a follow-through day within the most ideal period between days 4-7 of a new rally attempt. In spite of the recent rebound there is still a need for caution until a new rally is confirmed by a proper follow-through day (FTD) of meaningful gains (+1.4% or greater) from at least one of the major averages on higher volume coupled with an expansion in leadership (stocks hitting new 52-week highs). The rally attempt remains valid unless the Day 1 lows are violated which would clearly indicate deterioration and signal that the correction is worsening.
Upcoming CANSLIM.net reports will observe and explain any noteworthy shifts in the market direction (M criteria) while especially highlighting the characteristics and important details in the bold portion of this commentary. Regular readers are aware via prior reports since early June repeatedly reminding members - "Be protective of any gains, and limit losses! Be especially watchful for any individual issues flashing technical sell signals. It is vitally important to your success with the fact-based investment system to reduce exposure and preserve cash during market downdrafts."
Individual leaders best matching the winning models of the fact-based investment system are on the Featured Stocks Page - with our Certified experts' latest notes and links to additional resources including detailed analysis with annotated graphs. The Premium Member Homepage - includes "dynamic archives" to all prior pay reports published. Watch for an announcement via email concerning the next WEBCAST.
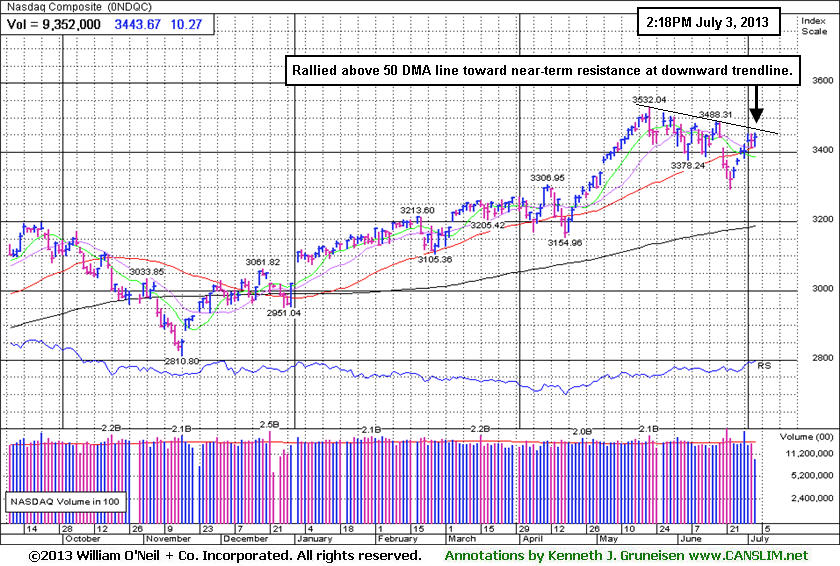
PICTURED: The Nasdaq Composite Index rebounded above its 50-day moving average (DMA) line. It is perched within close striking distance of near-term resistance at a downward trendline. Meanwhile, the S&P 500 Index and Dow Jones Industrial Average have encountered resistance at their respective 50 DMA lines. Subsequent gains above that important technical hurdle by the Dow and S&P would help the overall market outlook improve.
|
 Kenneth J. Gruneisen started out as a licensed stockbroker in August 1987, a couple of months prior to the historic stock market crash that took the Dow Jones Industrial Average down -22.6% in a single day. He has published daily fact-based fundamental and technical analysis on high-ranked stocks online for two decades. Through FACTBASEDINVESTING.COM, Kenneth provides educational articles, news, market commentary, and other information regarding proven investment systems that work in good times and bad.
Comments contained in the body of this report are technical opinions only and are not necessarily those of Gruneisen Growth Corp. The material herein has been obtained from sources believed to be reliable and accurate, however, its accuracy and completeness cannot be guaranteed. Our firm, employees, and customers may effect transactions, including transactions contrary to any recommendation herein, or have positions in the securities mentioned herein or options with respect thereto. Any recommendation contained in this report may not be suitable for all investors and it is not to be deemed an offer or solicitation on our part with respect to the purchase or sale of any securities. |
|
 |
Tech Sector Traded Higher
Kenneth J. Gruneisen - Passed the CAN SLIM® Master's Exam
The tech sector had a positive bias as the Internet Index ($IIX +0.30%), Semiconductor Index ($SOX +0.35%), and the Networking Index ($NWX +0.54%) each posted a modest gain. The Gold & Silver Index ($XAU +1.86%) was a standout gainer. The Retail Index ($RLX +0.12%) and the Broker/Dealer Index ($XBD +0.20%) edged higher while the Bank Index ($BKX +0.02%) finished flat. Energy-related shares were quiet as the Oil Services Index ($OSX -0.26%) edged lower and the Integrated Oil Index ($XOI +0.06%) finished flat. The Healthcare Index ($HMO -0.19%) and Biotechnology Index ($BTK -0.05%) also finished the session with minimal losses.
Charts courtesy www.stockcharts.com
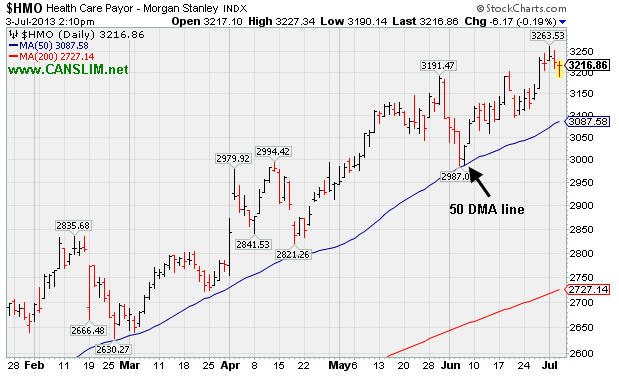
PICTURED: The Healthcare Index ($HMO -0.19%) is perched near its 2013 high. It found support near its 50-day moving average (DMA) line on prior pullbacks throughout its ongoing ascent.
| Oil Services |
$OSX |
256.33 |
-0.66 |
-0.26% |
+16.43% |
| Healthcare |
$HMO |
3,216.86 |
-6.17 |
-0.19% |
+27.95% |
| Integrated Oil |
$XOI |
1,331.60 |
+0.76 |
+0.06% |
+7.23% |
| Semiconductor |
$SOX |
469.80 |
+1.62 |
+0.35% |
+22.32% |
| Networking |
$NWX |
260.76 |
+1.39 |
+0.54% |
+15.10% |
| Internet |
$IIX |
379.35 |
+1.12 |
+0.30% |
+16.01% |
| Broker/Dealer |
$XBD |
127.68 |
+0.26 |
+0.20% |
+35.35% |
| Retail |
$RLX |
801.26 |
+0.95 |
+0.12% |
+22.69% |
| Gold & Silver |
$XAU |
89.29 |
+1.63 |
+1.86% |
-46.08% |
| Bank |
$BKX |
62.31 |
+0.01 |
+0.02% |
+21.51% |
| Biotech |
$BTK |
2,000.40 |
-0.98 |
-0.05% |
+29.31% |
|
|
|
 |
Found Recent Support at 50-Day Moving Average Line
Kenneth J. Gruneisen - Passed the CAN SLIM® Master's Exam
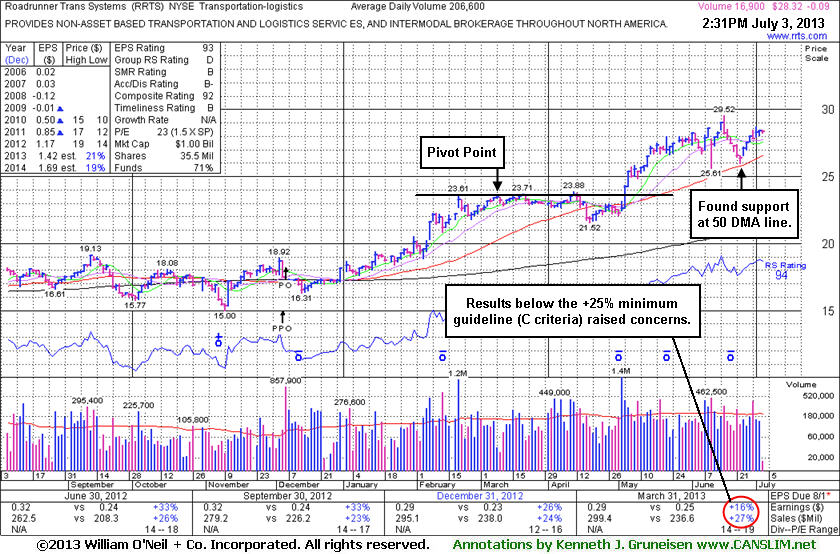
Roadrunner Transportation Systems Inc (RRTS $-0.09 or -0.32% to 28.32) has been wedging higher without great volume conviction after finding support above its 50-day moving average (DMA) line. It is perched within close striking distance of its 52-week high. Fundamental concerns were raised by its sub par earnings increase in the Mar '13 quarter.
Its last appearance in this FSU section was on 6/20/13 with an annotated graph under the headline, "Following Negative Reversal With Losses on Lighter Volume". The prior highs in the $23 area define support to watch below its 50-day moving average (DMA) line. It showed resilience near its 50-day moving average (DMA) line, then started the month of May with a spike higher with heavy volume behind big gains. Because the fact-based system suggests watching for technical sell signals before exiting profitable position it was previously noted - "Investors who may own it might choose to give the stock the benefit of the doubt unless it flashes any weak action, however a disciplined investor following the fact-based system would usually avoid making new buying efforts in any companies failing to solidly satisfy the fundamental guidelines."
Fundamental concerns recently were raised after it reported earnings +16% on +27% sales revenues for the quarter ended March 31, 2013 versus the year ago period, below the +25% minimum earnings guideline (C criteria). It is more ideal when a company shows accelerating sales revenues and earnings increases. Often a bullish price/volume chart anticipates strong earnings results in the coming quarter, while bearish price/volume chart patterns frequently predict weaker earnings in the future. Time will say if it can resume growth above the +25% rate. Consensus estimates are currently calling for +21% and +19% earnings growth in FY '13 and '14, respectively. Earnings growth is crucial to the fact-based investment approach and obviously weighs into the newspaper's Earnings Per Share (EPS) rating system. Its current EPS rank of 93 is still well above the 80+ guideline for buy candidates.
The number of top-rated funds owning its shares rose from 168 in Jun '12 to 206 in Mar '13, a reassuring sign concerning the I criteria. The company completed a new Public Offering on 12/06/12 and, technically, it broke out above previously stubborn resistance in $19 area with volume-driven gains in January.
|
|
|
Color Codes Explained :
Y - Better candidates highlighted by our
staff of experts.
G - Previously featured
in past reports as yellow but may no longer be buyable under the
guidelines.
***Last / Change / Volume data in this table is the closing quote data***
Symbol/Exchange
Company Name
Industry Group |
PRICE |
CHANGE
(%Change) |
Day High |
Volume
(% DAV)
(% 50 day avg vol) |
52 Wk Hi
% From Hi |
Featured
Date |
Price
Featured |
Pivot Featured |
|
Max Buy |
AMBA
-
NASDAQ
Ambarella Inc
ELECTRONICS - Semiconductor - Specialized
|
$17.07
|
+0.18
1.07% |
$17.10
|
249,504
21.04% of 50 DAV
50 DAV is 1,185,700
|
$18.58
-8.13%
|
5/6/2013
|
$15.31
|
PP = $16.10
|
|
MB = $16.91
|
Most Recent Note - 7/1/2013 1:08:51 PM
G - Color code is changed to green after rising back above its "max buy" level. Found support while recently consolidating above its 50 DMA line - important chart support where a violation would trigger a worrisome technical sell signal.
>>> The latest Featured Stock Update with an annotated graph appeared on 6/27/2013. Click here.
View all notes |
Alert me of new notes |
CANSLIM.net Company Profile |
SEC |
Zacks Reports |
StockTalk |
News |
Chart |
Request a new note
C
A N
S L
I M


|
EQM
-
NYSE
E Q T Midstream Partners
ENERGY - Oil and Gas Pipelines
|
$46.75
|
-0.11
-0.23% |
$47.00
|
93,871
62.13% of 50 DAV
50 DAV is 151,100
|
$51.72
-9.61%
|
4/25/2013
|
$40.16
|
PP = $40.84
|
|
MB = $42.88
|
Most Recent Note - 7/1/2013 12:30:11 PM
G - Testing support at its 50 DMA line ($47.11) with today's 2nd consecutive loss backed by above average volume. Below that short-term average, the prior low ($44.83 on 6/05/13) defines the next important support level.
>>> The latest Featured Stock Update with an annotated graph appeared on 7/1/2013. Click here.
View all notes |
Alert me of new notes |
CANSLIM.net Company Profile |
SEC |
Zacks Reports |
StockTalk |
News |
Chart |
Request a new note
C
A N
S L
I M
|
FLT
-
NYSE
Fleetcor Technologies
DIVERSIFIED SERVICES - Business/Management Services
|
$83.24
|
+0.83
1.01% |
$83.32
|
396,825
43.40% of 50 DAV
50 DAV is 914,300
|
$89.75
-7.25%
|
5/29/2013
|
$86.02
|
PP = $85.66
|
|
MB = $89.94
|
Most Recent Note - 6/28/2013 6:25:18 PM
G- Endured distributional pressure and slumped to close the week below its 50 DMA line raising concerns and its color code is changed to green. See the latest FSU analysis for more details and a new annotated graph.
>>> The latest Featured Stock Update with an annotated graph appeared on 6/28/2013. Click here.
View all notes |
Alert me of new notes |
CANSLIM.net Company Profile |
SEC |
Zacks Reports |
StockTalk |
News |
Chart |
Request a new note
C
A N
S L
I M
|
LOPE
-
NASDAQ
Grand Canyon Education
DIVERSIFIED SERVICES - Education and; Training Services
|
$34.04
|
+0.54
1.61% |
$34.48
|
305,839
72.59% of 50 DAV
50 DAV is 421,300
|
$34.07
-0.09%
|
6/19/2013
|
$31.47
|
PP = $34.17
|
|
MB = $35.88
|
Most Recent Note - 7/2/2013 6:57:14 PM
Y - Finished at a best-ever close today with a gain backed by average volume. Its 50 DMA line and recent lows define support in the $30-31 area. Subsequent volume driven gains above its pivot point may trigger a new technical buy signal. See the latest FSU analysis for more details and a new annotated graph.
>>> The latest Featured Stock Update with an annotated graph appeared on 7/2/2013. Click here.
View all notes |
Alert me of new notes |
CANSLIM.net Company Profile |
SEC |
Zacks Reports |
StockTalk |
News |
Chart |
Request a new note
C
A N
S L
I M
|
PRAA
-
NASDAQ
Portfolio Recovery Assoc
DIVERSIFIED SERVICES - Business/Management Services
|
$156.19
|
-2.49
-1.57% |
$159.03
|
44,503
51.81% of 50 DAV
50 DAV is 85,900
|
$163.87
-4.69%
|
5/1/2013
|
$130.77
|
PP = $127.88
|
|
MB = $134.27
|
Most Recent Note - 6/28/2013 6:41:46 PM
G - Endured a loss on heavy volume. Extended from any sound base, it rallied with no resistance due to overhead supply. Its 50 DMA line defines important near-term chart support.
>>> The latest Featured Stock Update with an annotated graph appeared on 6/25/2013. Click here.
View all notes |
Alert me of new notes |
CANSLIM.net Company Profile |
SEC |
Zacks Reports |
StockTalk |
News |
Chart |
Request a new note
C
A N
S L
I M
|
Symbol/Exchange
Company Name
Industry Group |
PRICE |
CHANGE
(%Change) |
Day High |
Volume
(% DAV)
(% 50 day avg vol) |
52 Wk Hi
% From Hi |
Featured
Date |
Price
Featured |
Pivot Featured |
|
Max Buy |
PRLB
-
NYSE
Proto Labs Inc
MANUFACTURING - Small Tools and Accessories
|
$64.98
|
+1.41
2.22% |
$65.44
|
205,619
40.68% of 50 DAV
50 DAV is 505,500
|
$67.40
-3.59%
|
6/17/2013
|
$59.37
|
PP = $59.94
|
|
MB = $62.94
|
Most Recent Note - 7/2/2013 7:00:27 PM
G- Encountered more distributional pressure today after a "negative reversal" on 6/28/13 at its 52-week high. Prior highs near $59 define important near-term support.
>>> The latest Featured Stock Update with an annotated graph appeared on 6/26/2013. Click here.
View all notes |
Alert me of new notes |
CANSLIM.net Company Profile |
SEC |
Zacks Reports |
StockTalk |
News |
Chart |
Request a new note
C
A N
S L
I M
|
RRTS
-
NYSE
Roadrunner Trans Systems
TRANSPORTATION - Air Delivery and Freight Service
|
$28.32
|
-0.09
-0.32% |
$28.47
|
17,653
8.54% of 50 DAV
50 DAV is 206,600
|
$29.52
-4.07%
|
4/3/2013
|
$22.77
|
PP = $23.75
|
|
MB = $24.94
|
 Most Recent Note - 7/3/2013 2:49:34 PM
G - Wedged higher without great volume conviction after finding support above its 50 DMA line. Perched within close striking distance of its 52-week high. See latest FSU analysis for more details and a new annotated graph.
>>> The latest Featured Stock Update with an annotated graph appeared on 7/3/2013. Click here.
View all notes |
Alert me of new notes |
CANSLIM.net Company Profile |
SEC |
Zacks Reports |
StockTalk |
News |
Chart |
Request a new note
C
A N
S L
I M
|
VRX
-
NYSE
Valeant Pharmaceuticals
DRUGS - Drug Manufacturers - Other
|
$89.50
|
-0.49
-0.54% |
$90.34
|
848,047
40.37% of 50 DAV
50 DAV is 2,100,600
|
$96.25
-7.01%
|
4/30/2013
|
$60.24
|
PP = $76.66
|
|
MB = $80.49
|
Most Recent Note - 7/1/2013 1:04:18 PM
G- Small gap up today. Held its ground since completing a new Public Offering on 6/18/13 following recent M&A news. Concerns were raised by its sub par Mar '13 earnings report.
>>> The latest Featured Stock Update with an annotated graph appeared on 6/24/2013. Click here.
View all notes |
Alert me of new notes |
CANSLIM.net Company Profile |
SEC |
Zacks Reports |
StockTalk |
News |
Chart |
Request a new note
C
A N
S L
I M
|
|
|
|
THESE ARE NOT BUY RECOMMENDATIONS!
Comments contained in the body of this report are technical
opinions only. The material herein has been obtained
from sources believed to be reliable and accurate, however,
its accuracy and completeness cannot be guaranteed.
This site is not an investment advisor, hence it does
not endorse or recommend any securities or other investments.
Any recommendation contained in this report may not
be suitable for all investors and it is not to be deemed
an offer or solicitation on our part with respect to
the purchase or sale of any securities. All trademarks,
service marks and trade names appearing in this report
are the property of their respective owners, and are
likewise used for identification purposes only.
This report is a service available
only to active Paid Premium Members.
You may opt-out of receiving report notifications
at any time. Questions or comments may be submitted
by writing to Premium Membership Services 665 S.E. 10 Street, Suite 201 Deerfield Beach, FL 33441-5634 or by calling 1-800-965-8307
or 954-785-1121.
|
|
|

