You are not logged in.
This means you
CAN ONLY VIEW reports that were published prior to Monday, April 14, 2025.
You
MUST UPGRADE YOUR MEMBERSHIP if you want to see any current reports.
AFTER MARKET UPDATE - FRIDAY, JULY 2ND, 2010
Previous After Market Report Next After Market Report >>>
|
|
|
|
DOW |
-46.05 |
9,686.48 |
-0.47% |
|
Volume |
1,103,444,150 |
-31% |
|
Volume |
1,606,196,720 |
-38% |
|
NASDAQ |
-9.57 |
2,091.79 |
-0.46% |
|
Advancers |
1,212 |
38% |
|
Advancers |
960 |
35% |
|
S&P 500 |
-4.79 |
1,022.58 |
-0.47% |
|
Decliners |
1,832 |
58% |
|
Decliners |
1,696 |
61% |
|
Russell 2000 |
-5.79 |
598.97 |
-0.96% |
|
52 Wk Highs |
37 |
|
|
52 Wk Highs |
7 |
|
|
S&P 600 |
-2.62 |
322.90 |
-0.80% |
|
52 Wk Lows |
82 |
|
|
52 Wk Lows |
135 |
|
|
 |
Major Averages Continue Falling While New Leadership Remains Elusive
Adam Sarhan, Contributing Writer,
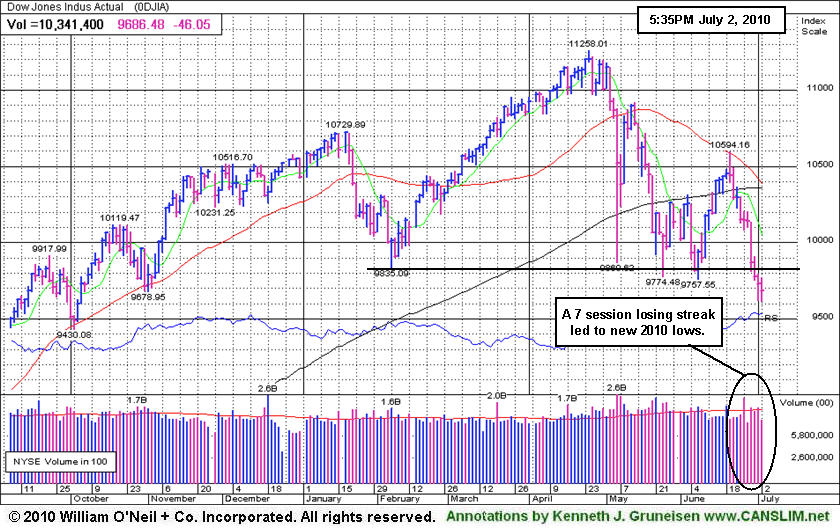
It was a dismal week on Wall Street as the latest rally failed, the major averages violated support, and fell to fresh 2010 lows. As expected Friday's pre-holiday volume totals were reported lower on the NYSE and the Nasdaq exchange compared to Thursday's levels. Decliners led advancers by approximately a 3-to-2 ratio on the NYSE and on the Nasdaq exchange. There were only 5 high-ranked companies from the CANSLIM.net Leaders List that made a new 52-week high and appeared on the CANSLIM.net BreakOuts Page, a total only 1 better than the prior session. Meanwhile, new 52-week lows substantially outnumbered new 52-week highs on the NYSE and the Nasdaq exchange. As leadership evaporated in recent sessions, in this commentary it was repeatedly noted - "Without a healthy crop of leaders hitting new highs it is hard for the major averages to sustain a rally."
Stocks closed lower on Monday after a relatively benign G-20 meeting. The G-20 met in Toronto and pledged to cut deficits in order to help stabilize the global economy. Elsewhere, US consumer spending and personal income rose. On Tuesday, stocks fell hard across the globe after concern spread that China's robust economy was slowing. China's leading economic indicators fell and Citigroup (C) said China’s exports will face "strong headwinds" in the second half of the year due to stricter measures from Beijing and the ongoing European debt crisis. US stocks continued to fall after US consumer confidence tanked in June. The Conference Board’s index of consumer confidence fell to 52.9 from May's revised reading of 62.7. The dismal labor market was cited as a primary cause for the ongoing malaise. Elsewhere, the S&P/Case-Shiller index of home prices rose +3.8% from April 2009 which was the largest year-over-year gain since September 2006.
The second quarter ended on Wednesday sending the Nasdaq Composite and the benchmark S&P 500 Index both fell -12% while the Dow Jones Industrial Average and the small cap Russell 2000 Index skidded -10%, marking their worst quarters since Q4 2008. It was the tech-heavy Nasdaq's worst second quarter since 2002. In addition, it was worrisome to see the S&P 500 close below 1,040 which has served as formidable support for most of the year.
On Thursday, stocks slid after a series of tepid economic reports were released. US jobless claims unexpectedly rose to 472,000 last week, pending home sales tanked at twice the rate Wall Street had expected and US manufacturing echoed the ominous news from Europe and Asia. This was the latest round of tepid economic data which suggests the economic recovery is less than stellar. Stocks ended lower on Friday after the Labor Department said US employers slashed -125,000 last month and the jobless rate fell to 9.5%, factory orders also fell last month.
The market is in a correction, which emphasizes the importance of raising cash and adopting a strong defensive stance until a new follow-through day emerges. For the past several weeks, this column has steadily noted the importance of remaining very selective and disciplined because all of the major averages are still trading below their downward sloping 50-day moving average (DMA) lines. Their 50 DMA line may continue to act as stubborn resistance. It was also recently noted that the NYSE Composite Index's 50 DMA line already sliced below the 200 DMA line, an event known by market technicians as a "death cross" which usually has bearish implications. On Friday, the benchmark S&P 500 Index's 50 DMA line officially undercut its longer term 200 DMA line which is not a healthy sign. Trade accordingly.
Q2 Webcast Rewind: The Q2 2010 CANSLIM.net Webcast aired at 8PM on Wednesday, June 30, 2010. A link to the webcast has been added near the top on the Premium Membership Homepage which will allow all who have UPGRADED with a currently active premium (paid) membership to view the webcast ON DEMAND at any time. To UPGRADE now for access to the webcast and all premium reports CLICK HERE.
PICTURED: The Dow Jones Industrial Average's 7 session losing streak led to new 2010 lows. All three major averages have tallied 9 losses in the past 10 sessions.
|
|
|
 |
Internet Index Now Testing 2010 Low
Kenneth J. Gruneisen - Passed the CAN SLIM® Master's Exam
The Healthcare Index ($HMO +0.34%) and Biotechnology Index ($BTK +0.59%) posted small gains while influential groups weighing negatively on the major averages on Friday included the Retail Index ($RLX -1.07%) and financial shares as the Bank Index ($BKX -1.58%) and Broker/Dealer Index ($XBD -0.27%) ended lower. The Internet Index ($IIX -0.69%) and Semiconductor Index ($SOX -0.45%) finished modestly and the Networking Index ($NWX -0.11%) also ended with a small loss. Commodity-linked groups were quiet as the Gold & Silver Index ($XAU -0.07%), Integrated Oil Index ($XOI -0.04%), and Oil Services Index ($OSX +0.28%) ended very little changed.
Charts courtesy www.stockcharts.com
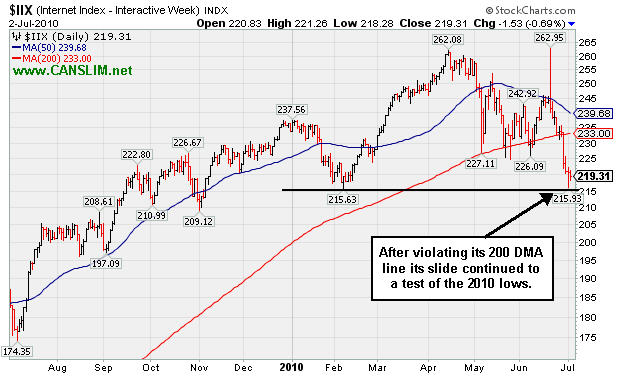
PICTURED: The Internet Index ($IIX -0.69%) violated its 200-day moving average (DMA) line and continued its slide down to a test of the 2010 lows.
| Oil Services |
$OSX |
165.48 |
+0.46 |
+0.28% |
-15.10% |
| Healthcare |
$HMO |
1,371.99 |
+4.68 |
+0.34% |
-6.85% |
| Integrated Oil |
$XOI |
879.38 |
-0.33 |
-0.04% |
-17.68% |
| Semiconductor |
$SOX |
331.60 |
-1.51 |
-0.45% |
-7.87% |
| Networking |
$NWX |
215.12 |
-0.25 |
-0.11% |
-6.90% |
| Internet |
$IIX |
219.31 |
-1.53 |
-0.69% |
-6.22% |
| Broker/Dealer |
$XBD |
95.78 |
-0.26 |
-0.27% |
-16.75% |
| Retail |
$RLX |
385.78 |
-4.19 |
-1.07% |
-6.16% |
| Gold & Silver |
$XAU |
169.76 |
-0.12 |
-0.07% |
+0.90% |
| Bank |
$BKX |
44.97 |
-0.72 |
-1.58% |
+5.29% |
| Biotech |
$BTK |
1,006.72 |
+5.91 |
+0.59% |
+6.86% |
|
|
|
 |
Relative Strength Waned During Slump Near 200 Day Moving Average
Kenneth J. Gruneisen - Passed the CAN SLIM® Master's Exam
Often, when a leading stock is setting up to breakout of a solid base, it is highlighted in CANSLIM.net's Mid-Day Breakouts Report. The most relevant factors are noted in the report which allows prudent CANSLIM oriented investors to place the issue in their watch list. After doing any necessary backup research, the investor is prepared to act if and when the stock triggers a technical buy signal (breaks above its pivot point on more than +50% average turnover). In the event the stock fails to trigger a technical buy signal and its price declines then it will simply be removed from the watch list.
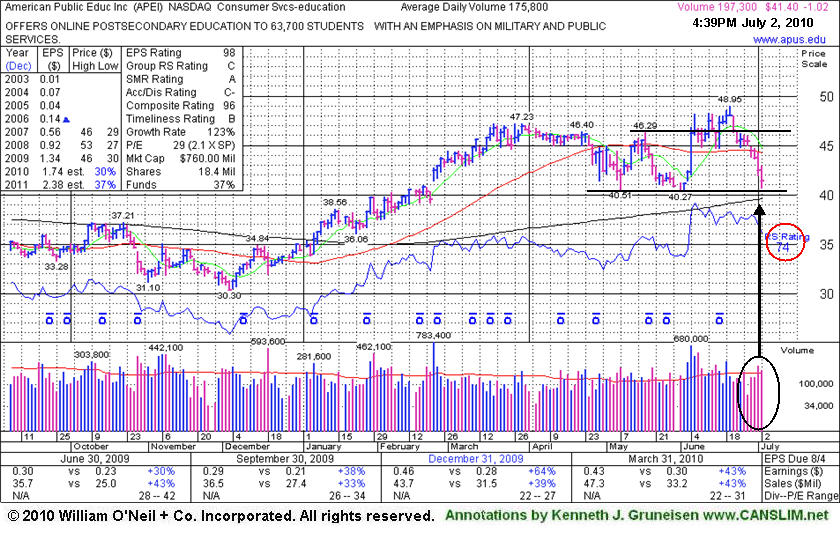
American Public Education Inc. (APEI -$1.02 or -1.81% to $41.40) suffered its 6th consecutive loss and slumped toward the next important support level near its 200-day moving average (DMA) line and prior chart lows in the $40 area. Its Relative Strength rank has slumped under the investment system's 80+ guideline to a 74 (see red circle), raising concerns. Its color code was changed to green as it slumped under its 50 DMA line this week amid broad market (M criteria) weakness. It made limited progress after its 6/07/10 gain and close above its pivot point with above average volume triggered a technical buy signal. Since its appearance in the 6/07/10 mid-day report with an annotated graph (read here), for-profit educators recently stalled as proposed regulatory changes have been feared to have a negative impact. Additional technical deterioration may trigger more worrisome sell signals and prompt its removal from the Featured Stocks list.
|
|
|
Color Codes Explained :
Y - Better candidates highlighted by our
staff of experts.
G - Previously featured
in past reports as yellow but may no longer be buyable under the
guidelines.
***Last / Change / Volume data in this table is the closing quote data***
Symbol/Exchange
Company Name
Industry Group |
PRICE |
CHANGE
(%Change) |
Day High |
Volume
(% DAV)
(% 50 day avg vol) |
52 Wk Hi
% From Hi |
Featured
Date |
Price
Featured |
Pivot Featured |
|
Max Buy |
AAPL
-
NASDAQ
Apple Inc
COMPUTER HARDWARE - Personal Computers
|
$246.94
|
-1.54
-0.62% |
$250.93
|
24,779,381
85.96% of 50 DAV
50 DAV is 28,826,600
|
$279.01
-11.49%
|
6/17/2010
|
$270.95
|
PP = $272.56
|
|
MB = $286.19
|
 Most Recent Note - 7/2/2010 3:48:37 PM
G - Traded near prior chart lows in the $242 area late this week after violating its 50 DMA line and triggering a technical sell signal. It was featured in the 6/17/10 mid-day report (read here).
>>> The latest Featured Stock Update with an annotated graph appeared on 6/17/2010. Click here.
View all notes |
Alert me of new notes |
CANSLIM.net Company Profile |
SEC |
Zacks Reports |
StockTalk |
News |
Chart |
Request a new note
C
A N
S L
I M


|
ABV
-
NYSE
Comp De Bebidas Adr
FOOD and BEVERAGE - Beverages - Brewers
|
$102.86
|
+1.69
1.67% |
$103.62
|
678,765
97.05% of 50 DAV
50 DAV is 699,400
|
$109.33
-5.92%
|
6/29/2010
|
$104.74
|
PP = $109.33
|
|
MB = $114.80
|
Most Recent Note - 7/2/2010 3:52:17 PM
Y - Brazil-based beverage firm found support near its 50 DMA line this week. Color code was changed to yellow again based on its resilience. A new FTD is needed before any buying efforts may be justifiable under the investment system's guidelines. It was featured in yellow in the 6/29/10 mid-day report (read here) with a note while - "perched near all-time highs after building an orderly base pattern and finding impressive support near its 200 DMA line in recent months. It has a great annual earnings (A criteria) history and its recent quarterly earnings and sales revenues increases have shown acceleration. A gain above its pivot point with heavy volume still needed to confirm a proper new technical buy signal."
>>> The latest Featured Stock Update with an annotated graph appeared on 6/29/2010. Click here.
View all notes |
Alert me of new notes |
CANSLIM.net Company Profile |
SEC |
Zacks Reports |
StockTalk |
News |
Chart |
Request a new note
C
A N
S L
I M
|
APEI
-
NASDAQ
American Public Educ Inc
DIVERSIFIED SERVICES - Education and Training Services
|
$41.40
|
-1.02
-2.40% |
$42.88
|
200,710
115.48% of 50 DAV
50 DAV is 173,800
|
$48.95
-15.42%
|
6/7/2010
|
$46.60
|
PP = $46.29
|
|
MB = $48.60
|
Most Recent Note - 7/2/2010 5:01:34 PM
G - Sank near its 200 DMA line and prior lows with its 6th consecutive loss.
>>> The latest Featured Stock Update with an annotated graph appeared on 7/2/2010. Click here.
View all notes |
Alert me of new notes |
CANSLIM.net Company Profile |
SEC |
Zacks Reports |
StockTalk |
News |
Chart |
Request a new note
C
A N
S L
I M
|
BIDU
-
NASDAQ
Baidu Inc Ads
INTERNET - Internet Information Providers
|
$67.55
|
-1.00
-1.46% |
$69.41
|
6,291,859
41.91% of 50 DAV
50 DAV is 15,011,600
|
$82.29
-17.91%
|
1/13/2010
|
$43.13
|
PP = $42.68
|
|
MB = $44.81
|
Most Recent Note - 7/2/2010 3:56:55 PM
G - Holding its ground near prior chart lows in the $66 area that define important chart support. It would need to rebound above its 50 DMA line for its outlook to improve.
>>> The latest Featured Stock Update with an annotated graph appeared on 6/21/2010. Click here.
View all notes |
Alert me of new notes |
CANSLIM.net Company Profile |
SEC |
Zacks Reports |
StockTalk |
News |
Chart |
Request a new note
C
A N
S L
I M
|
BRLI
-
NASDAQ
Bio Reference Labs Inc
HEALTH SERVICES - Medical Laboratories and Researc
|
$20.86
|
+0.00
0.00% |
$21.07
|
141,912
72.81% of 50 DAV
50 DAV is 194,900
|
$24.67
-15.46%
|
6/15/2010
|
$23.57
|
PP = $24.77
|
|
MB = $26.01
|
Most Recent Note - 7/2/2010 4:01:35 PM
G - Consolidating near its 200 DMA line after heavy distribution on the prior session. Based on weak action it will be dropped from the Featured Stocks list tonight.
>>> The latest Featured Stock Update with an annotated graph appeared on 6/15/2010. Click here.
View all notes |
Alert me of new notes |
CANSLIM.net Company Profile |
SEC |
Zacks Reports |
StockTalk |
News |
Chart |
Request a new note
C
A N
S L
I M
|
Symbol/Exchange
Company Name
Industry Group |
PRICE |
CHANGE
(%Change) |
Day High |
Volume
(% DAV)
(% 50 day avg vol) |
52 Wk Hi
% From Hi |
Featured
Date |
Price
Featured |
Pivot Featured |
|
Max Buy |
CISG
-
NASDAQ
Cninsure Inc Ads
INSURANCE - Insurance Brokers
|
$26.16
|
+0.32
1.24% |
$26.36
|
200,326
65.02% of 50 DAV
50 DAV is 308,100
|
$28.62
-8.60%
|
6/16/2010
|
$27.20
|
PP = $27.75
|
|
MB = $29.14
|
Most Recent Note - 7/2/2010 4:05:18 PM
G - Holding its ground near its 50 DMA line and ended -8.6% off its 52-week high. Featured in the 6/16/10 mid-day report (read here).
>>> The latest Featured Stock Update with an annotated graph appeared on 6/18/2010. Click here.
View all notes |
Alert me of new notes |
CANSLIM.net Company Profile |
SEC |
Zacks Reports |
StockTalk |
News |
Chart |
Request a new note
C
A N
S L
I M
|
CRM
-
NYSE
Salesforce.Com Inc
INTERNET - Internet Software and Services
|
$87.11
|
+0.04
0.05% |
$88.95
|
2,455,194
88.07% of 50 DAV
50 DAV is 2,787,700
|
$97.94
-11.06%
|
6/2/2010
|
$88.44
|
PP = $89.60
|
|
MB = $94.08
|
Most Recent Note - 7/2/2010 4:13:43 PM
G - Consolidating just under its 50 DMA line after recent weakness. An upward trendline connecting its February - May lows now defines an important support level.
>>> The latest Featured Stock Update with an annotated graph appeared on 6/22/2010. Click here.
View all notes |
Alert me of new notes |
CANSLIM.net Company Profile |
SEC |
Zacks Reports |
StockTalk |
News |
Chart |
Request a new note
C
A N
S L
I M
|
DECK
-
NASDAQ
Deckers Outdoor Corp
CONSUMER NON-DURABLES - Textile - Apparel Footwear
|
$141.80
|
-0.09
-0.06% |
$142.69
|
348,300
64.16% of 50 DAV
50 DAV is 542,900
|
$168.52
-15.86%
|
6/11/2010
|
$157.34
|
PP = $158.57
|
|
MB = $166.50
|
Most Recent Note - 7/2/2010 4:15:39 PM
G - Down today on below average volume for its 5th consecutive loss, slumping further below its 50 DMA line. Weak market (M criteria) action may be expected to drag 3 out of 4 stocks lower, meanwhile, caution is advised until another new confirmed rally begins.
>>> The latest Featured Stock Update with an annotated graph appeared on 7/1/2010. Click here.
View all notes |
Alert me of new notes |
CANSLIM.net Company Profile |
SEC |
Zacks Reports |
StockTalk |
News |
Chart |
Request a new note
C
A N
S L
I M
|
FFIV
-
NASDAQ
F 5 Networks Inc
INTERNET - Internet Software and Services
|
$68.65
|
-0.95
-1.36% |
$69.98
|
1,221,774
71.17% of 50 DAV
50 DAV is 1,716,600
|
$77.10
-10.96%
|
6/16/2010
|
$74.50
|
PP = $74.10
|
|
MB = $77.81
|
Most Recent Note - 7/2/2010 4:17:23 PM
G - Consolidating near its 50 DMA line this week. A prompt rebound above its pivot point would be an encouraging sign to watch for, meanwhile the path of least resistance may lead it lower.
>>> The latest Featured Stock Update with an annotated graph appeared on 6/16/2010. Click here.
View all notes |
Alert me of new notes |
CANSLIM.net Company Profile |
SEC |
Zacks Reports |
StockTalk |
News |
Chart |
Request a new note
C
A N
S L
I M
|
MELI
-
NASDAQ
Mercadolibre Inc
INTERNET - Internet Software and; Services
|
$52.13
|
-0.47
-0.89% |
$53.13
|
575,669
65.41% of 50 DAV
50 DAV is 880,100
|
$62.14
-16.11%
|
5/13/2010
|
$54.21
|
PP = $55.85
|
|
MB = $58.64
|
Most Recent Note - 7/2/2010 4:32:54 PM
G - Loss today led to a close below its 50 DMA line as it fell -10% for the week. A prompt rebound above its short-term average would be an encouraging sign.
>>> The latest Featured Stock Update with an annotated graph appeared on 6/30/2010. Click here.
View all notes |
Alert me of new notes |
CANSLIM.net Company Profile |
SEC |
Zacks Reports |
StockTalk |
News |
Chart |
Request a new note
C
A N
S L
I M
|
Symbol/Exchange
Company Name
Industry Group |
PRICE |
CHANGE
(%Change) |
Day High |
Volume
(% DAV)
(% 50 day avg vol) |
52 Wk Hi
% From Hi |
Featured
Date |
Price
Featured |
Pivot Featured |
|
Max Buy |
NEM
-
NYSE
Newmont Mining Corp
METALS and MINING - Gold
|
$58.76
|
-0.23
-0.39% |
$59.76
|
6,293,402
64.32% of 50 DAV
50 DAV is 9,784,600
|
$62.62
-6.16%
|
6/22/2010
|
$59.60
|
PP = $59.67
|
|
MB = $62.65
|
Most Recent Note - 7/2/2010 4:43:16 PM
Y - Enduring distributional pressure this week as it slumped from its 52-week high back toward prior chart highs amid a mostly negative market (M criteria) environment. Featured in a 6/22/10 Stock Bulletin with annotated graph (read here).
>>> The latest Featured Stock Update with an annotated graph appeared on 6/22/2010. Click here.
View all notes |
Alert me of new notes |
CANSLIM.net Company Profile |
SEC |
Zacks Reports |
StockTalk |
News |
Chart |
Request a new note
C
A N
S L
I M
|
ROVI
-
NASDAQ
Rovi Corp
COMPUTER SOFTWARE andamp; SERVICES - Security Software andamp; Services
|
$37.74
|
-0.14
-0.37% |
$38.15
|
543,749
39.23% of 50 DAV
50 DAV is 1,386,100
|
$40.06
-5.79%
|
6/3/2010
|
$38.70
|
PP = $40.16
|
|
MB = $42.17
|
Most Recent Note - 7/2/2010 4:52:49 PM
Y - Quietly consolidating near its 50 DMA line only -5.8% off its 52-week high. Color code was changed to yellow again, while disciplined investors will await a new FTD and a convincing gain above its pivot point with heavy volume to trigger a new buy signal. Prior lows near $35 area define support above its 200 DMA line.
>>> The latest Featured Stock Update with an annotated graph appeared on 6/28/2010. Click here.
View all notes |
Alert me of new notes |
CANSLIM.net Company Profile |
SEC |
Zacks Reports |
StockTalk |
News |
Chart |
Request a new note
C
A N
S L
I M
|
SUMR
-
NASDAQ
Summer Infant Inc
CONSUMER NON-DURABLES - Personal Products
|
$6.82
|
+0.33
5.08% |
$6.86
|
70,209
66.42% of 50 DAV
50 DAV is 105,700
|
$8.42
-19.00%
|
5/4/2010
|
$6.85
|
PP = $7.09
|
|
MB = $7.44
|
Most Recent Note - 7/2/2010 4:54:37 PM
G - Gain today on light volume. Recent chart lows in the $6.25 area define important support to watch. Gains back above its 50 DMA line and above recent chart highs near $7.40 would be an encouraging technical improvement.
>>> The latest Featured Stock Update with an annotated graph appeared on 6/24/2010. Click here.
View all notes |
Alert me of new notes |
CANSLIM.net Company Profile |
SEC |
Zacks Reports |
StockTalk |
News |
Chart |
Request a new note
C
A N
S L
I M
|
THOR
-
NASDAQ
Thoratec Corp
HEALTH SERVICES - Medical Instruments and Supplies
|
$43.20
|
+0.92
2.18% |
$43.71
|
634,185
53.66% of 50 DAV
50 DAV is 1,181,900
|
$47.93
-9.87%
|
6/3/2010
|
$44.38
|
PP = $45.35
|
|
MB = $47.62
|
Most Recent Note - 7/2/2010 4:56:41 PM
G - Today's gain on lighter volume helped it rally up from its a 50 DMA line, an important support level. Color code was changed to green as weakness raised concerns.
>>> The latest Featured Stock Update with an annotated graph appeared on 6/23/2010. Click here.
View all notes |
Alert me of new notes |
CANSLIM.net Company Profile |
SEC |
Zacks Reports |
StockTalk |
News |
Chart |
Request a new note
C
A N
S L
I M
|
ULTA
-
NASDAQ
Ulta Salon Cosm & Frag
SPECIALTY RETAIL - Specialty Retail, Other
|
$23.08
|
+0.08
0.35% |
$23.31
|
488,797
73.43% of 50 DAV
50 DAV is 665,700
|
$26.75
-13.72%
|
5/28/2010
|
$25.58
|
PP = $25.86
|
|
MB = $27.15
|
Most Recent Note - 7/2/2010 4:58:30 PM
G - Today's gain on light volume helped it halt a 3 session losing streak after slumping below its 50 DMA line. Color code was changed to green after the latest technical deterioration and slump below its pivot point.
>>> The latest Featured Stock Update with an annotated graph appeared on 6/25/2010. Click here.
View all notes |
Alert me of new notes |
CANSLIM.net Company Profile |
SEC |
Zacks Reports |
StockTalk |
News |
Chart |
Request a new note
C
A N
S L
I M
|
Symbol/Exchange
Company Name
Industry Group |
PRICE |
CHANGE
(%Change) |
Day High |
Volume
(% DAV)
(% 50 day avg vol) |
52 Wk Hi
% From Hi |
Featured
Date |
Price
Featured |
Pivot Featured |
|
Max Buy |
|
|
|
THESE ARE NOT BUY RECOMMENDATIONS!
Comments contained in the body of this report are technical
opinions only. The material herein has been obtained
from sources believed to be reliable and accurate, however,
its accuracy and completeness cannot be guaranteed.
This site is not an investment advisor, hence it does
not endorse or recommend any securities or other investments.
Any recommendation contained in this report may not
be suitable for all investors and it is not to be deemed
an offer or solicitation on our part with respect to
the purchase or sale of any securities. All trademarks,
service marks and trade names appearing in this report
are the property of their respective owners, and are
likewise used for identification purposes only.
This report is a service available
only to active Paid Premium Members.
You may opt-out of receiving report notifications
at any time. Questions or comments may be submitted
by writing to Premium Membership Services 665 S.E. 10 Street, Suite 201 Deerfield Beach, FL 33441-5634 or by calling 1-800-965-8307
or 954-785-1121.
|
|
|


