You are not logged in.
This means you
CAN ONLY VIEW reports that were published prior to Monday, April 14, 2025.
You
MUST UPGRADE YOUR MEMBERSHIP if you want to see any current reports.
AFTER MARKET UPDATE - FRIDAY, JULY 1ST, 2011
Previous After Market Report Next After Market Report >>>
|
|
|
|
DOW |
+168.43 |
12,582.77 |
+1.36% |
|
Volume |
863,872,410 |
-13% |
|
Volume |
1,618,535,210 |
-11% |
|
NASDAQ |
+42.51 |
2,816.03 |
+1.53% |
|
Advancers |
2,484 |
80% |
|
Advancers |
1,901 |
71% |
|
S&P 500 |
+19.03 |
1,339.67 |
+1.44% |
|
Decliners |
549 |
18% |
|
Decliners |
677 |
25% |
|
Russell 2000 |
+12.61 |
840.04 |
+1.52% |
|
52 Wk Highs |
168 |
|
|
52 Wk Highs |
148 |
|
|
S&P 600 |
+7.23 |
451.92 |
+1.63% |
|
52 Wk Lows |
5 |
|
|
52 Wk Lows |
26 |
|
|
 |
Major Averages' Best Weekly Gains in Past 2 Years
Kenneth J. Gruneisen - Passed the CAN SLIM® Master's Exam
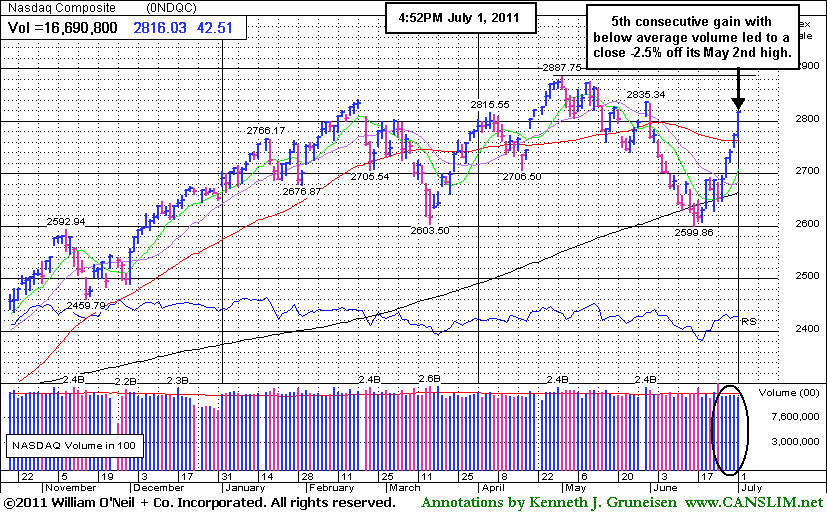
For the week, the Dow Jones Industrial Average rose +5.4%, the S&P 500 Index gained +5.6% and the Nasdaq Composite Index was up +6.2%. Fireworks got started early on Wall Street as the market averages capped their best weekly performance in a year with another explosive rally. The major averages rallied further above their 50-day moving average lines on Friday, however the pre-holiday session's volume totals were reported lighter than the prior session on the Nasdaq exchange and on the NYSE, a sign that institutional buying demand was not on the rise. Advancing issues beat decliners by more than 4-1 on the NYSE and by more than 3-1 on the Nasdaq exchange. New 52-week highs outnumbered new 52-week lows on both the Nasdaq exchange and the NYSE. New lows on the NYSE were in the single digits. There were 107 high-ranked companies from the CANSLIM.net Leaders List that made new 52-week highs and appeared on the CANSLIM.net BreakOuts Page, up from the total of 74 on the prior session. There were 11 gainers out of the 14 high-ranked leaders currently included on the Featured Stocks Page.
A report on manufacturing showed a surprising pickup in June. The Institute for Supply Management's national index, combined with Thursday's Midwest report, suggest that factory activity is recovering from the Japan supply disruptions. Crude oil fell below $94 after China reported manufacturing rose at a slower pace.
Dendreon Corp (DNDN +4.97%) rallied after regulators said the company's cancer medicine Provenge should be covered by Medicare. Blackboard Inc (BBBB +1.80%) rose as a private equity firm agreed to buy the educational software company for $1.6 billion. Darden Restaurants Inc (DRI +6.09%) projected full-year earnings above expectations and raised its dividend. On the downside, Eastman Kodak Co (EK -14.25%) sank after an unfavorable ruling in a patent fight.
Our July 2011 issue of CANSLIM.net News is due to be released soon with a comprehensive summary of current market conditions! The Q2 2011 CANSLIM.net Webcast is available "ON DEMAND" now to UPGRADED MEMBERS ONLY - (CLICK HERE).
PICTURED: The Nasdaq Composite Index rose for a 5th consecutive session with below average volume. The week's impressive +6.2% sprint leaves the tech-heavy index just -2.5% off its May 2nd high. The expansion in leadership (new highs) and technical improvement in the major averages has not met the definition of a convincing follow-through day, but regular readers may have noticed that the overall action in sum suggests that the market's rally effort has gathered more upward momentum.
|
 Kenneth J. Gruneisen started out as a licensed stockbroker in August 1987, a couple of months prior to the historic stock market crash that took the Dow Jones Industrial Average down -22.6% in a single day. He has published daily fact-based fundamental and technical analysis on high-ranked stocks online for two decades. Through FACTBASEDINVESTING.COM, Kenneth provides educational articles, news, market commentary, and other information regarding proven investment systems that work in good times and bad.
Comments contained in the body of this report are technical opinions only and are not necessarily those of Gruneisen Growth Corp. The material herein has been obtained from sources believed to be reliable and accurate, however, its accuracy and completeness cannot be guaranteed. Our firm, employees, and customers may effect transactions, including transactions contrary to any recommendation herein, or have positions in the securities mentioned herein or options with respect thereto. Any recommendation contained in this report may not be suitable for all investors and it is not to be deemed an offer or solicitation on our part with respect to the purchase or sale of any securities. |
|
 |
Bank Index Rises Above 50-Day Average
Kenneth J. Gruneisen - Passed the CAN SLIM® Master's Exam
The tech sector had a positive bias as the Semiconductor Index ($SOX +2.13%), Biotechnology Index ($BTK +1.12%), Networking Index ($NWX +1.30%), and Internet Index ($IIX +1.71%) finished unanimously higher. The Bank Index ($BKX +2.03%), Broker/Dealer Index ($XBD +2.18%), and the Retail Index ($RLX +2.04%) had a positive influence on the major averages. The Healthcare Index ($HMO +2.49%) was also a standout gainer, meanwhile another defensive index, the Gold & Silver Index ($XAU -0.84%), was a clear laggard as it lost ground on Friday's widely positive session. The Oil Services Index ($OSX +0.60%) and Integrated Oil Index ($XOI +1.08%) posted small gains.
Charts courtesy www.stockcharts.com
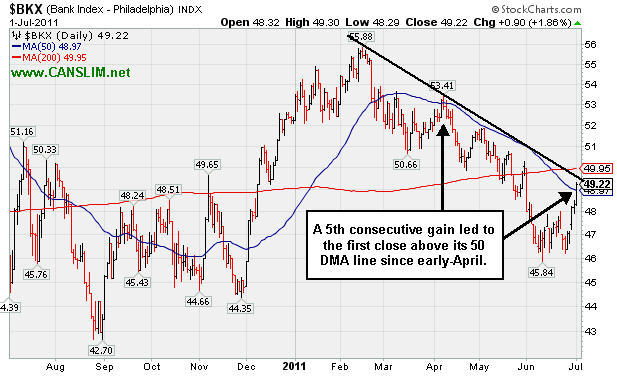
PICTURED: The Bank Index's ($BKX +2.03%) 5th consecutive gain led to its first close above its 50-day moving average (DMA) line since early-April. Its strength this week was encouraging, however its worrisome downward trend since February remains intact.
| Oil Services |
$OSX |
269.67 |
+1.62 |
+0.60% |
+10.02% |
| Healthcare |
$HMO |
2,501.17 |
+60.66 |
+2.49% |
+47.82% |
| Integrated Oil |
$XOI |
1,318.39 |
+14.09 |
+1.08% |
+8.67% |
| Semiconductor |
$SOX |
419.11 |
+8.76 |
+2.13% |
+1.77% |
| Networking |
$NWX |
306.79 |
+3.92 |
+1.30% |
+9.35% |
| Internet |
$IIX |
315.96 |
+5.30 |
+1.71% |
+2.68% |
| Broker/Dealer |
$XBD |
109.49 |
+2.33 |
+2.18% |
-9.90% |
| Retail |
$RLX |
540.76 |
+10.80 |
+2.04% |
+6.37% |
| Gold & Silver |
$XAU |
199.45 |
-1.68 |
-0.84% |
-11.97% |
| Bank |
$BKX |
49.30 |
+0.98 |
+2.03% |
-5.57% |
| Biotech |
$BTK |
1,476.97 |
+16.34 |
+1.12% |
+13.82% |
|
|
|
 |
New Base Formation Awaiting Technical Breakout
Kenneth J. Gruneisen - Passed the CAN SLIM® Master's Exam
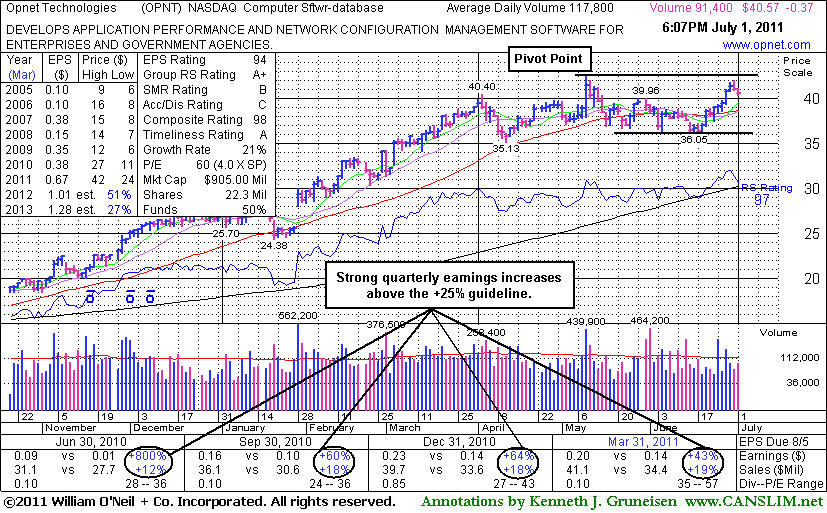
Opnet Technologies Inc (OPNT -$0.37 or -0.90% to $40.57) is perched near its 52-week high after building an orderly base. Its color code was changed to yellow and a new pivot point cited based on its 52-week high plus ten cents. Disciplined investors resist the urge to get in "early" and would watch for a confirming technical buy signal before taking action. Recent lows near $36 define important near-term chart support.
The stock's last appearance in this FSU section on 6/10/11 included an annotated graph under the headline, "Near 50 Day Average While Enduring Distributional Pressure". Recent quarters showed decent sales revenues growth and earnings above the +25% minimum guideline. Its annual earnings growth rate (A criteria) has been respectable since a previously noted downturn in FY '08. Strength and leadership (L criteria) in the Computer Software - Database group has recently been encouraging. Ownership by top-rated funds rose from 188 in Sep '10 to 228 in Mar '11, a reassuring sign concerning the I criteria. Return On Equity is reported at 12%, which is below the 17% guideline. However, management owns a 36% stake in its shares, keeping the directors motivated to maintain and build shareholder value.
|
|
|
Color Codes Explained :
Y - Better candidates highlighted by our
staff of experts.
G - Previously featured
in past reports as yellow but may no longer be buyable under the
guidelines.
***Last / Change / Volume data in this table is the closing quote data***
Symbol/Exchange
Company Name
Industry Group |
PRICE |
CHANGE
(%Change) |
Day High |
Volume
(% DAV)
(% 50 day avg vol) |
52 Wk Hi
% From Hi |
Featured
Date |
Price
Featured |
Pivot Featured |
|
Max Buy |
CACC
-
NASDAQ
Credit Acceptance Corp
FINANCIAL SERVICES - Credit Services
|
$86.06
|
+1.59
1.88% |
$86.87
|
23,341
56.11% of 50 DAV
50 DAV is 41,600
|
$84.50
1.85%
|
6/2/2011
|
$76.10
|
PP = $82.39
|
|
MB = $86.51
|
 Most Recent Note - 7/1/2011 2:00:29 PM
G - Quietly rising above its "max buy" level with today's gain, and its color code is changed to green while getting extended from its prior base. Triggered a technical buy signal with its rally above its pivot point backed by +52% above average volume on the prior session. Prior highs in the $80-82 area define initial support to watch on pullbacks.
>>> The latest Featured Stock Update with an annotated graph appeared on 6/27/2011. Click here.
View all notes |
Alert me of new notes |
CANSLIM.net Company Profile |
SEC |
Zacks Reports |
StockTalk |
News |
Chart |
Request a new note
C
A N
S L
I M


|
CMG
-
NYSE
Chipotle Mexican Grill
LEISURE - Restaurants
|
$315.72
|
+7.53
2.44% |
$316.85
|
827,001
80.41% of 50 DAV
50 DAV is 1,028,500
|
$308.93
2.20%
|
4/1/2011
|
$274.00
|
PP = $275.10
|
|
MB = $288.86
|
Most Recent Note - 7/1/2011 3:50:57 PM
G - Hitting another new all-time high with below average volume behind its gain today. Getting extended from prior highs that define initial chart support to watch.
>>> The latest Featured Stock Update with an annotated graph appeared on 6/15/2011. Click here.
View all notes |
Alert me of new notes |
CANSLIM.net Company Profile |
SEC |
Zacks Reports |
StockTalk |
News |
Chart |
Request a new note
C
A N
S L
I M
|
EZPW
-
NASDAQ
Ezcorp Inc Cl A
SPECIALTY RETAIL - Specialty Retail, Other
|
$35.83
|
+0.26
0.72% |
$35.95
|
488,184
132.98% of 50 DAV
50 DAV is 367,100
|
$35.98
-0.42%
|
6/13/2011
|
$31.18
|
PP = $33.41
|
|
MB = $35.08
|
Most Recent Note - 7/1/2011 3:53:56 PM
G - Stubbornly holding its ground and inching higher with today's 7th consecutive gain. Prior highs in the $33 area define support to watch on pullbacks.
>>> The latest Featured Stock Update with an annotated graph appeared on 6/13/2011. Click here.
View all notes |
Alert me of new notes |
CANSLIM.net Company Profile |
SEC |
Zacks Reports |
StockTalk |
News |
Chart |
Request a new note
C
A N
S L
I M
|
FCFS
-
NASDAQ
First Cash Financial Svs
SPECIALTY RETAIL - Specialty Retail, Other
|
$42.42
|
+0.43
1.02% |
$42.65
|
188,586
100.53% of 50 DAV
50 DAV is 187,600
|
$42.75
-0.77%
|
5/31/2011
|
$42.00
|
PP = $40.23
|
|
MB = $42.24
|
Most Recent Note - 7/1/2011 3:55:34 PM
Y - Up today with below average volume, poised for its best-ever close. Color code was changed to yellow based on recent resilience. A new pivot point was not cited, however some may consider its latest consolidation a new "square box" type base pattern. Prior lows in the $37 area define support to watch.
>>> The latest Featured Stock Update with an annotated graph appeared on 6/22/2011. Click here.
View all notes |
Alert me of new notes |
CANSLIM.net Company Profile |
SEC |
Zacks Reports |
StockTalk |
News |
Chart |
Request a new note
C
A N
S L
I M
|
FOSL
-
NASDAQ
Fossil Inc
CONSUMER DURABLES - Recreational Goods, Other
|
$121.96
|
+4.24
3.60% |
$122.00
|
581,650
78.63% of 50 DAV
50 DAV is 739,700
|
$119.46
2.10%
|
2/1/2011
|
$73.30
|
PP = $74.44
|
|
MB = $78.16
|
Most Recent Note - 7/1/2011 3:45:43 PM
G - Hitting yet another new all-time high with below average volume behind its gain today , getting more extended from prior highs in the $107 area that now define initial support to watch above its 50 DMA line.
>>> The latest Featured Stock Update with an annotated graph appeared on 6/28/2011. Click here.
View all notes |
Alert me of new notes |
CANSLIM.net Company Profile |
SEC |
Zacks Reports |
StockTalk |
News |
Chart |
Request a new note
C
A N
S L
I M
|
Symbol/Exchange
Company Name
Industry Group |
PRICE |
CHANGE
(%Change) |
Day High |
Volume
(% DAV)
(% 50 day avg vol) |
52 Wk Hi
% From Hi |
Featured
Date |
Price
Featured |
Pivot Featured |
|
Max Buy |
HS
-
NYSE
Healthspring Inc
HEALTH SERVICES - Health Care Plans
|
$47.13
|
+1.02
2.21% |
$47.50
|
892,581
101.06% of 50 DAV
50 DAV is 883,200
|
$47.78
-1.36%
|
6/16/2011
|
$42.44
|
PP = $45.21
|
|
MB = $47.47
|
Most Recent Note - 7/1/2011 3:58:38 PM
Y - Up today with near average volume, poised for its best-ever close. Held its ground stubbornly after its latest breakouts, and prior resistance defines support after its recent streak of gains with above average volume to new all-time highs.
>>> The latest Featured Stock Update with an annotated graph appeared on 6/16/2011. Click here.
View all notes |
Alert me of new notes |
CANSLIM.net Company Profile |
SEC |
Zacks Reports |
StockTalk |
News |
Chart |
Request a new note
C
A N
S L
I M
|
INFA
-
NASDAQ
Informatica Corp
COMPUTER SOFTWARE and SERVICES - Business Software and Services
|
$59.40
|
+0.97
1.66% |
$59.75
|
663,263
52.55% of 50 DAV
50 DAV is 1,262,100
|
$59.98
-0.97%
|
7/1/2011
|
$59.36
|
PP = $60.08
|
|
MB = $63.08
|
Most Recent Note - 7/1/2011 4:04:41 PM
Y - Quiet gain today for its best-ever close. Color code is changed to yellow with new pivot point cited based on its prior high plus 10 cents after a 5-week flat base during which it found support near its 50 DMA line. This high-ranked Computer Software - Database firm faces no overhead supply. A volume driven breakout may trigger a new (or add-on) technical buy signal.
>>> The latest Featured Stock Update with an annotated graph appeared on 6/17/2011. Click here.
View all notes |
Alert me of new notes |
CANSLIM.net Company Profile |
SEC |
Zacks Reports |
StockTalk |
News |
Chart |
Request a new note
C
A N
S L
I M
|
LULU
-
NASDAQ
Lululemon Athletica
MANUFACTURING - Textile Manufacturing
|
$115.62
|
+3.80
3.40% |
$115.93
|
1,552,776
77.03% of 50 DAV
50 DAV is 2,015,700
|
$114.20
1.25%
|
6/21/2011
|
$102.95
|
PP = $101.14
|
|
MB = $106.20
|
Most Recent Note - 7/1/2011 3:47:35 PM
G - Hitting new 52-week and all-time highs with below average volume behind today's gain, getting more extended from its latest base. Disciplined investors avoid chasing extended stocks. Prior highs define important chart support to watch.
>>> The latest Featured Stock Update with an annotated graph appeared on 6/21/2011. Click here.
View all notes |
Alert me of new notes |
CANSLIM.net Company Profile |
SEC |
Zacks Reports |
StockTalk |
News |
Chart |
Request a new note
C
A N
S L
I M
|
MWIV
-
NASDAQ
M W I Veterinary Supply
HEALTH SERVICES - Medical Instruments and; Supplies
|
$81.86
|
+1.09
1.35% |
$82.06
|
62,827
79.33% of 50 DAV
50 DAV is 79,200
|
$86.99
-5.90%
|
11/4/2010
|
$61.79
|
PP = $59.60
|
|
MB = $62.58
|
Most Recent Note - 7/1/2011 4:09:19 PM
G - Gains in recent weeks lacked volume conviction, yet today it quietly climbed above its 50 DMA line which has been acting as a stubborn resistance level.
>>> The latest Featured Stock Update with an annotated graph appeared on 6/30/2011. Click here.
View all notes |
Alert me of new notes |
CANSLIM.net Company Profile |
SEC |
Zacks Reports |
StockTalk |
News |
Chart |
Request a new note
C
A N
S L
I M
|
OPNT
-
NASDAQ
Opnet Technologies
INTERNET - Internet Software and Services
|
$40.57
|
-0.37
-0.90% |
$41.13
|
94,782
80.46% of 50 DAV
50 DAV is 117,800
|
$42.51
-4.56%
|
6/28/2011
|
$40.87
|
PP = $42.61
|
|
MB = $44.74
|
Most Recent Note - 7/1/2011 4:11:24 PM
Y - Perched near its 52-week high after building an orderly base. Color code was changed to yellow and a new pivot point cited based on its 52-week high plus ten cents. Disciplined investors watch for a confirming technical buy signal before taking action. Recent lows near $36 define important near-term chart support.
>>> The latest Featured Stock Update with an annotated graph appeared on 7/1/2011. Click here.
View all notes |
Alert me of new notes |
CANSLIM.net Company Profile |
SEC |
Zacks Reports |
StockTalk |
News |
Chart |
Request a new note
C
A N
S L
I M
|
Symbol/Exchange
Company Name
Industry Group |
PRICE |
CHANGE
(%Change) |
Day High |
Volume
(% DAV)
(% 50 day avg vol) |
52 Wk Hi
% From Hi |
Featured
Date |
Price
Featured |
Pivot Featured |
|
Max Buy |
OTEX
-
NASDAQ
Open Text Corp
INTERNET - Internet Software and Services
|
$64.65
|
+0.63
0.98% |
$64.93
|
161,001
51.05% of 50 DAV
50 DAV is 315,400
|
$67.08
-3.62%
|
6/1/2011
|
$65.86
|
PP = $67.18
|
|
MB = $70.54
|
Most Recent Note - 7/1/2011 4:13:30 PM
Y - Lighter volume was behind today's 5th consecutive gain to a close -3.5% off its 52-week high. Color code was changed to yellow based on recent resilience, yet volume-driven gains above the previously cited pivot point are necessary to trigger a technical buy signal.
>>> The latest Featured Stock Update with an annotated graph appeared on 6/24/2011. Click here.
View all notes |
Alert me of new notes |
CANSLIM.net Company Profile |
SEC |
Zacks Reports |
StockTalk |
News |
Chart |
Request a new note
C
A N
S L
I M
|
SWI
-
NYSE
Solarwinds Inc
COMPUTER SOFTWARE and SERVICES - Application Software
|
$25.92
|
-0.22
-0.84% |
$26.19
|
815,818
98.39% of 50 DAV
50 DAV is 829,200
|
$26.68
-2.85%
|
6/7/2011
|
$24.22
|
PP = $25.05
|
|
MB = $26.30
|
Most Recent Note - 7/1/2011 4:15:09 PM
Y - Quietly holding its ground between its pivot point and "max buy" level. Prior resistance in the $24-25 area defines support. A subsequent close under its old high close ($24.77 on 4/25/11) would raise concerns by negating its recent breakout.
>>> The latest Featured Stock Update with an annotated graph appeared on 6/29/2011. Click here.
View all notes |
Alert me of new notes |
CANSLIM.net Company Profile |
SEC |
Zacks Reports |
StockTalk |
News |
Chart |
Request a new note
C
A N
S L
I M
|
ULTA
-
NASDAQ
Ulta Salon Cosm & Frag
SPECIALTY RETAIL - Specialty Retail, Other
|
$65.18
|
+0.60
0.93% |
$65.35
|
520,638
61.88% of 50 DAV
50 DAV is 841,300
|
$65.27
-0.14%
|
1/6/2011
|
$36.12
|
PP = $37.34
|
|
MB = $39.21
|
Most Recent Note - 7/1/2011 4:16:20 PM
G - Hit yet another new all-time high with a gain on light volume today, getting more extended from any sound base pattern. It may produce more climactic gains, but disciplined investors avoid chasing extended stocks.
>>> The latest Featured Stock Update with an annotated graph appeared on 6/20/2011. Click here.
View all notes |
Alert me of new notes |
CANSLIM.net Company Profile |
SEC |
Zacks Reports |
StockTalk |
News |
Chart |
Request a new note
C
A N
S L
I M
|
ZAGG
-
NASDAQ
Zagg Inc
SPECIALTY RETAIL - Specialty Retail, Other
|
$12.85
|
-0.55
-4.10% |
$13.40
|
2,771,576
154.22% of 50 DAV
50 DAV is 1,797,200
|
$15.85
-18.93%
|
6/1/2011
|
$10.92
|
PP = $10.59
|
|
MB = $11.12
|
Most Recent Note - 7/1/2011 1:55:14 PM
G - Today marks its 5th loss with above average volume in the span of 6 sessions while consolidating from its all-time high. After a spurt of volume-driven gains it is extended from a sound base. Prior highs define initial support to watch on pullbacks.
>>> The latest Featured Stock Update with an annotated graph appeared on 6/23/2011. Click here.
View all notes |
Alert me of new notes |
CANSLIM.net Company Profile |
SEC |
Zacks Reports |
StockTalk |
News |
Chart |
Request a new note
C
A N
S L
I M
|
|
|
|
THESE ARE NOT BUY RECOMMENDATIONS!
Comments contained in the body of this report are technical
opinions only. The material herein has been obtained
from sources believed to be reliable and accurate, however,
its accuracy and completeness cannot be guaranteed.
This site is not an investment advisor, hence it does
not endorse or recommend any securities or other investments.
Any recommendation contained in this report may not
be suitable for all investors and it is not to be deemed
an offer or solicitation on our part with respect to
the purchase or sale of any securities. All trademarks,
service marks and trade names appearing in this report
are the property of their respective owners, and are
likewise used for identification purposes only.
This report is a service available
only to active Paid Premium Members.
You may opt-out of receiving report notifications
at any time. Questions or comments may be submitted
by writing to Premium Membership Services 665 S.E. 10 Street, Suite 201 Deerfield Beach, FL 33441-5634 or by calling 1-800-965-8307
or 954-785-1121.
|
|
|

