You are not logged in.
This means you
CAN ONLY VIEW reports that were published prior to Monday, April 14, 2025.
You
MUST UPGRADE YOUR MEMBERSHIP if you want to see any current reports.
AFTER MARKET UPDATE - WEDNESDAY, JUNE 30TH, 2010
Previous After Market Report Next After Market Report >>>
|
|
|
|
DOW |
-96.28 |
9,774.02 |
-0.98% |
|
Volume |
1,431,633,070 |
-11% |
|
Volume |
2,129,365,420 |
-21% |
|
NASDAQ |
-25.94 |
2,109.24 |
-1.21% |
|
Advancers |
1,116 |
35% |
|
Advancers |
982 |
35% |
|
S&P 500 |
-10.53 |
1,030.71 |
-1.01% |
|
Decliners |
1,921 |
61% |
|
Decliners |
1,710 |
61% |
|
Russell 2000 |
-6.47 |
609.49 |
-1.05% |
|
52 Wk Highs |
29 |
|
|
52 Wk Highs |
15 |
|
|
S&P 600 |
-3.13 |
327.97 |
-0.95% |
|
52 Wk Lows |
103 |
|
|
52 Wk Lows |
160 |
|
|
 |
Benchmark S&P 500 Index Slumps To New 2010 Low
Adam Sarhan, Contributing Writer,
The major averages ended lower on the final day of the second quarter as European debt woes threatened the global economic recovery. Widespread losses this week coupled with the ominous technical damage effectively ended the latest confirmed rally which began with the June 15, 2010 follow-through day (FTD). Wednesday's volume totals were reported lower on the NYSE and the Nasdaq exchange compared to Tuesday's levels, which was a sign of less selling pressure from large and most-influential institutional investors. Decliners trumped advancers by almost a 2-to-1 ratio on the NYSE and the Nasdaq exchange. There were only 4 high-ranked companies from the CANSLIM.net Leaders List that made a new 52-week high and appeared on the CANSLIM.net BreakOuts Page, up from the 2 issues that appeared on the prior session. Meanwhile, new 52-week lows substantially outnumbered new 52-week highs on the NYSE and the Nasdaq exchange. As leadership evaporated in recent sessions, in this commentary it was repeatedly noted - "Without a healthy crop of leaders hitting new highs it is hard for the major averages to sustain a rally."
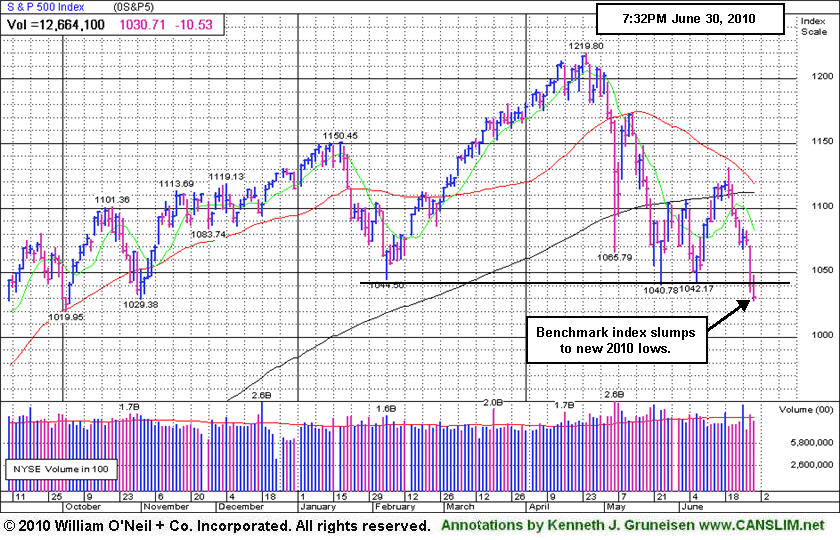
It was a brutal quarter on Wall Street. The Nasdaq Composite and the benchmark S&P 500 Index both fell -12% while the Dow Jones Industrial Average and the small cap Russell 2000 Index skidded -10%, marking their worst quarters since Q4 2008. It was the tech-heavy Nasdaq's worst second quarter since 2002. For the year, the Nasdaq composite is down -7%, the S&P 500 is -7.8% and the Dow Jones Industrial Average is -6%. In addition, it was worrisome to see the S&P 500 close below 1,040 which has served as formidable support for most of the year.
Before Wednesday's opening bell, ADP, the country's largest private payrolls firm, said private payrolls rose by a smaller-than-expected reading in June which bodes poorly for the ailing jobs market and Friday's official Non-farm Payrolls Report. After Wednesday's open, the Institute for Supply Management released it's Chicago area business index which showed manufacturing improved which bodes well for the economic recovery.
The market is in a correction which emphasizes the importance of raising cash and adopting a strong defensive stance until a new follow-through day emerges. For the past several weeks, this column has steadily noted the importance of remaining very selective and disciplined because all of the major averages are still trading below their downward sloping 50-day moving average (DMA) lines. Their 50 DMA line may continue to act as stubborn resistance. It was also recently noted that the NYSE Composite Index's 50 DMA line already sliced below the 200 DMA line, an event known by market technicians as a "death cross" which usually has bearish implications. Trade accordingly.
LAST MINUTE NOTIFICATION: We apologize for the short notice! TONIGHT the Q2 2010 CANSLIM.net Webcast airs - 8PM EST on Wednesday, June 30, 2010. A link to the webcast has been added near the top on the Premium Membership Homepage which will allow all who have UPGRADED with a currently active premium (paid) membership to view the webcast at 8PM EST or ON DEMAND at any time afterward. To UPGRADE now for access to the webcast and all premium reports CLICK HERE. PICTURED: The S&P 500 Index slumped to a new 2010 low.
|
|
|
 |
Retail Index Violated February 2010 Low
Kenneth J. Gruneisen - Passed the CAN SLIM® Master's Exam
The tech sector was weak on Wednesday as the Networking Index ($NWX -1.77%), Semiconductor Index ($SOX -1.59%), Biotechnology Index ($BTK -1.33%), and Internet Index ($IIX -1.10%) finished unanimously lower. Financial shares also had a negative influence on the major averages as the Bank Index ($BKX -1.54%) and Broker/Dealer Index ($XBD -0.94%) continued to deteriorate in a worrisome fashion. The Healthcare Index ($HMO -1.59%) and Integrated Oil Index ($XOI -0.73%) were also a drag on the market while the Gold & Silver Index ($XAU -0.15%) and Oil Services Index ($OSX +0.02%) showed little change.
Charts courtesy www.stockcharts.com
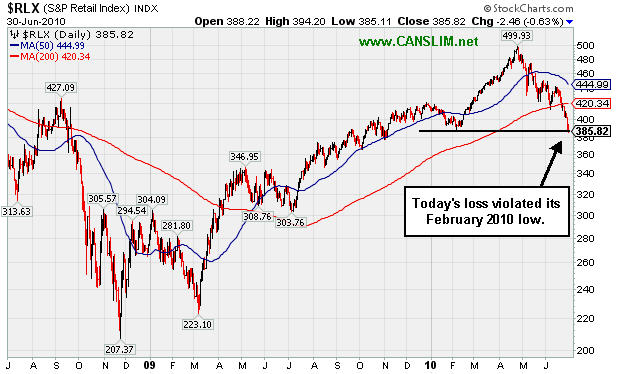
PICTURED: The Retail Index ($RLX -0.63%) suffered a modest loss, however it was enough to technically violate its February 2010 low.
| Oil Services |
$OSX |
164.13 |
+0.03 |
+0.02% |
-15.80% |
| Healthcare |
$HMO |
1,399.48 |
-22.64 |
-1.59% |
-4.99% |
| Integrated Oil |
$XOI |
883.62 |
-6.53 |
-0.73% |
-17.28% |
| Semiconductor |
$SOX |
332.30 |
-5.37 |
-1.59% |
-7.67% |
| Networking |
$NWX |
215.35 |
-3.88 |
-1.77% |
-6.80% |
| Internet |
$IIX |
220.94 |
-2.46 |
-1.10% |
-5.52% |
| Broker/Dealer |
$XBD |
96.97 |
-0.93 |
-0.94% |
-15.71% |
| Retail |
$RLX |
385.82 |
-2.46 |
-0.63% |
-6.15% |
| Gold & Silver |
$XAU |
177.63 |
-0.27 |
-0.15% |
+5.58% |
| Bank |
$BKX |
46.12 |
-0.72 |
-1.54% |
+7.98% |
| Biotech |
$BTK |
1,023.08 |
-13.82 |
-1.33% |
+8.59% |
|
|
|
 |
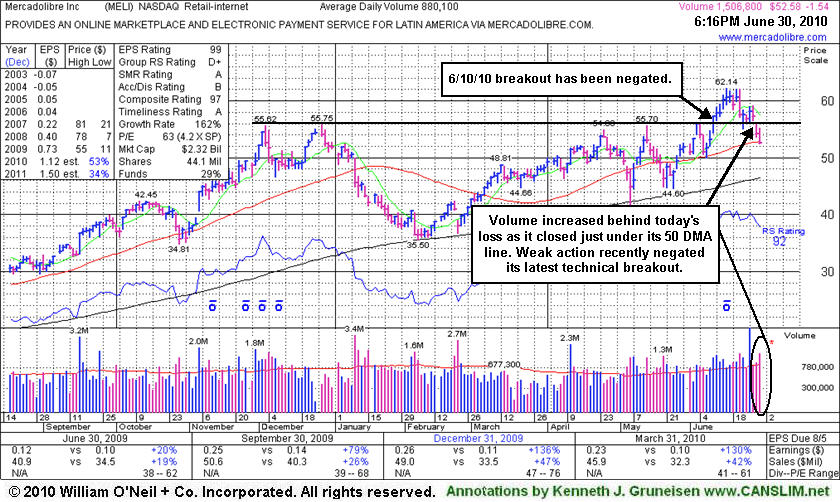
Recent Breakout Negated By Weak Action
Kenneth J. Gruneisen - Passed the CAN SLIM® Master's Exam
Mercadolibre Inc. (MELI -$1.57 or -2.90% to $52.55) fell today with above average volume, marking its 3rd straight loss. It finished near but just below its 50-day moving average (DMA) line. Its slump under prior chart highs in the $55 area this week has raised concerns as it completely negated its 6/10/10 breakout. When it was last shown in this FSU section on 6/10/10 under the headline Strong Finish On High Volume Triggers Technical Buy an annotated graph illustrated the bullish action as it "surged in the final hour of today's session and hit a new 52-week high with a considerable gain above its pivot point on volume backed by +79% above average, triggering a technical buy signal."
The Latin American Internet - eCommerce firm was featured in yellow in the 5/13/10 mid-day report (read here). It found great support at its long-term 200-day moving average (DMA) line on pullbacks this year, an encouraging sign. Support near its shorter-term moving average would be a nice reassurance now, rather than more worrisome losses. Prompt gains back above the $55 level could help its outlook. Top-rated funds owning an interest rose from 62 in Dec '08 to 94 in Mar '10, which is encouraging concerning the I criteria. Its strong quarterly earnings and annual earnings history satisfy the C and A criteria.
|
|
|
Color Codes Explained :
Y - Better candidates highlighted by our
staff of experts.
G - Previously featured
in past reports as yellow but may no longer be buyable under the
guidelines.
***Last / Change / Volume data in this table is the closing quote data***
Symbol/Exchange
Company Name
Industry Group |
PRICE |
CHANGE
(%Change) |
Day High |
Volume
(% DAV)
(% 50 day avg vol) |
52 Wk Hi
% From Hi |
Featured
Date |
Price
Featured |
Pivot Featured |
|
Max Buy |
AAPL
-
NASDAQ
Apple Inc
COMPUTER HARDWARE - Personal Computers
|
$251.53
|
-4.64
-1.81% |
$257.97
|
26,370,548
91.48% of 50 DAV
50 DAV is 28,826,600
|
$279.01
-9.85%
|
6/17/2010
|
$270.95
|
PP = $272.56
|
|
MB = $286.19
|
 Most Recent Note - 6/30/2010 5:23:33 PM
G - Down again today on lighter volume after a considerable loss on 6/28/10 with heavy volume while violating its 50 DMA line and triggering a technical sell signal. It was featured in the 6/17/10 mid-day report (read here).
>>> The latest Featured Stock Update with an annotated graph appeared on 6/17/2010. Click here.
View all notes |
Alert me of new notes |
CANSLIM.net Company Profile |
SEC |
Zacks Reports |
StockTalk |
News |
Chart |
Request a new note
C
A N
S L
I M


|
ABV
-
NYSE
Comp De Bebidas Adr
FOOD and BEVERAGE - Beverages - Brewers
|
$101.01
|
-3.29
-3.15% |
$104.50
|
895,020
127.97% of 50 DAV
50 DAV is 699,400
|
$109.33
-7.61%
|
6/29/2010
|
$104.74
|
PP = $109.33
|
|
MB = $114.80
|
Most Recent Note - 6/30/2010 5:27:04 PM
G - Brazil-based beverage firm slumped toward its 50 DMA line today with above average volume behind its second consecutive loss. Color code is changed to green based on its deteriorating strength. A new FTD is needed before any buying efforts may be justifiable under the investment system's guidelines. It was featured in yellow in the 6/29/10 mid-day report (read here) with a note while - "perched near all-time highs after building an orderly base pattern and finding impressive support near its 200 DMA line in recent months. It has a great annual earnings (A criteria) history and its recent quarterly earnings and sales revenues increases have shown acceleration. A gain above its pivot point with heavy volume still needed to confirm a proper new technical buy signal."
>>> The latest Featured Stock Update with an annotated graph appeared on 6/29/2010. Click here.
View all notes |
Alert me of new notes |
CANSLIM.net Company Profile |
SEC |
Zacks Reports |
StockTalk |
News |
Chart |
Request a new note
C
A N
S L
I M
|
APEI
-
NASDAQ
American Public Educ Inc
DIVERSIFIED SERVICES - Education and Training Services
|
$43.70
|
-0.71
-1.60% |
$44.71
|
144,767
83.30% of 50 DAV
50 DAV is 173,800
|
$48.95
-10.73%
|
6/7/2010
|
$46.60
|
PP = $46.29
|
|
MB = $48.60
|
Most Recent Note - 6/30/2010 5:31:21 PM
G - Down today for a 4th consecutive loss. Color code is changed to green while it slumps under its 50 DMA line, falling amid broad market (M criteria) weakness.
>>> The latest Featured Stock Update with an annotated graph appeared on 6/14/2010. Click here.
View all notes |
Alert me of new notes |
CANSLIM.net Company Profile |
SEC |
Zacks Reports |
StockTalk |
News |
Chart |
Request a new note
C
A N
S L
I M
|
BIDU
-
NASDAQ
Baidu Inc Ads
INTERNET - Internet Information Providers
|
$68.08
|
+0.51
0.75% |
$70.35
|
15,188,216
101.18% of 50 DAV
50 DAV is 15,011,600
|
$82.29
-17.27%
|
1/13/2010
|
$43.13
|
PP = $42.68
|
|
MB = $44.81
|
Most Recent Note - 6/30/2010 5:34:04 PM
G - Held its ground today. A considerable loss on 6/29/10 amid China-linked weakness and broad-based losses led to a violation of its 50 DMA line on heavier volume, triggering a worrisome technical sell signal. Now it is trading near prior chart lows in the $66 area that define the next level of important chart support.
>>> The latest Featured Stock Update with an annotated graph appeared on 6/21/2010. Click here.
View all notes |
Alert me of new notes |
CANSLIM.net Company Profile |
SEC |
Zacks Reports |
StockTalk |
News |
Chart |
Request a new note
C
A N
S L
I M
|
BRLI
-
NASDAQ
Bio Reference Labs Inc
HEALTH SERVICES - Medical Laboratories and Researc
|
$22.17
|
+0.04
0.18% |
$22.42
|
297,262
152.52% of 50 DAV
50 DAV is 194,900
|
$24.67
-10.15%
|
6/15/2010
|
$23.57
|
PP = $24.77
|
|
MB = $26.01
|
Most Recent Note - 6/30/2010 5:35:50 PM
G - Held its ground with a small gain today backed by above average volume. It slumped below its 50 DMA line amid broader market (M criteria) weakness. Color code was changed to green based on recent distributional action. Gains above its recent high ($23.87 on 6/18/10) would be an encouraging sign.
>>> The latest Featured Stock Update with an annotated graph appeared on 6/15/2010. Click here.
View all notes |
Alert me of new notes |
CANSLIM.net Company Profile |
SEC |
Zacks Reports |
StockTalk |
News |
Chart |
Request a new note
C
A N
S L
I M
|
Symbol/Exchange
Company Name
Industry Group |
PRICE |
CHANGE
(%Change) |
Day High |
Volume
(% DAV)
(% 50 day avg vol) |
52 Wk Hi
% From Hi |
Featured
Date |
Price
Featured |
Pivot Featured |
|
Max Buy |
CISG
-
NASDAQ
Cninsure Inc Ads
INSURANCE - Insurance Brokers
|
$25.94
|
-0.13
-0.50% |
$26.16
|
197,005
63.94% of 50 DAV
50 DAV is 308,100
|
$28.62
-9.36%
|
6/16/2010
|
$27.20
|
PP = $27.75
|
|
MB = $29.14
|
Most Recent Note - 6/30/2010 5:40:09 PM
G - Held its ground today following a gap down on 6/29/10 amid widespread losses in China-based firms and weak action in the broader market. It has traded light volume as it slumped under its 50 DMA line. Featured in the 6/16/10 mid-day report (read here).
>>> The latest Featured Stock Update with an annotated graph appeared on 6/18/2010. Click here.
View all notes |
Alert me of new notes |
CANSLIM.net Company Profile |
SEC |
Zacks Reports |
StockTalk |
News |
Chart |
Request a new note
C
A N
S L
I M
|
CRM
-
NYSE
Salesforce.Com Inc
INTERNET - Internet Software and Services
|
$85.82
|
+0.41
0.48% |
$87.57
|
3,875,253
139.01% of 50 DAV
50 DAV is 2,787,700
|
$97.94
-12.37%
|
6/2/2010
|
$88.44
|
PP = $89.60
|
|
MB = $94.08
|
Most Recent Note - 6/30/2010 5:42:22 PM
G - Held its ground today following a considerable loss on 6/29/10 with above average volume after gapping down. Violations of prior highs in the $89 area and its 50 DMA line triggered technical sell signals and raised concerns.
>>> The latest Featured Stock Update with an annotated graph appeared on 6/22/2010. Click here.
View all notes |
Alert me of new notes |
CANSLIM.net Company Profile |
SEC |
Zacks Reports |
StockTalk |
News |
Chart |
Request a new note
C
A N
S L
I M
|
DECK
-
NASDAQ
Deckers Outdoor Corp
CONSUMER NON-DURABLES - Textile - Apparel Footwear
|
$142.87
|
-1.37
-0.95% |
$146.67
|
456,590
84.10% of 50 DAV
50 DAV is 542,900
|
$168.52
-15.22%
|
6/11/2010
|
$157.34
|
PP = $158.57
|
|
MB = $166.50
|
Most Recent Note - 6/30/2010 5:44:10 PM
G - Loss today with light volume. Slumping under its 50 DMA line and raising concerns this week, its color code was changed to green based on weak action.
>>> The latest Featured Stock Update with an annotated graph appeared on 6/11/2010. Click here.
View all notes |
Alert me of new notes |
CANSLIM.net Company Profile |
SEC |
Zacks Reports |
StockTalk |
News |
Chart |
Request a new note
C
A N
S L
I M
|
FFIV
-
NASDAQ
F 5 Networks Inc
INTERNET - Internet Software and Services
|
$68.57
|
-0.52
-0.75% |
$70.52
|
2,086,161
121.53% of 50 DAV
50 DAV is 1,716,600
|
$77.10
-11.06%
|
6/16/2010
|
$74.50
|
PP = $74.10
|
|
MB = $77.81
|
Most Recent Note - 6/30/2010 5:47:32 PM
G - Down today with slightly higher volume after a 6/29/10 gap down and violation of its 50 DMA line raised concerns. Color code was changed to green based on weak technical action.
>>> The latest Featured Stock Update with an annotated graph appeared on 6/16/2010. Click here.
View all notes |
Alert me of new notes |
CANSLIM.net Company Profile |
SEC |
Zacks Reports |
StockTalk |
News |
Chart |
Request a new note
C
A N
S L
I M
|
MELI
-
NASDAQ
Mercadolibre Inc
INTERNET - Internet Software and; Services
|
$52.55
|
-1.57
-2.90% |
$55.20
|
1,580,594
179.59% of 50 DAV
50 DAV is 880,100
|
$62.14
-15.43%
|
5/13/2010
|
$54.21
|
PP = $55.85
|
|
MB = $58.64
|
Most Recent Note - 6/30/2010 5:53:44 PM
G - Today above average volume marked its 3rd straight loss, and its slump under prior chart highs in the $55 area raised concerns. Finished near but just below its 50 DMA line.
>>> The latest Featured Stock Update with an annotated graph appeared on 6/30/2010. Click here.
View all notes |
Alert me of new notes |
CANSLIM.net Company Profile |
SEC |
Zacks Reports |
StockTalk |
News |
Chart |
Request a new note
C
A N
S L
I M
|
Symbol/Exchange
Company Name
Industry Group |
PRICE |
CHANGE
(%Change) |
Day High |
Volume
(% DAV)
(% 50 day avg vol) |
52 Wk Hi
% From Hi |
Featured
Date |
Price
Featured |
Pivot Featured |
|
Max Buy |
NEM
-
NYSE
Newmont Mining Corp
METALS and MINING - Gold
|
$61.74
|
+0.59
0.96% |
$62.37
|
11,125,675
113.71% of 50 DAV
50 DAV is 9,784,600
|
$62.62
-1.41%
|
6/22/2010
|
$59.60
|
PP = $59.67
|
|
MB = $62.65
|
Most Recent Note - 6/30/2010 5:54:40 PM
Y - Stubbornly holding its ground perched near its 52-week high. Volume behind recent gains has been below the minimum guidelines (since its mid-May breakout faltered). The America-based mining firm has some reassuring leadership (L criteria) from other Mining - Gold/Silver/Gems industry firms as a favorable backdrop. No overhead supply remains to act as resistance. Featured in a 6/22/10 Stock Bulletin with annotated graph (read here).
>>> The latest Featured Stock Update with an annotated graph appeared on 6/22/2010. Click here.
View all notes |
Alert me of new notes |
CANSLIM.net Company Profile |
SEC |
Zacks Reports |
StockTalk |
News |
Chart |
Request a new note
C
A N
S L
I M
|
ROVI
-
NASDAQ
Rovi Corp
COMPUTER SOFTWARE andamp; SERVICES - Security Software andamp; Services
|
$37.91
|
+0.08
0.21% |
$38.67
|
1,320,202
95.25% of 50 DAV
50 DAV is 1,386,100
|
$40.06
-5.37%
|
6/3/2010
|
$38.70
|
PP = $40.16
|
|
MB = $42.17
|
Most Recent Note - 6/29/2010 4:41:56 PM
Y - Consolidating near its 50 DMA line amid broader market (M criteria) weakness, closing only -5.6 off its 52-week high. Color code was changed to yellow again, while disciplined investors will await a new FTD and a convincing gain above its pivot point with heavy volume to trigger a new buy signal. Prior lows near $35 area define support above its 200 DMA line.
>>> The latest Featured Stock Update with an annotated graph appeared on 6/28/2010. Click here.
View all notes |
Alert me of new notes |
CANSLIM.net Company Profile |
SEC |
Zacks Reports |
StockTalk |
News |
Chart |
Request a new note
C
A N
S L
I M
|
SUMR
-
NASDAQ
Summer Infant Inc
CONSUMER NON-DURABLES - Personal Products
|
$6.55
|
+0.08
1.24% |
$6.79
|
49,283
46.63% of 50 DAV
50 DAV is 105,700
|
$8.42
-22.21%
|
5/4/2010
|
$6.85
|
PP = $7.09
|
|
MB = $7.44
|
Most Recent Note - 6/30/2010 5:56:39 PM
G - Holding its ground today after pulling back near recent chart lows in the $6.25 area that define important support to watch. Gains back above its 50 DMA line and above recent chart highs near $7.40 would be an encouraging technical improvement.
>>> The latest Featured Stock Update with an annotated graph appeared on 6/24/2010. Click here.
View all notes |
Alert me of new notes |
CANSLIM.net Company Profile |
SEC |
Zacks Reports |
StockTalk |
News |
Chart |
Request a new note
C
A N
S L
I M
|
THOR
-
NASDAQ
Thoratec Corp
HEALTH SERVICES - Medical Instruments and Supplies
|
$42.73
|
-0.81
-1.86% |
$44.20
|
625,401
52.91% of 50 DAV
50 DAV is 1,181,900
|
$47.93
-10.85%
|
6/3/2010
|
$44.38
|
PP = $45.35
|
|
MB = $47.62
|
Most Recent Note - 6/30/2010 5:58:52 PM
G- Down today on lighter volume, it is consolidating above its 50 DMA line which is an important support level to watch. Its slump below its pivot point raised concerns last week.
>>> The latest Featured Stock Update with an annotated graph appeared on 6/23/2010. Click here.
View all notes |
Alert me of new notes |
CANSLIM.net Company Profile |
SEC |
Zacks Reports |
StockTalk |
News |
Chart |
Request a new note
C
A N
S L
I M
|
ULTA
-
NASDAQ
Ulta Salon Cosm & Frag
SPECIALTY RETAIL - Specialty Retail, Other
|
$23.66
|
-0.39
-1.60% |
$24.48
|
479,291
72.00% of 50 DAV
50 DAV is 665,700
|
$26.75
-11.57%
|
5/28/2010
|
$25.58
|
PP = $25.86
|
|
MB = $27.15
|
Most Recent Note - 6/30/2010 6:02:16 PM
G - Loss today with light volume led to a close just below its 50 DMA line. Color code is changed to green after the latest technical deterioration and slump below its pivot point.
>>> The latest Featured Stock Update with an annotated graph appeared on 6/25/2010. Click here.
View all notes |
Alert me of new notes |
CANSLIM.net Company Profile |
SEC |
Zacks Reports |
StockTalk |
News |
Chart |
Request a new note
C
A N
S L
I M
|
Symbol/Exchange
Company Name
Industry Group |
PRICE |
CHANGE
(%Change) |
Day High |
Volume
(% DAV)
(% 50 day avg vol) |
52 Wk Hi
% From Hi |
Featured
Date |
Price
Featured |
Pivot Featured |
|
Max Buy |
|
|
|
THESE ARE NOT BUY RECOMMENDATIONS!
Comments contained in the body of this report are technical
opinions only. The material herein has been obtained
from sources believed to be reliable and accurate, however,
its accuracy and completeness cannot be guaranteed.
This site is not an investment advisor, hence it does
not endorse or recommend any securities or other investments.
Any recommendation contained in this report may not
be suitable for all investors and it is not to be deemed
an offer or solicitation on our part with respect to
the purchase or sale of any securities. All trademarks,
service marks and trade names appearing in this report
are the property of their respective owners, and are
likewise used for identification purposes only.
This report is a service available
only to active Paid Premium Members.
You may opt-out of receiving report notifications
at any time. Questions or comments may be submitted
by writing to Premium Membership Services 665 S.E. 10 Street, Suite 201 Deerfield Beach, FL 33441-5634 or by calling 1-800-965-8307
or 954-785-1121.
|
|
|


