You are not logged in.
This means you
CAN ONLY VIEW reports that were published prior to Monday, April 14, 2025.
You
MUST UPGRADE YOUR MEMBERSHIP if you want to see any current reports.
AFTER MARKET UPDATE - WEDNESDAY, JUNE 29TH, 2011
Previous After Market Report Next After Market Report >>>
|
|
|
|
DOW |
+72.73 |
12,261.42 |
+0.60% |
|
Volume |
909,084,200 |
+13% |
|
Volume |
1,752,143,430 |
+7% |
|
NASDAQ |
+11.18 |
2,740.49 |
+0.41% |
|
Advancers |
2,060 |
66% |
|
Advancers |
1,367 |
51% |
|
S&P 500 |
+10.74 |
1,307.41 |
+0.83% |
|
Decliners |
960 |
31% |
|
Decliners |
1,215 |
45% |
|
Russell 2000 |
+2.61 |
819.92 |
+0.32% |
|
52 Wk Highs |
81 |
|
|
52 Wk Highs |
100 |
|
|
S&P 600 |
+1.64 |
439.67 |
+0.37% |
|
52 Wk Lows |
14 |
|
|
52 Wk Lows |
29 |
|
|
 |
Volume Totals Picked Up Behind Smaller Gains
Kenneth J. Gruneisen - Passed the CAN SLIM® Master's Exam
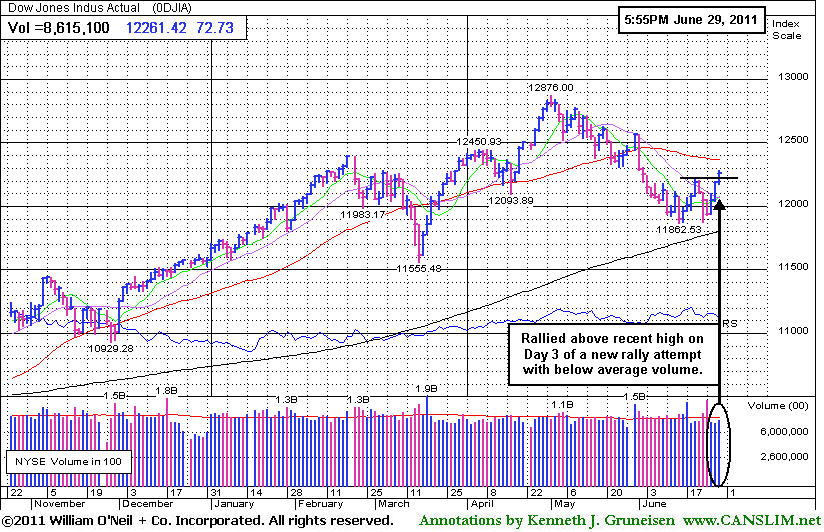
The volume totals were reported higher than the prior session on both the Nasdaq exchange and the NYSE behind Wednesday's gains. That revealed slightly better institutional buying demand as advancers led decliners by more than 2-1 on the NYSE and led by a narrow 7-6 margin on the Nasdaq exchange. However, the volume totals still were below average. The small percentage gains for the major averages also were not substantial enough to be considered the follow-through day that is still needed as a confirmation to the current rally attempt. New 52-week highs outnumbered new 52-week lows on both the Nasdaq exchange and the NYSE. There were 71 high-ranked companies from the CANSLIM.net Leaders List that made new 52-week highs and appeared on the CANSLIM.net BreakOuts Page, up from the total of 67 on the prior session. However, there were only 5 gainers out of the 14 high-ranked leaders currently included on the Featured Stocks Page, a divergence by high-ranked leaders against the backdrop of a mostly positive market.
The markets welcomed Greece's vote to approve debt-reduction measures and a report that pending home sales climbed. Commodities rose as the dollar weakened on the news out of Europe. Meanwhile, crude oil has recouped almost all of its declines since last week's announcement of the release from strategic reserves.
Bank of America Corp (BAC +2.96%) rallied after settling a major lawsuit. MasterCard Inc (MA +11.3% and Visa Inc (V +15.0%) jumped on word that the Federal Reserve would set a cap on debit-card fees higher than the initial proposal.
The S&P 500 Index has yet to produce a solid follow-through day after completing Day 10, of its rally attempt, while last Tuesday's gain was labeled as "borderline" in the commentary (read here).
A follow-through day (FTD) from at least one of the major averages occurring between Day 4 and Day 7 of a new rally is considered the most ideal confirmation of a new rally attempt. To produce a solid FTD there should be a gain of at least +1.4% or more from at least one of the major averages, and the gain must come with higher volume and an expansion in leadership (new 52-week highs). Meanwhile, any deterioration under the Day 1 lows would officially end the nascent rally attempt and signal that the market's correction is continuing.
The Q2 2011 CANSLIM.net Webcast airs TONIGHT, Wednesday, June 29th at 8PM EST (UPGRADED MEMBERS ONLY - JUST BEFORE 8PM or afterward ON EMAND - CLICK HERE). Our July 2011 issue of CANSLIM.net News is due to be released soon!
PICTURED: The Wednesday's gain marked Day 3 of a new rally attempt for the Dow Jones Industrial Average. It rose above its recent highs with its 3rd consecutive gain on below average volume.
|
 Kenneth J. Gruneisen started out as a licensed stockbroker in August 1987, a couple of months prior to the historic stock market crash that took the Dow Jones Industrial Average down -22.6% in a single day. He has published daily fact-based fundamental and technical analysis on high-ranked stocks online for two decades. Through FACTBASEDINVESTING.COM, Kenneth provides educational articles, news, market commentary, and other information regarding proven investment systems that work in good times and bad.
Comments contained in the body of this report are technical opinions only and are not necessarily those of Gruneisen Growth Corp. The material herein has been obtained from sources believed to be reliable and accurate, however, its accuracy and completeness cannot be guaranteed. Our firm, employees, and customers may effect transactions, including transactions contrary to any recommendation herein, or have positions in the securities mentioned herein or options with respect thereto. Any recommendation contained in this report may not be suitable for all investors and it is not to be deemed an offer or solicitation on our part with respect to the purchase or sale of any securities. |
|
 |
Healthcare Index Hits New 2011 High
Kenneth J. Gruneisen - Passed the CAN SLIM® Master's Exam
The financial indexes finally showed some strength as the Broker/Dealer Index ($XBD +2.27%) and Bank Index ($BKX +2.38%) posted solid gains, both rising for a 3rd consecutive session Wednesday. Commodity-linked groups also had a positive bias as the Integrated Oil Index ($XOI +1.39%), Oil Services Index ($OSX +1.81%), and the Gold & Silver Index ($XAU +2.11%) rallied. The Internet Index ($IIX +1.06%) and Networking Index ($NWX +0.80%) led the tech sector while the Biotechnology Index ($BTK +0.35%) posted a smaller gain, but the Semiconductor Index ($SOX -0.09%) ended the session slightly in the red. Meanwhile, the Retail Index ($RLX +0.09%) and the Healthcare Index ($HMO +0.30%) quietly edged higher.
Charts courtesy www.stockcharts.com

PICTURED: The Healthcare Index ($HMO +0.30%) rallied to a new 2011 high today.
| Oil Services |
$OSX |
263.58 |
+4.68 |
+1.81% |
+7.53% |
| Healthcare |
$HMO |
2,451.78 |
+7.23 |
+0.30% |
+44.91% |
| Integrated Oil |
$XOI |
1,282.64 |
+17.57 |
+1.39% |
+5.73% |
| Semiconductor |
$SOX |
400.17 |
-0.35 |
-0.09% |
-2.83% |
| Networking |
$NWX |
299.66 |
+2.39 |
+0.80% |
+6.81% |
| Internet |
$IIX |
306.51 |
+3.22 |
+1.06% |
-0.40% |
| Broker/Dealer |
$XBD |
107.14 |
+2.38 |
+2.27% |
-11.83% |
| Retail |
$RLX |
527.08 |
+0.46 |
+0.09% |
+3.68% |
| Gold & Silver |
$XAU |
199.44 |
+4.12 |
+2.11% |
-11.98% |
| Bank |
$BKX |
48.18 |
+1.12 |
+2.38% |
-7.72% |
| Biotech |
$BTK |
1,462.73 |
+5.09 |
+0.35% |
+12.72% |
|
|
|
 |
Prior Highs Acted As Support Following Powerful Breakout
Kenneth J. Gruneisen - Passed the CAN SLIM® Master's Exam
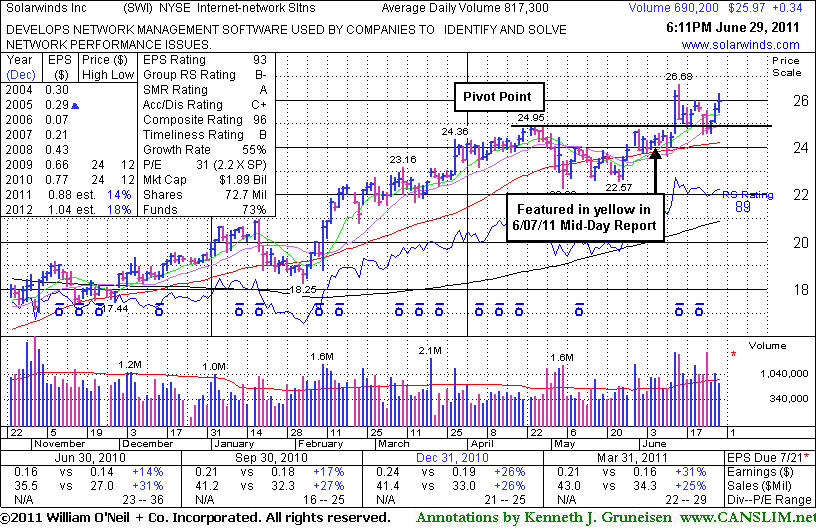
Solarwinds Inc (SWI +$0.34 or +1.33% to $25.97) finished at its 2nd best close today, rising toward its 52-week high. Prior resistance in the $24-25 area defines support, and a subsequent close under its old high close ($24.77 on 4/25/11) would raise concerns by negating its recent breakout. Typically about 40% of successful breakouts pull back and test support at prior highs before continuing higher. In its last appearance in this FSU section on 6/08/11 an annotated graph was included under the headline, "Favorable Set-Up In Weak Market Environment", it was perched -2.9% off its all-time high with no overhead supply to hinder its progress. Its color code was changed to yellow when it was featured in the 6/07/11 mid-day report (read here) after an orderly base with pivot point based upon its 52-week high plus 10 cents.
Disciplined investors know that to trigger a buy signal this high-ranked Internet - Network Solutions group leader needed a gain above its pivot point with sufficient volume. Its powerful breakout came on 6/14/11, and that big volume-driven gain also helped it clear the April 2010 high that was reached while it survived but failed to impress since it was dropped from the Featured Stocks list on 10/28/09. It reported earnings +31% on +25% sales revenues for the quarter ended March 31, 2011 versus the year ago period. Prior quarterly comparisons showed sales and earnings near the investment system guidelines. The number of top-rated funds owning its shares rose from 291 in June '10 to 313 in Mar '11, a reassuring sign concerning the I criteria of the fact-based investment system. One concern that overrides all of its bullish characteristics, however, is the M criteria. Most stocks have faltered along with the broader market in recent weeks, making this outlier an exception.
|
|
|
Color Codes Explained :
Y - Better candidates highlighted by our
staff of experts.
G - Previously featured
in past reports as yellow but may no longer be buyable under the
guidelines.
***Last / Change / Volume data in this table is the closing quote data***
Symbol/Exchange
Company Name
Industry Group |
PRICE |
CHANGE
(%Change) |
Day High |
Volume
(% DAV)
(% 50 day avg vol) |
52 Wk Hi
% From Hi |
Featured
Date |
Price
Featured |
Pivot Featured |
|
Max Buy |
CACC
-
NASDAQ
Credit Acceptance Corp
FINANCIAL SERVICES - Credit Services
|
$80.96
|
+0.25
0.31% |
$81.00
|
27,291
65.13% of 50 DAV
50 DAV is 41,900
|
$82.29
-1.62%
|
6/2/2011
|
$76.10
|
PP = $82.39
|
|
MB = $86.51
|
 Most Recent Note - 6/29/2011 5:37:12 PM
Y - This high-ranked leader in the Finance - Consumer Loans industry finished near the session high today with a gain on light volume for its best-ever close. Disciplined investors may watch for volume-driven gains above its recent highs to trigger a technical buy signal. Recent lows near $75 define important support to watch below initial support at its 50 DMA line.
>>> The latest Featured Stock Update with an annotated graph appeared on 6/27/2011. Click here.
View all notes |
Alert me of new notes |
CANSLIM.net Company Profile |
SEC |
Zacks Reports |
StockTalk |
News |
Chart |
Request a new note
C
A N
S L
I M


|
CMG
-
NYSE
Chipotle Mexican Grill
LEISURE - Restaurants
|
$304.46
|
-0.26
-0.09% |
$308.93
|
661,307
63.82% of 50 DAV
50 DAV is 1,036,200
|
$305.30
-0.28%
|
4/1/2011
|
$274.00
|
PP = $275.10
|
|
MB = $288.86
|
Most Recent Note - 6/29/2011 5:40:25 PM
G - Touched another new all-time high today then erased its gain. After 4 consecutive gains it is clear of all resistance due to overhead supply, but it has not formed a sound new base pattern. The upward trendline connecting its July 2010 and May 2011 lows defines an initial technical support level to watch.
>>> The latest Featured Stock Update with an annotated graph appeared on 6/15/2011. Click here.
View all notes |
Alert me of new notes |
CANSLIM.net Company Profile |
SEC |
Zacks Reports |
StockTalk |
News |
Chart |
Request a new note
C
A N
S L
I M
|
EZPW
-
NASDAQ
Ezcorp Inc Cl A
SPECIALTY RETAIL - Specialty Retail, Other
|
$35.35
|
+0.36
1.03% |
$35.74
|
510,900
139.78% of 50 DAV
50 DAV is 365,500
|
$35.65
-0.84%
|
6/13/2011
|
$31.18
|
PP = $33.41
|
|
MB = $35.08
|
Most Recent Note - 6/29/2011 1:09:13 PM
G - Getting more extended from its prior base today with a 5th consecutive volume-driven gain. Prior highs in the $33 area define support to watch on pullbacks.
>>> The latest Featured Stock Update with an annotated graph appeared on 6/13/2011. Click here.
View all notes |
Alert me of new notes |
CANSLIM.net Company Profile |
SEC |
Zacks Reports |
StockTalk |
News |
Chart |
Request a new note
C
A N
S L
I M
|
FCFS
-
NASDAQ
First Cash Financial Svs
SPECIALTY RETAIL - Specialty Retail, Other
|
$41.55
|
-0.10
-0.24% |
$41.91
|
91,897
47.64% of 50 DAV
50 DAV is 192,900
|
$42.36
-1.91%
|
5/31/2011
|
$42.00
|
PP = $40.23
|
|
MB = $42.24
|
Most Recent Note - 6/28/2011 3:32:45 PM
Y - Gapped up today, challenging its best-ever close. Color code is changed to yellow based on recent resilience after negating its prior breakout yet finding great support at its 50 DMA line. A new pivot point is not cited, however some may consider its latest consolidation a new "square box" type base pattern. Prior lows in the $37 area define support to watch.
>>> The latest Featured Stock Update with an annotated graph appeared on 6/22/2011. Click here.
View all notes |
Alert me of new notes |
CANSLIM.net Company Profile |
SEC |
Zacks Reports |
StockTalk |
News |
Chart |
Request a new note
C
A N
S L
I M
|
FOSL
-
NASDAQ
Fossil Inc
CONSUMER DURABLES - Recreational Goods, Other
|
$116.82
|
-0.91
-0.77% |
$118.56
|
1,056,884
145.42% of 50 DAV
50 DAV is 726,800
|
$117.80
-0.83%
|
2/1/2011
|
$73.30
|
PP = $74.44
|
|
MB = $78.16
|
Most Recent Note - 6/28/2011 3:34:50 PM
G - Hit another new all-time high today, getting extended while gradually wedging higher after 5 weeks of trading in a tight range forming a "late-stage" base. Recent lows near $99 define important support to watch just below its 50 DMA line.
>>> The latest Featured Stock Update with an annotated graph appeared on 6/28/2011. Click here.
View all notes |
Alert me of new notes |
CANSLIM.net Company Profile |
SEC |
Zacks Reports |
StockTalk |
News |
Chart |
Request a new note
C
A N
S L
I M
|
Symbol/Exchange
Company Name
Industry Group |
PRICE |
CHANGE
(%Change) |
Day High |
Volume
(% DAV)
(% 50 day avg vol) |
52 Wk Hi
% From Hi |
Featured
Date |
Price
Featured |
Pivot Featured |
|
Max Buy |
HS
-
NYSE
Healthspring Inc
HEALTH SERVICES - Health Care Plans
|
$46.26
|
-0.36
-0.77% |
$47.00
|
1,006,794
114.38% of 50 DAV
50 DAV is 880,200
|
$47.78
-3.18%
|
6/16/2011
|
$42.44
|
PP = $45.21
|
|
MB = $47.47
|
Most Recent Note - 6/29/2011 5:42:32 PM
Y - Holding its ground stubbornly, and prior resistance defines support after its recent streak of gains with above average volume to new all-time highs.
>>> The latest Featured Stock Update with an annotated graph appeared on 6/16/2011. Click here.
View all notes |
Alert me of new notes |
CANSLIM.net Company Profile |
SEC |
Zacks Reports |
StockTalk |
News |
Chart |
Request a new note
C
A N
S L
I M
|
INFA
-
NASDAQ
Informatica Corp
COMPUTER SOFTWARE and SERVICES - Business Software and Services
|
$58.29
|
-0.05
-0.09% |
$58.75
|
1,350,332
105.65% of 50 DAV
50 DAV is 1,278,100
|
$59.98
-2.82%
|
3/24/2011
|
$50.04
|
PP = $49.86
|
|
MB = $52.35
|
Most Recent Note - 6/28/2011 3:48:39 PM
G - Recently found support near its 50 DMA line, and it is quietly wedging up today, rising near its prior high close and 52-week high. This high-ranked Computer Software - Database firm faces no overhead supply to hinder its progress, but it has not formed a sound new base pattern.
>>> The latest Featured Stock Update with an annotated graph appeared on 6/17/2011. Click here.
View all notes |
Alert me of new notes |
CANSLIM.net Company Profile |
SEC |
Zacks Reports |
StockTalk |
News |
Chart |
Request a new note
C
A N
S L
I M
|
LULU
-
NASDAQ
Lululemon Athletica
MANUFACTURING - Textile Manufacturing
|
$111.68
|
-1.42
-1.26% |
$114.20
|
1,968,544
94.41% of 50 DAV
50 DAV is 2,085,200
|
$113.50
-1.60%
|
6/21/2011
|
$102.95
|
PP = $101.14
|
|
MB = $106.20
|
Most Recent Note - 6/28/2011 1:14:18 PM
G - Gapped up today, surging again to new 52-week and all-time highs, getting more extended from its latest base. Disciplined investors avoid chasing extended stocks. Prior highs define important chart support to watch.
>>> The latest Featured Stock Update with an annotated graph appeared on 6/21/2011. Click here.
View all notes |
Alert me of new notes |
CANSLIM.net Company Profile |
SEC |
Zacks Reports |
StockTalk |
News |
Chart |
Request a new note
C
A N
S L
I M
|
MWIV
-
NASDAQ
M W I Veterinary Supply
HEALTH SERVICES - Medical Instruments and; Supplies
|
$80.85
|
-0.86
-1.05% |
$82.21
|
33,182
40.56% of 50 DAV
50 DAV is 81,800
|
$86.99
-7.06%
|
11/4/2010
|
$61.79
|
PP = $59.60
|
|
MB = $62.58
|
Most Recent Note - 6/28/2011 3:52:35 PM
G - It may be forming a new base, however gains in recent weeks have lacked volume conviction and its 50 DMA line has been acting as a stubborn resistance level.
>>> The latest Featured Stock Update with an annotated graph appeared on 6/9/2011. Click here.
View all notes |
Alert me of new notes |
CANSLIM.net Company Profile |
SEC |
Zacks Reports |
StockTalk |
News |
Chart |
Request a new note
C
A N
S L
I M
|
OPNT
-
NASDAQ
Opnet Technologies
INTERNET - Internet Software and Services
|
$41.30
|
+0.54
1.32% |
$41.70
|
89,824
75.74% of 50 DAV
50 DAV is 118,600
|
$42.51
-2.85%
|
6/28/2011
|
$40.87
|
PP = $42.61
|
|
MB = $44.74
|
Most Recent Note - 6/28/2011 3:25:38 PM
Y - Rising near its best-ever close with today's 4th consecutive gain. Color code is changed to yellow and a new pivot point cited is based on its 52-week high plus ten cents. Disciplined investors watch for a confirming technical buy signal before taking action. Recent lows near $36 define important near-term chart support.
>>> The latest Featured Stock Update with an annotated graph appeared on 6/10/2011. Click here.
View all notes |
Alert me of new notes |
CANSLIM.net Company Profile |
SEC |
Zacks Reports |
StockTalk |
News |
Chart |
Request a new note
C
A N
S L
I M
|
Symbol/Exchange
Company Name
Industry Group |
PRICE |
CHANGE
(%Change) |
Day High |
Volume
(% DAV)
(% 50 day avg vol) |
52 Wk Hi
% From Hi |
Featured
Date |
Price
Featured |
Pivot Featured |
|
Max Buy |
OTEX
-
NASDAQ
Open Text Corp
INTERNET - Internet Software and Services
|
$62.70
|
+0.79
1.28% |
$63.35
|
279,567
88.64% of 50 DAV
50 DAV is 315,400
|
$67.08
-6.53%
|
6/1/2011
|
$65.86
|
PP = $67.18
|
|
MB = $70.54
|
Most Recent Note - 6/28/2011 3:26:59 PM
G - Gain today without great volume conviction has it challenging its 50 DMA line which has acted as resistance recently. It faces overhead supply up through $66 after trading at higher levels in recent months.
>>> The latest Featured Stock Update with an annotated graph appeared on 6/24/2011. Click here.
View all notes |
Alert me of new notes |
CANSLIM.net Company Profile |
SEC |
Zacks Reports |
StockTalk |
News |
Chart |
Request a new note
C
A N
S L
I M
|
SWI
-
NYSE
Solarwinds Inc
COMPUTER SOFTWARE and SERVICES - Application Software
|
$25.97
|
+0.34
1.33% |
$26.28
|
693,678
84.87% of 50 DAV
50 DAV is 817,300
|
$26.68
-2.66%
|
6/7/2011
|
$24.22
|
PP = $25.05
|
|
MB = $26.30
|
Most Recent Note - 6/28/2011 1:21:00 PM
Y - Rising back above its pivot point today with slightly higher volume behind its gain. Prior resistance in the $24-25 area defines support, and a subsequent close under its old high close ($24.77 on 4/25/11) would raise concerns by negating its recent breakout.
>>> The latest Featured Stock Update with an annotated graph appeared on 6/29/2011. Click here.
View all notes |
Alert me of new notes |
CANSLIM.net Company Profile |
SEC |
Zacks Reports |
StockTalk |
News |
Chart |
Request a new note
C
A N
S L
I M
|
ULTA
-
NASDAQ
Ulta Salon Cosm & Frag
SPECIALTY RETAIL - Specialty Retail, Other
|
$63.35
|
-0.84
-1.31% |
$64.89
|
610,729
73.45% of 50 DAV
50 DAV is 831,500
|
$64.85
-2.31%
|
1/6/2011
|
$36.12
|
PP = $37.34
|
|
MB = $39.21
|
Most Recent Note - 6/28/2011 3:54:16 PM
G - Perched at its all-time high today, getting more extended from any sound base pattern after 4 consecutive gains. It may produce more climactic gains, but disciplined investors avoid chasing extended stocks.
>>> The latest Featured Stock Update with an annotated graph appeared on 6/20/2011. Click here.
View all notes |
Alert me of new notes |
CANSLIM.net Company Profile |
SEC |
Zacks Reports |
StockTalk |
News |
Chart |
Request a new note
C
A N
S L
I M
|
ZAGG
-
NASDAQ
Zagg Inc
SPECIALTY RETAIL - Specialty Retail, Other
|
$13.75
|
-0.51
-3.58% |
$15.45
|
6,227,441
383.23% of 50 DAV
50 DAV is 1,625,000
|
$15.85
-13.25%
|
6/1/2011
|
$10.92
|
PP = $10.59
|
|
MB = $11.12
|
Most Recent Note - 6/29/2011 1:33:38 PM
G - Hovering near its all-time high after a spurt of volume-driven gains. It is extended from a sound base. Prior highs define initial support to watch on pullbacks.
>>> The latest Featured Stock Update with an annotated graph appeared on 6/23/2011. Click here.
View all notes |
Alert me of new notes |
CANSLIM.net Company Profile |
SEC |
Zacks Reports |
StockTalk |
News |
Chart |
Request a new note
C
A N
S L
I M
|
|
|
|
THESE ARE NOT BUY RECOMMENDATIONS!
Comments contained in the body of this report are technical
opinions only. The material herein has been obtained
from sources believed to be reliable and accurate, however,
its accuracy and completeness cannot be guaranteed.
This site is not an investment advisor, hence it does
not endorse or recommend any securities or other investments.
Any recommendation contained in this report may not
be suitable for all investors and it is not to be deemed
an offer or solicitation on our part with respect to
the purchase or sale of any securities. All trademarks,
service marks and trade names appearing in this report
are the property of their respective owners, and are
likewise used for identification purposes only.
This report is a service available
only to active Paid Premium Members.
You may opt-out of receiving report notifications
at any time. Questions or comments may be submitted
by writing to Premium Membership Services 665 S.E. 10 Street, Suite 201 Deerfield Beach, FL 33441-5634 or by calling 1-800-965-8307
or 954-785-1121.
|
|
|

