You are not logged in.
This means you
CAN ONLY VIEW reports that were published prior to Tuesday, April 15, 2025.
You
MUST UPGRADE YOUR MEMBERSHIP if you want to see any current reports.
AFTER MARKET UPDATE - TUESDAY, JUNE 28TH, 2011
Previous After Market Report Next After Market Report >>>
|
|
|
|
DOW |
+145.13 |
12,188.69 |
+1.21% |
|
Volume |
802,618,630 |
-4% |
|
Volume |
1,638,788,350 |
-2% |
|
NASDAQ |
+41.03 |
2,729.31 |
+1.53% |
|
Advancers |
2,333 |
74% |
|
Advancers |
1,877 |
70% |
|
S&P 500 |
+16.57 |
1,296.67 |
+1.29% |
|
Decliners |
704 |
22% |
|
Decliners |
703 |
26% |
|
Russell 2000 |
+12.17 |
817.31 |
+1.51% |
|
52 Wk Highs |
75 |
|
|
52 Wk Highs |
104 |
|
|
S&P 600 |
+6.37 |
438.03 |
+1.48% |
|
52 Wk Lows |
23 |
|
|
52 Wk Lows |
24 |
|
|
 |
Volume Lacking Behind Broad Rally Attempt
Kenneth J. Gruneisen - Passed the CAN SLIM® Master's Exam
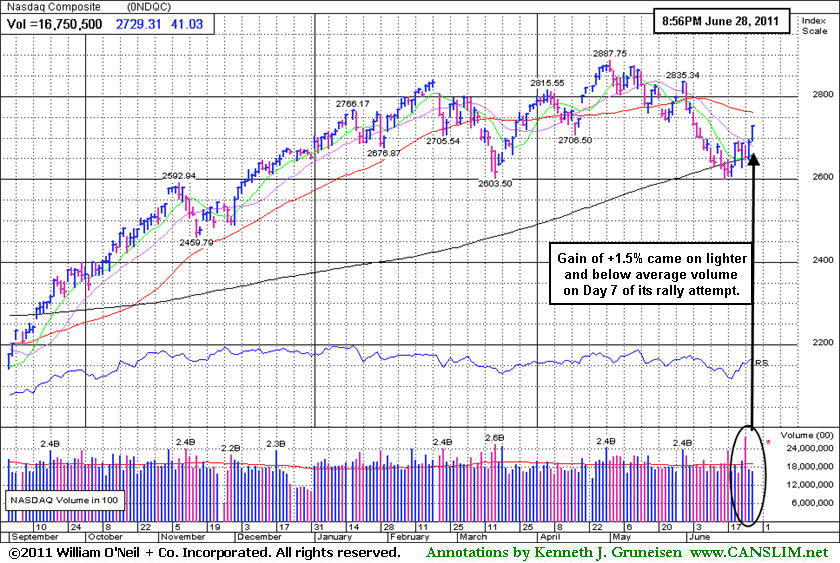
The S&P 500 Index gained 16 points to 1,296 to cap its best two-day gain since February as the major averages posted gains on Tuesday. However, the volume totals were reported lighter than the prior session and below average on both the Nasdaq exchange and the NYSE, revealing a lack of institutional buying demand. Advancers led decliners by more than 3-1 on the NYSE and by almost 3-1 on the Nasdaq exchange. New 52-week highs outnumbered new 52-week lows on both the Nasdaq exchange and the NYSE. There were 67 high-ranked companies from the CANSLIM.net Leaders List that made new 52-week highs and appeared on the CANSLIM.net BreakOuts Page, almost doubling the total of 34 on the prior session. All 14 of the high-ranked leaders currently included on the Featured Stocks Page posted gains.
A new report on home prices was well-received. Unadjusted prices rose month-over-month in April in thirteen of twenty U.S. cities surveyed. A separate report showed U.S. consumer confidence dropped to a 7-month low and was weaker than expected in June. Hopes remained high for a resolution of the Greek debt crisis even while protests broke out as lawmakers prepared for a vote on austerity measures expected after U.S. markets close.
Crude oil jumped more than $2 a barrel and gold rose back above $1,500 an ounce. Nike Inc (NKE +10.14%) rallied after profits and sales beat estimates in the latest quarter. Microsoft Corp (MSFT +2.3%) rose after the company introduced its new online corporate software.
Tuesday's gain marked Day 2 of a new rally attempt for the Dow Jones Industrial Average, and the blue chip index is +5.8% year-to-date (YTD). The S&P 500 Index is +3.1% YTD and recently found support at its longer-term 200-day moving average (DMA) line. The benchmark index has yet to produce a solid follow through day after completing Day 9, while last Tuesday's gain was labeled as "borderline" in the commentary (read here).
A follow-through day (FTD) from at least one of the major averages occurring between Day 4 and Day 7 of a new rally is considered the most ideal confirmation of a new rally attempt. To produce a solid FTD there should be a gain of at least +1.4% or more from at least one of the major averages, and the gain must come with higher volume and an expansion in leadership (new 52-week highs). Meanwhile, any deterioration under the Day 1 lows would officially end the nascent rally attempt and signal that the market's correction is continuing.
Upgraded members will have access to the upcoming Q2 2011 Webcast scheduled for Wednesday, June 29th at 8PM EST and the July 2011 issue of CANSLIM.net News to be released soon afterward.
PICTURED: The Nasdaq Composite Index is consolidating above its 200 DMA line and +2.9% YTD after having completed Day 7 of its current rally attempt. Its +1.5% gain today lacked the higher volume total needed to satisfy that important requirement for a follow-through day.
|
 Kenneth J. Gruneisen started out as a licensed stockbroker in August 1987, a couple of months prior to the historic stock market crash that took the Dow Jones Industrial Average down -22.6% in a single day. He has published daily fact-based fundamental and technical analysis on high-ranked stocks online for two decades. Through FACTBASEDINVESTING.COM, Kenneth provides educational articles, news, market commentary, and other information regarding proven investment systems that work in good times and bad.
Comments contained in the body of this report are technical opinions only and are not necessarily those of Gruneisen Growth Corp. The material herein has been obtained from sources believed to be reliable and accurate, however, its accuracy and completeness cannot be guaranteed. Our firm, employees, and customers may effect transactions, including transactions contrary to any recommendation herein, or have positions in the securities mentioned herein or options with respect thereto. Any recommendation contained in this report may not be suitable for all investors and it is not to be deemed an offer or solicitation on our part with respect to the purchase or sale of any securities. |
|
 |
Oil Services Index Rallies at 200-Day Moving Average
Kenneth J. Gruneisen - Passed the CAN SLIM® Master's Exam
Tuesday's session was led by energy-related shares as the Integrated Oil Index ($XOI +2.35%) and Oil Services Index ($OSX +3.77%) were standout gainers. The Retail Index ($RLX +1.58%) was a positive influence, and there unanimous gains in the tech sector as the Internet Index ($IIX +1.32%), Semiconductor Index ($SOX +1.33%), Networking Index ($NWX +1.79%), Biotechnology Index ($BTK +1.83%) collectively rose. Defensive groups also posted solid gains as the Healthcare Index ($HMO +2.58%) and Gold & Silver Index ($XAU +1.64%) rose. Financial shares were laggards, with the Bank Index ($BKX +0.21%) and Broker/Dealer Index ($XBD +0.29%) barely inching higher.
Charts courtesy www.stockcharts.com
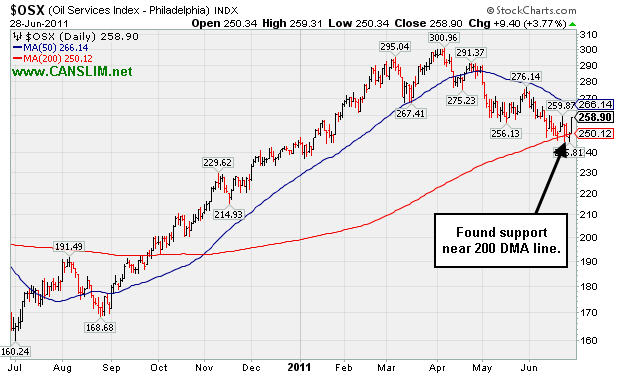
PICTURED: The Oil Services Index ($OSX +3.77%) found support near its 200-day moving average (DMA) line.
| Oil Services |
$OSX |
258.90 |
+9.40 |
+3.77% |
+5.62% |
| Healthcare |
$HMO |
2,444.55 |
+61.58 |
+2.58% |
+44.48% |
| Integrated Oil |
$XOI |
1,265.07 |
+29.06 |
+2.35% |
+4.28% |
| Semiconductor |
$SOX |
400.52 |
+5.25 |
+1.33% |
-2.74% |
| Networking |
$NWX |
297.27 |
+5.23 |
+1.79% |
+5.96% |
| Internet |
$IIX |
303.29 |
+3.96 |
+1.32% |
-1.44% |
| Broker/Dealer |
$XBD |
104.76 |
+0.31 |
+0.29% |
-13.79% |
| Retail |
$RLX |
526.62 |
+8.20 |
+1.58% |
+3.59% |
| Gold & Silver |
$XAU |
195.32 |
+3.15 |
+1.64% |
-13.80% |
| Bank |
$BKX |
47.06 |
+0.10 |
+0.21% |
-9.86% |
| Biotech |
$BTK |
1,457.64 |
+26.24 |
+1.83% |
+12.33% |
|
|
|
 |
Wedging Higher After Late Stage Base
Kenneth J. Gruneisen - Passed the CAN SLIM® Master's Exam
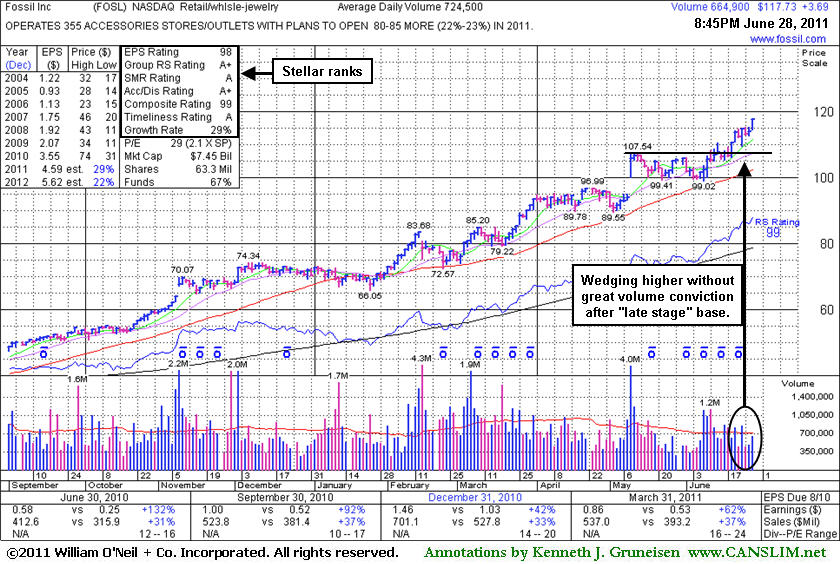
Fossil Inc (FOSL +$3.69 or +3.24% to $117.73) hit yet another new all-time high with today's gain on lighter than average volume. It has been wedging higher, getting extended after 5 weeks of trading in a very tight range forming a "late-stage" base. Recent lows near $99 define important support to watch just below its 50-day moving average (DMA) line. Since last shown in this FSU section on 6/07/11 with an annotated graph under the headline, "Volume Totals Cooling While Forming Short Flat Base", its gains have come on near average or lighter than average volume. Especially heavy volume conviction behind gains would be indicative of truly great institutional buying demand or accumulation.
The number of top-rated funds owning its shares rose from 512 in Mar '10 to 616 in Mar '11 a reassuring sign concerning the I criteria of the investment system. It reported strong earnings +62% on +37% sales revenues for the quarter ended March 31, 2011 versus the year ago period. Its strong earnings history satisfies the C and A criteria. Much earlier, FOSL appeared in this section near $44 on 8/11/10 under the headline, "Breakaway Gap On More Than Triple Average Volume". It was featured in yellow in the 8/10/10 mid-day report (read here) and has subsequently traded as much as +165% higher. It may go on to produce more climactic gains, however disciplined investors avoid chasing extended stocks. Success might be more likely with a fresh breakout, rather than one which has run up considerably after multiple bases.
|
|
|
Color Codes Explained :
Y - Better candidates highlighted by our
staff of experts.
G - Previously featured
in past reports as yellow but may no longer be buyable under the
guidelines.
***Last / Change / Volume data in this table is the closing quote data***
Symbol/Exchange
Company Name
Industry Group |
PRICE |
CHANGE
(%Change) |
Day High |
Volume
(% DAV)
(% 50 day avg vol) |
52 Wk Hi
% From Hi |
Featured
Date |
Price
Featured |
Pivot Featured |
|
Max Buy |
CACC
-
NASDAQ
Credit Acceptance Corp
FINANCIAL SERVICES - Credit Services
|
$80.71
|
+1.18
1.48% |
$80.71
|
33,172
78.98% of 50 DAV
50 DAV is 42,000
|
$82.29
-1.92%
|
6/2/2011
|
$76.10
|
PP = $82.39
|
|
MB = $86.51
|
Most Recent Note - 6/27/2011 5:53:43 PM
Y - This high-ranked leader in the Finance - Consumer Loans industry is consolidating just above its 50 DMA line. It faces little resistance due to overhead supply while now perched -3.4% off its 52-week high. Its color code was changed back to yellow after its recent resilience. Disciplined investors may watch for gains above its recent highs and wait for a follow-through day to confirm a new rally. Meanwhile, recent lows near $75 define important support to watch.
>>> The latest Featured Stock Update with an annotated graph appeared on 6/27/2011. Click here.
View all notes |
Alert me of new notes |
CANSLIM.net Company Profile |
SEC |
Zacks Reports |
StockTalk |
News |
Chart |
Request a new note
C
A N
S L
I M


|
CMG
-
NYSE
Chipotle Mexican Grill
LEISURE - Restaurants
|
$304.72
|
+3.26
1.08% |
$305.30
|
826,139
79.60% of 50 DAV
50 DAV is 1,037,900
|
$302.72
0.66%
|
4/1/2011
|
$274.00
|
PP = $275.10
|
|
MB = $288.86
|
Most Recent Note - 6/27/2011 5:52:30 PM
G - It hit another new all-time high today with a 3rd consecutive gain. It is clear of all resistance, but it has not formed a sound new base pattern. The upward trendline connecting its July 2010 and May 2011 lows defines an initial technical support level to watch.
>>> The latest Featured Stock Update with an annotated graph appeared on 6/15/2011. Click here.
View all notes |
Alert me of new notes |
CANSLIM.net Company Profile |
SEC |
Zacks Reports |
StockTalk |
News |
Chart |
Request a new note
C
A N
S L
I M
|
EZPW
-
NASDAQ
Ezcorp Inc Cl A
SPECIALTY RETAIL - Specialty Retail, Other
|
$34.99
|
+0.67
1.95% |
$35.65
|
927,683
263.70% of 50 DAV
50 DAV is 351,800
|
$34.44
1.60%
|
6/13/2011
|
$31.18
|
PP = $33.41
|
|
MB = $35.08
|
 Most Recent Note - 6/28/2011 12:50:55 PM
G - Gapped up today and rallied beyond its "max buy" level. Getting extended from its prior base with a 4th consecutive volume-driven gain, its color code was changed to green. Technically it broke out with nearly 3 times average volume on 6/27/11 following an analyst upgrade.
>>> The latest Featured Stock Update with an annotated graph appeared on 6/13/2011. Click here.
View all notes |
Alert me of new notes |
CANSLIM.net Company Profile |
SEC |
Zacks Reports |
StockTalk |
News |
Chart |
Request a new note
C
A N
S L
I M
|
FCFS
-
NASDAQ
First Cash Financial Svs
SPECIALTY RETAIL - Specialty Retail, Other
|
$41.65
|
+1.54
3.84% |
$41.70
|
227,437
118.95% of 50 DAV
50 DAV is 191,200
|
$42.36
-1.67%
|
5/31/2011
|
$42.00
|
PP = $40.23
|
|
MB = $42.24
|
Most Recent Note - 6/28/2011 3:32:45 PM
Y - Gapped up today, challenging its best-ever close. Color code is changed to yellow based on recent resilience after negating its prior breakout yet finding great support at its 50 DMA line. A new pivot point is not cited, however some may consider its latest consolidation a new "square box" type base pattern. Prior lows in the $37 area define support to watch.
>>> The latest Featured Stock Update with an annotated graph appeared on 6/22/2011. Click here.
View all notes |
Alert me of new notes |
CANSLIM.net Company Profile |
SEC |
Zacks Reports |
StockTalk |
News |
Chart |
Request a new note
C
A N
S L
I M
|
FOSL
-
NASDAQ
Fossil Inc
CONSUMER DURABLES - Recreational Goods, Other
|
$117.73
|
+3.69
3.24% |
$117.80
|
665,779
91.89% of 50 DAV
50 DAV is 724,500
|
$115.50
1.93%
|
2/1/2011
|
$73.30
|
PP = $74.44
|
|
MB = $78.16
|
Most Recent Note - 6/28/2011 3:34:50 PM
G - Hit another new all-time high today, getting extended while gradually wedging higher after 5 weeks of trading in a tight range forming a "late-stage" base. Recent lows near $99 define important support to watch just below its 50 DMA line.
>>> The latest Featured Stock Update with an annotated graph appeared on 6/28/2011. Click here.
View all notes |
Alert me of new notes |
CANSLIM.net Company Profile |
SEC |
Zacks Reports |
StockTalk |
News |
Chart |
Request a new note
C
A N
S L
I M
|
Symbol/Exchange
Company Name
Industry Group |
PRICE |
CHANGE
(%Change) |
Day High |
Volume
(% DAV)
(% 50 day avg vol) |
52 Wk Hi
% From Hi |
Featured
Date |
Price
Featured |
Pivot Featured |
|
Max Buy |
HS
-
NYSE
Healthspring Inc
HEALTH SERVICES - Health Care Plans
|
$46.62
|
+0.65
1.41% |
$47.09
|
735,771
83.77% of 50 DAV
50 DAV is 878,300
|
$47.78
-2.43%
|
6/16/2011
|
$42.44
|
PP = $45.21
|
|
MB = $47.47
|
Most Recent Note - 6/27/2011 5:56:31 PM
Y - Gain today with average volume for its second best close ever. Prior resistance defines support after its recent streak of gains with above average volume to new all-time highs.
>>> The latest Featured Stock Update with an annotated graph appeared on 6/16/2011. Click here.
View all notes |
Alert me of new notes |
CANSLIM.net Company Profile |
SEC |
Zacks Reports |
StockTalk |
News |
Chart |
Request a new note
C
A N
S L
I M
|
INFA
-
NASDAQ
Informatica Corp
COMPUTER SOFTWARE and SERVICES - Business Software and Services
|
$58.34
|
+0.89
1.55% |
$58.58
|
913,475
71.56% of 50 DAV
50 DAV is 1,276,500
|
$59.98
-2.73%
|
3/24/2011
|
$50.04
|
PP = $49.86
|
|
MB = $52.35
|
Most Recent Note - 6/28/2011 3:48:39 PM
G - Recently found support near its 50 DMA line, and it is quietly wedging up today, rising near its prior high close and 52-week high. This high-ranked Computer Software - Database firm faces no overhead supply to hinder its progress, but it has not formed a sound new base pattern.
>>> The latest Featured Stock Update with an annotated graph appeared on 6/17/2011. Click here.
View all notes |
Alert me of new notes |
CANSLIM.net Company Profile |
SEC |
Zacks Reports |
StockTalk |
News |
Chart |
Request a new note
C
A N
S L
I M
|
LULU
-
NASDAQ
Lululemon Athletica
MANUFACTURING - Textile Manufacturing
|
$113.10
|
+4.52
4.16% |
$113.50
|
2,420,093
117.09% of 50 DAV
50 DAV is 2,066,800
|
$108.99
3.77%
|
6/21/2011
|
$102.95
|
PP = $101.14
|
|
MB = $106.20
|
Most Recent Note - 6/28/2011 1:14:18 PM
G - Gapped up today, surging again to new 52-week and all-time highs, getting more extended from its latest base. Disciplined investors avoid chasing extended stocks. Prior highs define important chart support to watch.
>>> The latest Featured Stock Update with an annotated graph appeared on 6/21/2011. Click here.
View all notes |
Alert me of new notes |
CANSLIM.net Company Profile |
SEC |
Zacks Reports |
StockTalk |
News |
Chart |
Request a new note
C
A N
S L
I M
|
MWIV
-
NASDAQ
M W I Veterinary Supply
HEALTH SERVICES - Medical Instruments and; Supplies
|
$81.71
|
+1.31
1.63% |
$81.71
|
67,824
81.42% of 50 DAV
50 DAV is 83,300
|
$86.99
-6.07%
|
11/4/2010
|
$61.79
|
PP = $59.60
|
|
MB = $62.58
|
Most Recent Note - 6/28/2011 3:52:35 PM
G - It may be forming a new base, however gains in recent weeks have lacked volume conviction and its 50 DMA line has been acting as a stubborn resistance level.
>>> The latest Featured Stock Update with an annotated graph appeared on 6/9/2011. Click here.
View all notes |
Alert me of new notes |
CANSLIM.net Company Profile |
SEC |
Zacks Reports |
StockTalk |
News |
Chart |
Request a new note
C
A N
S L
I M
|
OPNT
-
NASDAQ
Opnet Technologies
INTERNET - Internet Software and Services
|
$40.76
|
+1.39
3.53% |
$40.91
|
170,139
142.73% of 50 DAV
50 DAV is 119,200
|
$42.51
-4.12%
|
6/28/2011
|
$40.87
|
PP = $42.61
|
|
MB = $44.74
|
Most Recent Note - 6/28/2011 3:25:38 PM
Y - Rising near its best-ever close with today's 4th consecutive gain. Color code is changed to yellow and a new pivot point cited is based on its 52-week high plus ten cents. Disciplined investors watch for a confirming technical buy signal before taking action. Recent lows near $36 define important near-term chart support.
>>> The latest Featured Stock Update with an annotated graph appeared on 6/10/2011. Click here.
View all notes |
Alert me of new notes |
CANSLIM.net Company Profile |
SEC |
Zacks Reports |
StockTalk |
News |
Chart |
Request a new note
C
A N
S L
I M
|
Symbol/Exchange
Company Name
Industry Group |
PRICE |
CHANGE
(%Change) |
Day High |
Volume
(% DAV)
(% 50 day avg vol) |
52 Wk Hi
% From Hi |
Featured
Date |
Price
Featured |
Pivot Featured |
|
Max Buy |
OTEX
-
NASDAQ
Open Text Corp
INTERNET - Internet Software and Services
|
$61.91
|
+1.26
2.08% |
$62.14
|
156,408
49.43% of 50 DAV
50 DAV is 316,400
|
$67.08
-7.71%
|
6/1/2011
|
$65.86
|
PP = $67.18
|
|
MB = $70.54
|
Most Recent Note - 6/28/2011 3:26:59 PM
G - Gain today without great volume conviction has it challenging its 50 DMA line which has acted as resistance recently. It faces overhead supply up through $66 after trading at higher levels in recent months.
>>> The latest Featured Stock Update with an annotated graph appeared on 6/24/2011. Click here.
View all notes |
Alert me of new notes |
CANSLIM.net Company Profile |
SEC |
Zacks Reports |
StockTalk |
News |
Chart |
Request a new note
C
A N
S L
I M
|
SWI
-
NYSE
Solarwinds Inc
COMPUTER SOFTWARE and SERVICES - Application Software
|
$25.63
|
+0.52
2.07% |
$25.88
|
1,120,092
139.28% of 50 DAV
50 DAV is 804,200
|
$26.68
-3.94%
|
6/7/2011
|
$24.22
|
PP = $25.05
|
|
MB = $26.30
|
Most Recent Note - 6/28/2011 1:21:00 PM
Y - Rising back above its pivot point today with slightly higher volume behind its gain. Prior resistance in the $24-25 area defines support, and a subsequent close under its old high close ($24.77 on 4/25/11) would raise concerns by negating its recent breakout.
>>> The latest Featured Stock Update with an annotated graph appeared on 6/8/2011. Click here.
View all notes |
Alert me of new notes |
CANSLIM.net Company Profile |
SEC |
Zacks Reports |
StockTalk |
News |
Chart |
Request a new note
C
A N
S L
I M
|
ULTA
-
NASDAQ
Ulta Salon Cosm & Frag
SPECIALTY RETAIL - Specialty Retail, Other
|
$64.19
|
+1.02
1.61% |
$64.53
|
745,916
90.13% of 50 DAV
50 DAV is 827,600
|
$64.85
-1.02%
|
1/6/2011
|
$36.12
|
PP = $37.34
|
|
MB = $39.21
|
Most Recent Note - 6/28/2011 3:54:16 PM
G - Perched at its all-time high today, getting more extended from any sound base pattern after 4 consecutive gains. It may produce more climactic gains, but disciplined investors avoid chasing extended stocks.
>>> The latest Featured Stock Update with an annotated graph appeared on 6/20/2011. Click here.
View all notes |
Alert me of new notes |
CANSLIM.net Company Profile |
SEC |
Zacks Reports |
StockTalk |
News |
Chart |
Request a new note
C
A N
S L
I M
|
ZAGG
-
NASDAQ
Zagg Inc
SPECIALTY RETAIL - Specialty Retail, Other
|
$14.26
|
+0.25
1.78% |
$14.40
|
1,463,997
90.81% of 50 DAV
50 DAV is 1,612,200
|
$15.85
-10.03%
|
6/1/2011
|
$10.92
|
PP = $10.59
|
|
MB = $11.12
|
Most Recent Note - 6/27/2011 6:01:57 PM
G - Finished in the upper half of its intra-day range today, consolidating from its all-time high after a spurt of volume-driven gains. It is extended from a sound base. Prior highs define initial support to watch on pullbacks. See the latest FSU analysis for more details and a new annotated graph.
>>> The latest Featured Stock Update with an annotated graph appeared on 6/23/2011. Click here.
View all notes |
Alert me of new notes |
CANSLIM.net Company Profile |
SEC |
Zacks Reports |
StockTalk |
News |
Chart |
Request a new note
C
A N
S L
I M
|
|
|
|
THESE ARE NOT BUY RECOMMENDATIONS!
Comments contained in the body of this report are technical
opinions only. The material herein has been obtained
from sources believed to be reliable and accurate, however,
its accuracy and completeness cannot be guaranteed.
This site is not an investment advisor, hence it does
not endorse or recommend any securities or other investments.
Any recommendation contained in this report may not
be suitable for all investors and it is not to be deemed
an offer or solicitation on our part with respect to
the purchase or sale of any securities. All trademarks,
service marks and trade names appearing in this report
are the property of their respective owners, and are
likewise used for identification purposes only.
This report is a service available
only to active Paid Premium Members.
You may opt-out of receiving report notifications
at any time. Questions or comments may be submitted
by writing to Premium Membership Services 665 S.E. 10 Street, Suite 201 Deerfield Beach, FL 33441-5634 or by calling 1-800-965-8307
or 954-785-1121.
|
|
|

