You are not logged in.
This means you
CAN ONLY VIEW reports that were published prior to Monday, April 14, 2025.
You
MUST UPGRADE YOUR MEMBERSHIP if you want to see any current reports.
AFTER MARKET UPDATE - TUESDAY, JUNE 29TH, 2010
Previous After Market Report Next After Market Report >>>
|
|
|
|
DOW |
-268.22 |
9,870.30 |
-2.65% |
|
Volume |
1,606,559,190 |
+73% |
|
Volume |
2,704,950,140 |
+52% |
|
NASDAQ |
-85.47 |
2,135.18 |
-3.85% |
|
Advancers |
247 |
8% |
|
Advancers |
292 |
10% |
|
S&P 500 |
-33.33 |
1,041.24 |
-3.10% |
|
Decliners |
2,866 |
90% |
|
Decliners |
2,411 |
86% |
|
Russell 2000 |
-25.58 |
615.96 |
-3.99% |
|
52 Wk Highs |
25 |
|
|
52 Wk Highs |
10 |
|
|
S&P 600 |
-12.36 |
331.10 |
-3.60% |
|
52 Wk Lows |
124 |
|
|
52 Wk Lows |
185 |
|
|
 |
Market Falls Into Correction Again After Damaging Distribution
Adam Sarhan, Contributing Writer,
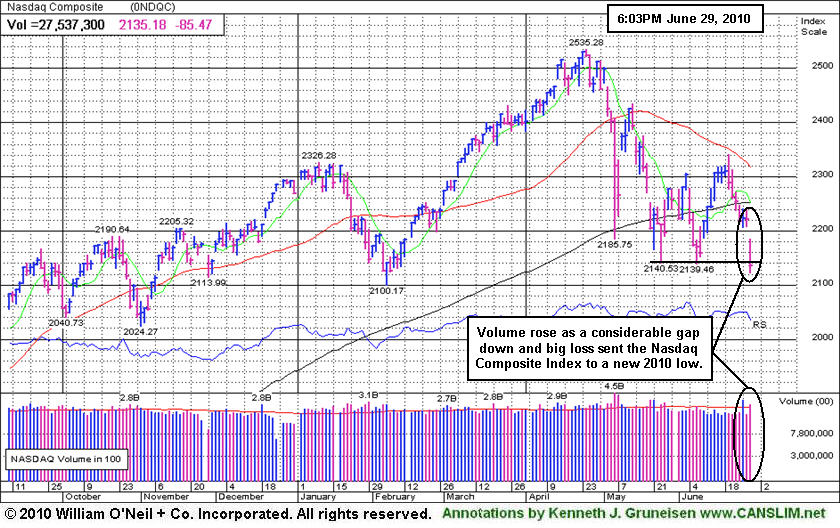
The major averages got smacked with big losses on Tuesday sending the benchmark S&P 500 Index below its 2010 low of 1,040 and the tech-heavy Nasdaq Composite Index below its prior low of 2,139. The widespread losses coupled with the ominous technical damage effectively ended the latest confirmed rally which began with the June 15, 2010 follow-through day (FTD). Tuesday's volume totals were reported higher on the NYSE and the Nasdaq exchange compared to Monday's levels, marking the latest damaging distribution day for the major averages. Decliners trumped advancers by worse than an 11-to-1 ratio on the NYSE and worse than an 8-to-1 ratio on the Nasdaq exchange. There were only 2 high-ranked companies from the CANSLIM.net Leaders List that made a new 52-week high and appeared on the CANSLIM.net BreakOuts Page, lower than the 15 issues that appeared on the prior session. Meanwhile, new 52-week lows substantially outnumbered new 52-week highs on the NYSE and the Nasdaq exchange. As leadership evaporated in recent sessions, in this commentary it was repeatedly noted - "Without a healthy crop of leaders hitting new highs it is hard for the major averages to sustain a rally."
Stocks fell hard across the globe after concern spread that China's robust economy was slowing. China's leading economic indicators fell and Citigroup (C -6.75%) said China’s exports will face "strong headwinds" in the second half of the year due to stricter measures from Beijing and the ongoing European debt crisis. This sent the Shanghai Composite Index diving -4.3% to 2,427.05 which was the largest single-day decline since May 17th and the lowest close in 14 months.
US stocks continued to fall after US consumer confidence tanked in June. The Conference Board’s index of consumer confidence fell to 52.9 from May's revised reading of 62.7. The dismal labor market was cited as a primary cause for the ongoing malaise. Elsewhere, the S&P/Case-Shiller index of home prices rose +3.8% from April 2009 which was the largest year-over-year gain since September 2006. The report also showed that home prices in 20 major US cities rose in April from a year earlier as sales got a boost from the now-expired tax credit.
Tuesday's steep sell off effectively ended the latest rally attempt and sent all the major average back down below or near their recent lows. Since the June 15, 2010 follow-through day (FTD), this column has steadily noted the importance of remaining very selective and disciplined because all of the major averages are still trading below their downward sloping 50-day moving average (DMA) lines. Their 50 DMA line may continue to act as stubborn resistance. Time will tell if June's earlier lows will be an area where prompt support may arrive. It was also recently noted that the NYSE Composite Index's 50 DMA line already sliced below the 200 DMA line, an event known by market technicians as a "death cross" which usually has bearish implications. Trade accordingly.
The Market Is Back In A Correction. Does Your Broker Know?
Inquire Today About Professional Money Management Services:
If your portfolio is greater than $100,000 and you need assistance, click here to get connected with portfolio managers using the fact-based investment system CANSLIM.net is built upon. ** Serious inquires only, please.
PICTURED: The volume rose as a considerable gap down and big loss sent the Nasdaq Composite Index to a new 2010 low.
|
|
|
 |
Financial Shares Suffered Big Declines Amid Widespread Weakness
Kenneth J. Gruneisen - Passed the CAN SLIM® Master's Exam
Financial shares were among the hardest hit as the Broker/Dealer Index ($XBD -4.80%) and Bank Index ($BKX -4.43%) led widespread losses on Tuesday, and the Retail Index ($RLX -3.76%) was also a negative influence on the major averages. The tech sector faced unanimous large losses in the Internet Index ($IIX -4.30%), Networking Index ($NWX -4.06%), Semiconductor Index ($SOX -4.64%), and Biotechnology Index ($BTK -3.50%). Defensive groups provided investors no safe haven from broad-based declines as the Healthcare Index ($HMO -3.55%) and Gold & Silver Index ($XAU -2.85%) slumped. Large losses also dragged on energy-related shares sending the Oil Services Index ($OSX -4.17%) and Integrated Oil Index ($XOI -2.81%) to big losses.
Charts courtesy www.stockcharts.com
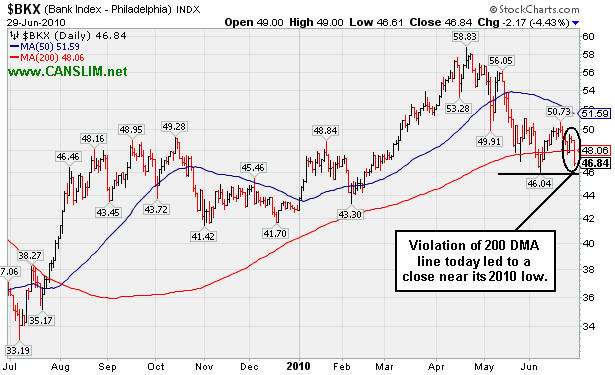
PICTURED 1: The Bank Index ($BKX -4.43%) violated its 200-day moving average line and closed near its 2010 low.
Charts courtesy www.stockcharts.com
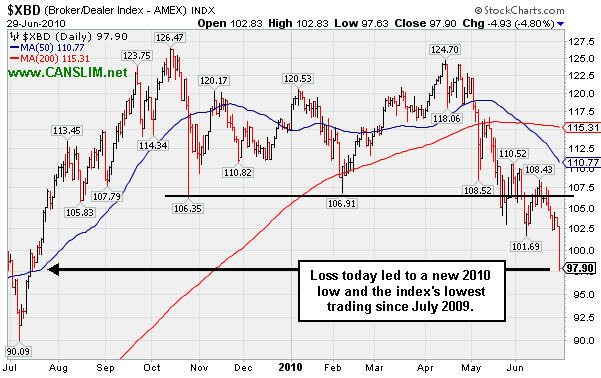
PICTURED 2: The Broker/Dealer Index ($XBD -4.80%) suffered a large loss that led to a new 2010 low and the index's lowest trading since July 2009.
| Oil Services |
$OSX |
164.10 |
-7.14 |
-4.17% |
-15.81% |
| Healthcare |
$HMO |
1,422.12 |
-52.33 |
-3.55% |
-3.45% |
| Integrated Oil |
$XOI |
890.15 |
-25.76 |
-2.81% |
-16.67% |
| Semiconductor |
$SOX |
337.67 |
-16.44 |
-4.64% |
-6.18% |
| Networking |
$NWX |
219.23 |
-9.27 |
-4.06% |
-5.12% |
| Internet |
$IIX |
223.40 |
-10.05 |
-4.30% |
-4.47% |
| Broker/Dealer |
$XBD |
97.90 |
-4.93 |
-4.80% |
-14.91% |
| Retail |
$RLX |
388.28 |
-15.19 |
-3.76% |
-5.56% |
| Gold & Silver |
$XAU |
177.90 |
-5.21 |
-2.85% |
+5.74% |
| Bank |
$BKX |
46.84 |
-2.17 |
-4.43% |
+9.67% |
| Biotech |
$BTK |
1,036.90 |
-37.62 |
-3.50% |
+10.06% |
|
|
|
 |
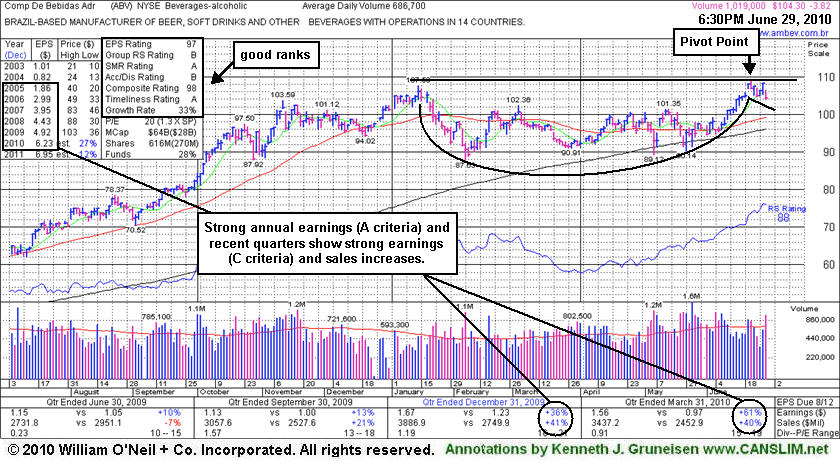
High-Ranked Beverage Firm From Brazil Perched Near High
Kenneth J. Gruneisen - Passed the CAN SLIM® Master's Exam
Often, when a leading stock is setting up to breakout of a solid base it is highlighted in CANSLIM.net's Mid-Day Breakouts Report. The most relevant factors are noted in the report which allows prudent CANSLIM oriented investors to place the issue in their watch list. After doing any necessary backup research, the investor is prepared to act if and when the stock triggers a technical buy signal (breaks above its pivot point on more than +50% average turnover). In the event the stock fails to trigger a technical buy signal and its price declines then it will simply be removed from the watch list.
Comp De Bebidas Adr (ABV -$3.82 or -3.53% to $104.30) is a Brazil-based beverage firm that gapped down today. It was featured in yellow in the mid-day report (read here) with a note while - "perched near all-time highs after building an orderly base pattern and finding impressive support near its 200 DMA line in recent months. It has a great annual earnings (A criteria) history and its recent quarterly earnings and sales revenues increases have shown acceleration. A gain above its pivot point with heavy volume still needed to confirm a proper new technical buy signal."
The stock ended with a loss on above average volume amid broader market (M criteria) weakness. By the end of the session the market again fell into a "correction", which means a new FTD is needed before any buying efforts may be justifiable under the investment system's guidelines.
|
|
|
Color Codes Explained :
Y - Better candidates highlighted by our
staff of experts.
G - Previously featured
in past reports as yellow but may no longer be buyable under the
guidelines.
***Last / Change / Volume data in this table is the closing quote data***
Symbol/Exchange
Company Name
Industry Group |
PRICE |
CHANGE
(%Change) |
Day High |
Volume
(% DAV)
(% 50 day avg vol) |
52 Wk Hi
% From Hi |
Featured
Date |
Price
Featured |
Pivot Featured |
|
Max Buy |
AAPL
-
NASDAQ
Apple Inc
COMPUTER HARDWARE - Personal Computers
|
$256.17
|
-12.13
-4.52% |
$264.39
|
40,398,045
141.55% of 50 DAV
50 DAV is 28,540,000
|
$279.01
-8.19%
|
6/17/2010
|
$270.95
|
PP = $272.56
|
|
MB = $286.19
|
 Most Recent Note - 6/29/2010 4:31:27 PM
G - Considerable loss on heavy volume today after gapping down. Color code is changed to green after violating its 50 DMA line and triggering a technical sell signal. It was featured in the 6/17/10 mid-day report (read here).
>>> The latest Featured Stock Update with an annotated graph appeared on 6/17/2010. Click here.
View all notes |
Alert me of new notes |
CANSLIM.net Company Profile |
SEC |
Zacks Reports |
StockTalk |
News |
Chart |
Request a new note
C
A N
S L
I M


|
ABV
-
NYSE
Comp De Bebidas Adr
FOOD and BEVERAGE - Beverages - Brewers
|
$104.30
|
-3.82
-3.53% |
$106.34
|
1,021,055
149.61% of 50 DAV
50 DAV is 682,500
|
$109.33
-4.60%
|
6/29/2010
|
$104.74
|
PP = $109.33
|
|
MB = $114.80
|
Most Recent Note - 6/29/2010 4:57:40 PM
Y - Brazil-based beverage firm gapped down today and ended with a loss on above average volume amid broader market (M criteria) weakness. By the end of the session the market again fell into a "correction", which means a new FTD is needed before any buying efforts may be justifiable under the investment system's guidelines. It was featured in yellow in the mid-day report (read here) with a note while - "perched near all-time highs after building an orderly base pattern and finding impressive support near its 200 DMA line in recent months. It has a great annual earnings (A criteria) history and its recent quarterly earnings and sales revenues increases have shown acceleration. A gain above its pivot point with heavy volume still needed to confirm a proper new technical buy signal."
There are no Featured Stock Updates™ available for this stock at this time. You may request one by clicking the Request a New Note link below
View all notes |
Alert me of new notes |
CANSLIM.net Company Profile |
SEC |
Zacks Reports |
StockTalk |
News |
Chart |
Request a new note
C
A N
S L
I M
|
APEI
-
NASDAQ
American Public Educ Inc
DIVERSIFIED SERVICES - Education and Training Services
|
$44.41
|
-0.96
-2.12% |
$44.87
|
139,635
80.02% of 50 DAV
50 DAV is 174,500
|
$48.95
-9.27%
|
6/7/2010
|
$46.60
|
PP = $46.29
|
|
MB = $48.60
|
Most Recent Note - 6/29/2010 4:34:46 PM
Y - Small gap down today as it slumped under its 50 DMA line, falling amid broad market (M criteria) weakness.
>>> The latest Featured Stock Update with an annotated graph appeared on 6/14/2010. Click here.
View all notes |
Alert me of new notes |
CANSLIM.net Company Profile |
SEC |
Zacks Reports |
StockTalk |
News |
Chart |
Request a new note
C
A N
S L
I M
|
BIDU
-
NASDAQ
Baidu Inc Ads
INTERNET - Internet Information Providers
|
$67.57
|
-6.87
-9.23% |
$72.88
|
24,133,014
159.90% of 50 DAV
50 DAV is 15,092,900
|
$82.29
-17.89%
|
1/13/2010
|
$43.13
|
PP = $42.68
|
|
MB = $44.81
|
Most Recent Note - 6/29/2010 3:42:31 PM
G - Considerable losses in it and most China-linked issues today, along with broad-based market weakness. A violation of its 50 DMA line on heavier volume has triggered a worrisome technical sell signal. Now it is trading near prior chart lows in the $66 area that define the next level of important chart support.
>>> The latest Featured Stock Update with an annotated graph appeared on 6/21/2010. Click here.
View all notes |
Alert me of new notes |
CANSLIM.net Company Profile |
SEC |
Zacks Reports |
StockTalk |
News |
Chart |
Request a new note
C
A N
S L
I M
|
BRLI
-
NASDAQ
Bio Reference Labs Inc
HEALTH SERVICES - Medical Laboratories and Researc
|
$22.13
|
-0.61
-2.68% |
$22.58
|
219,120
111.40% of 50 DAV
50 DAV is 196,700
|
$24.67
-10.31%
|
6/15/2010
|
$23.57
|
PP = $24.77
|
|
MB = $26.01
|
Most Recent Note - 6/29/2010 4:38:43 PM
G - Down today, slumping further below its 50 DMA line with higher volume amid broader market (M criteria) weakness. Color code is changed to green based on recent distributional action. Gains above its recent high ($23.87 on 6/18/10) would be an encouraging sign.
>>> The latest Featured Stock Update with an annotated graph appeared on 6/15/2010. Click here.
View all notes |
Alert me of new notes |
CANSLIM.net Company Profile |
SEC |
Zacks Reports |
StockTalk |
News |
Chart |
Request a new note
C
A N
S L
I M
|
Symbol/Exchange
Company Name
Industry Group |
PRICE |
CHANGE
(%Change) |
Day High |
Volume
(% DAV)
(% 50 day avg vol) |
52 Wk Hi
% From Hi |
Featured
Date |
Price
Featured |
Pivot Featured |
|
Max Buy |
CISG
-
NASDAQ
Cninsure Inc Ads
INSURANCE - Insurance Brokers
|
$26.07
|
-1.48
-5.37% |
$27.14
|
213,599
66.48% of 50 DAV
50 DAV is 321,300
|
$28.62
-8.91%
|
6/16/2010
|
$27.20
|
PP = $27.75
|
|
MB = $29.14
|
Most Recent Note - 6/29/2010 3:59:09 PM
G - Gapped down today amid widespread losses in China-based firms and weak action in the broader market. Color code is changed to green while sinking near its 50 DMA line. Featured in the 6/16/10 mid-day report (read here).
>>> The latest Featured Stock Update with an annotated graph appeared on 6/18/2010. Click here.
View all notes |
Alert me of new notes |
CANSLIM.net Company Profile |
SEC |
Zacks Reports |
StockTalk |
News |
Chart |
Request a new note
C
A N
S L
I M
|
CRM
-
NYSE
Salesforce.Com Inc
INTERNET - Internet Software and Services
|
$85.41
|
-5.87
-6.43% |
$89.71
|
3,800,265
137.44% of 50 DAV
50 DAV is 2,765,100
|
$97.94
-12.79%
|
6/2/2010
|
$88.44
|
PP = $89.60
|
|
MB = $94.08
|
Most Recent Note - 6/29/2010 3:49:49 PM
G - Considerable loss today with above average volume after gapping down. Violations of prior highs in the $89 area and its 50 DMA line triggered technical sell signals.
>>> The latest Featured Stock Update with an annotated graph appeared on 6/22/2010. Click here.
View all notes |
Alert me of new notes |
CANSLIM.net Company Profile |
SEC |
Zacks Reports |
StockTalk |
News |
Chart |
Request a new note
C
A N
S L
I M
|
DECK
-
NASDAQ
Deckers Outdoor Corp
CONSUMER NON-DURABLES - Textile - Apparel Footwear
|
$144.24
|
-9.06
-5.91% |
$150.73
|
650,651
120.96% of 50 DAV
50 DAV is 537,900
|
$168.52
-14.41%
|
6/11/2010
|
$157.34
|
PP = $158.57
|
|
MB = $166.50
|
Most Recent Note - 6/29/2010 3:52:48 PM
G - Considerable loss today with slightly above average volume, violating its 50 DMA line and raising concerns. Color code is changed to green based on weak action.
>>> The latest Featured Stock Update with an annotated graph appeared on 6/11/2010. Click here.
View all notes |
Alert me of new notes |
CANSLIM.net Company Profile |
SEC |
Zacks Reports |
StockTalk |
News |
Chart |
Request a new note
C
A N
S L
I M
|
FFIV
-
NASDAQ
F 5 Networks Inc
INTERNET - Internet Software and Services
|
$69.09
|
-4.42
-6.01% |
$71.97
|
1,852,521
109.04% of 50 DAV
50 DAV is 1,698,900
|
$77.10
-10.39%
|
6/16/2010
|
$74.50
|
PP = $74.10
|
|
MB = $77.81
|
Most Recent Note - 6/29/2010 3:54:57 PM
G - Gapped down today and violated its 50 DMA line with a considerable loss on near average volume, raising concerns. Color code is changed to green based on weak technical action.
>>> The latest Featured Stock Update with an annotated graph appeared on 6/16/2010. Click here.
View all notes |
Alert me of new notes |
CANSLIM.net Company Profile |
SEC |
Zacks Reports |
StockTalk |
News |
Chart |
Request a new note
C
A N
S L
I M
|
MELI
-
NASDAQ
Mercadolibre Inc
INTERNET - Internet Software and; Services
|
$54.12
|
-3.10
-5.42% |
$56.01
|
977,602
112.06% of 50 DAV
50 DAV is 872,400
|
$62.14
-12.91%
|
5/13/2010
|
$54.21
|
PP = $55.85
|
|
MB = $58.64
|
Most Recent Note - 6/29/2010 3:56:37 PM
G - Gapped down today, again testing support near prior chart highs in the $55 area and approaching its 50 DMA line.
>>> The latest Featured Stock Update with an annotated graph appeared on 6/10/2010. Click here.
View all notes |
Alert me of new notes |
CANSLIM.net Company Profile |
SEC |
Zacks Reports |
StockTalk |
News |
Chart |
Request a new note
C
A N
S L
I M
|
Symbol/Exchange
Company Name
Industry Group |
PRICE |
CHANGE
(%Change) |
Day High |
Volume
(% DAV)
(% 50 day avg vol) |
52 Wk Hi
% From Hi |
Featured
Date |
Price
Featured |
Pivot Featured |
|
Max Buy |
NEM
-
NYSE
Newmont Mining Corp
METALS and MINING - Gold
|
$61.15
|
-0.31
-0.50% |
$62.01
|
11,591,440
120.04% of 50 DAV
50 DAV is 9,656,600
|
$62.62
-2.35%
|
6/22/2010
|
$59.60
|
PP = $59.67
|
|
MB = $62.65
|
Most Recent Note - 6/29/2010 1:15:34 PM
Y - Perched near its 52-week high. Volume behind recent gains has been below the minimum guidelines (since its mid-May breakout faltered). The America-based mining firm has some reassuring leadership (L criteria) from other Mining - Gold/Silver/Gems industry firms as a favorable backdrop. No overhead supply remains to act as resistance. Featured in a 6/22/10 Stock Bulletin with annotated graph (read here).
>>> The latest Featured Stock Update with an annotated graph appeared on 6/22/2010. Click here.
View all notes |
Alert me of new notes |
CANSLIM.net Company Profile |
SEC |
Zacks Reports |
StockTalk |
News |
Chart |
Request a new note
C
A N
S L
I M
|
ROVI
-
NASDAQ
Rovi Corp
COMPUTER SOFTWARE andamp; SERVICES - Security Software andamp; Services
|
$37.83
|
-0.65
-1.69% |
$38.29
|
1,185,550
86.53% of 50 DAV
50 DAV is 1,370,100
|
$40.06
-5.57%
|
6/3/2010
|
$38.70
|
PP = $40.16
|
|
MB = $42.17
|
Most Recent Note - 6/29/2010 4:41:56 PM
Y - Consolidating near its 50 DMA line amid broader market (M criteria) weakness, closing only -5.6 off its 52-week high. Color code was changed to yellow again, while disciplined investors will await a new FTD and a convincing gain above its pivot point with heavy volume to trigger a new buy signal. Prior lows near $35 area define support above its 200 DMA line.
>>> The latest Featured Stock Update with an annotated graph appeared on 6/28/2010. Click here.
View all notes |
Alert me of new notes |
CANSLIM.net Company Profile |
SEC |
Zacks Reports |
StockTalk |
News |
Chart |
Request a new note
C
A N
S L
I M
|
SUMR
-
NASDAQ
Summer Infant Inc
CONSUMER NON-DURABLES - Personal Products
|
$6.47
|
-0.33
-4.85% |
$6.71
|
58,651
55.96% of 50 DAV
50 DAV is 104,800
|
$8.42
-23.16%
|
5/4/2010
|
$6.85
|
PP = $7.09
|
|
MB = $7.44
|
Most Recent Note - 6/29/2010 4:44:13 PM
G - Gapped down today, slumping near recent chart lows in the $6.25 area that define important support to watch now. Gains back above its 50 DMA line and above recent chart highs near $7.40 would be an encouraging technical improvement.
>>> The latest Featured Stock Update with an annotated graph appeared on 6/24/2010. Click here.
View all notes |
Alert me of new notes |
CANSLIM.net Company Profile |
SEC |
Zacks Reports |
StockTalk |
News |
Chart |
Request a new note
C
A N
S L
I M
|
THOR
-
NASDAQ
Thoratec Corp
HEALTH SERVICES - Medical Instruments and Supplies
|
$43.54
|
-1.22
-2.73% |
$44.41
|
1,254,880
108.98% of 50 DAV
50 DAV is 1,151,500
|
$47.93
-9.16%
|
6/3/2010
|
$44.38
|
PP = $45.35
|
|
MB = $47.62
|
Most Recent Note - 6/29/2010 4:47:45 PM
Y- Gapped down today and fell amid broader market (M criteria) weakness. Its slump below its pivot point raised concerns last week and now it is consolidating above its 50 DMA line which is an important support level to watch.
>>> The latest Featured Stock Update with an annotated graph appeared on 6/23/2010. Click here.
View all notes |
Alert me of new notes |
CANSLIM.net Company Profile |
SEC |
Zacks Reports |
StockTalk |
News |
Chart |
Request a new note
C
A N
S L
I M
|
ULTA
-
NASDAQ
Ulta Salon Cosm & Frag
SPECIALTY RETAIL - Specialty Retail, Other
|
$24.04
|
-1.78
-6.89% |
$25.26
|
669,763
103.02% of 50 DAV
50 DAV is 650,100
|
$26.75
-10.13%
|
5/28/2010
|
$25.58
|
PP = $25.86
|
|
MB = $27.15
|
Most Recent Note - 6/29/2010 3:44:05 PM
Y - Considerable loss today with volume near average while falling near its 50 DMA line again.
>>> The latest Featured Stock Update with an annotated graph appeared on 6/25/2010. Click here.
View all notes |
Alert me of new notes |
CANSLIM.net Company Profile |
SEC |
Zacks Reports |
StockTalk |
News |
Chart |
Request a new note
C
A N
S L
I M
|
Symbol/Exchange
Company Name
Industry Group |
PRICE |
CHANGE
(%Change) |
Day High |
Volume
(% DAV)
(% 50 day avg vol) |
52 Wk Hi
% From Hi |
Featured
Date |
Price
Featured |
Pivot Featured |
|
Max Buy |
|
|
|
THESE ARE NOT BUY RECOMMENDATIONS!
Comments contained in the body of this report are technical
opinions only. The material herein has been obtained
from sources believed to be reliable and accurate, however,
its accuracy and completeness cannot be guaranteed.
This site is not an investment advisor, hence it does
not endorse or recommend any securities or other investments.
Any recommendation contained in this report may not
be suitable for all investors and it is not to be deemed
an offer or solicitation on our part with respect to
the purchase or sale of any securities. All trademarks,
service marks and trade names appearing in this report
are the property of their respective owners, and are
likewise used for identification purposes only.
This report is a service available
only to active Paid Premium Members.
You may opt-out of receiving report notifications
at any time. Questions or comments may be submitted
by writing to Premium Membership Services 665 S.E. 10 Street, Suite 201 Deerfield Beach, FL 33441-5634 or by calling 1-800-965-8307
or 954-785-1121.
|
|
|


