You are not logged in.
This means you
CAN ONLY VIEW reports that were published prior to Monday, April 14, 2025.
You
MUST UPGRADE YOUR MEMBERSHIP if you want to see any current reports.
AFTER MARKET UPDATE - MONDAY, JUNE 27TH, 2011
Previous After Market Report Next After Market Report >>>
|
|
|
|
DOW |
+108.98 |
12,043.56 |
+0.91% |
|
Volume |
834,315,920 |
-52% |
|
Volume |
1,676,725,360 |
-40% |
|
NASDAQ |
+35.39 |
2,688.28 |
+1.33% |
|
Advancers |
2,055 |
66% |
|
Advancers |
1,719 |
63% |
|
S&P 500 |
+11.65 |
1,280.10 |
+0.92% |
|
Decliners |
980 |
31% |
|
Decliners |
915 |
34% |
|
Russell 2000 |
+7.35 |
805.14 |
+0.92% |
|
52 Wk Highs |
52 |
|
|
52 Wk Highs |
64 |
|
|
S&P 600 |
+4.12 |
431.66 |
+0.96% |
|
52 Wk Lows |
39 |
|
|
52 Wk Lows |
51 |
|
|
 |
Major Averages Rise With Lighter Volume
Kenneth J. Gruneisen - Passed the CAN SLIM® Master's Exam
The major averages posted gains on Monday while the volume totals were reported lighter on the Nasdaq exchange and the NYSE. Advancers led decliners by 2-1 on the NYSE and by 11-6 on the Nasdaq. New 52-week highs outnumbered new 52-week lows on both the Nasdaq exchange and the NYSE. There were 34 high-ranked companies from the CANSLIM.net Leaders List that made new 52-week highs and appeared on the CANSLIM.net BreakOuts Page, up from the total of 28 on the prior session. There were 13 gainers out of the 14 of the high-ranked leaders currently included on the Featured Stocks Page.
A report on May personal spending was weaker than expected. Spending fell to the lowest level since June 2010. The report suggested the Fed may maintain an accommodative monetary policy for an extended period. Gains in bank and tech stocks were a welcome sign on Wall Street following three days of losses.
New capital rules on banks were not as harsh as feared, and Europe appeared to move away from debt crisis as French banks agreed to accept slower repayment of Greek debt. Bank of America Corp (BAC +3.14%) benefited from an analyst call that the stock was undervalued.
Microsoft Corp (MSFT +3.70%) and Take Two Interactive Software Inc (TTWO +2.3%) rose after the Supreme Court struck down a law prohibiting the sale of violent video games to minors. Stanley Black & Decker Inc (SWK +0.3%) rose after it offered to buy a Swedish firm to expand in the market for electronic security systems.
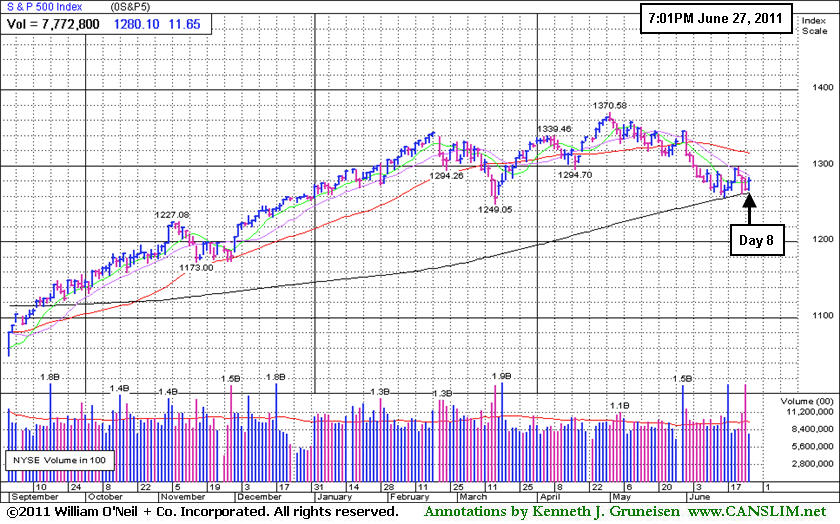
Monday's gain marked Day 1 of a new rally attempt for the Dow Jones Industrial Average, and the blue chip index is +4.0% year-to-date (YTD). The Nasdaq Composite Index is also consolidating above its 200 DMA line and just +1.3% YTD after having completed Day 6 of its current rally attempt.
A follow-through day (FTD) from at least one of the major averages occurring between Day 4 and Day 7 of a new rally is considered the most ideal confirmation of a new rally attempt. To produce a solid FTD there should be a gain of at least +1.4% or more from at least one of the major averages, and the gain must come with higher volume and an expansion in leadership (new 52-week highs). Meanwhile, any deterioration under the Day 1 lows would officially end the nascent rally attempt and signal that the market's correction is continuing.
Upgraded members will have access to the upcoming Q2 2011 Webcast scheduled for Wednesday, June 29th at 8PM EST and the July 2011 issue of CANSLIM.net News to be released soon afterward.
PICTURED: The benchmark S&P 500 Index is holding on to a +1.78% gain YTD, now consolidating above its 200-day moving average (DMA) line after having completed Day 8 of its current rally attempt.
|
 Kenneth J. Gruneisen started out as a licensed stockbroker in August 1987, a couple of months prior to the historic stock market crash that took the Dow Jones Industrial Average down -22.6% in a single day. He has published daily fact-based fundamental and technical analysis on high-ranked stocks online for two decades. Through FACTBASEDINVESTING.COM, Kenneth provides educational articles, news, market commentary, and other information regarding proven investment systems that work in good times and bad.
Comments contained in the body of this report are technical opinions only and are not necessarily those of Gruneisen Growth Corp. The material herein has been obtained from sources believed to be reliable and accurate, however, its accuracy and completeness cannot be guaranteed. Our firm, employees, and customers may effect transactions, including transactions contrary to any recommendation herein, or have positions in the securities mentioned herein or options with respect thereto. Any recommendation contained in this report may not be suitable for all investors and it is not to be deemed an offer or solicitation on our part with respect to the purchase or sale of any securities. |
|
 |
Financial, Retail, Tech Groups Post Quiet Gains
Kenneth J. Gruneisen - Passed the CAN SLIM® Master's Exam
Modest gains from the Broker/Dealer Index ($XBD +0.45%) and Bank Index ($BKX +1.38%) coupled with a gain from the Retail Index ($RLX +1.03%) and strength in the tech sector gave the major averages some solid underpinnings on Monday. The Semiconductor Index ($SOX +0.71%), Internet Index ($IIX +1.26%), Biotechnology Index ($BTK +1.30%), and Networking Index ($NWX +1.3%) finished unanimously higher. The Gold & Silver Index ($XAU +0.15%) inched higher, energy-related gains helped give the Oil Services Index ($OSX +0.31%) and Integrated Oil Index ($XOI +0.64%) a modest lift, and the Healthcare Index ($HMO +1.40%) posted a solid gain.
Charts courtesy www.stockcharts.com
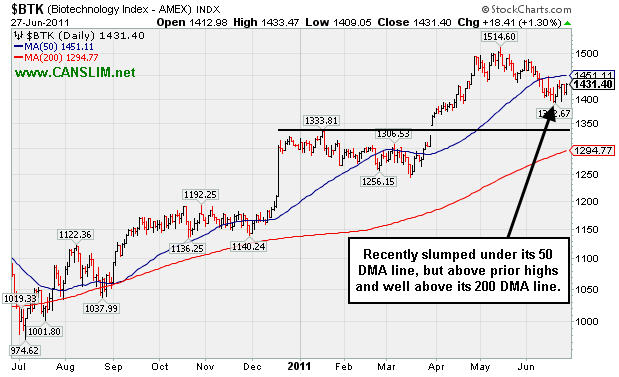
PICTURED: The Biotechnology Index ($BTK +1.30%) recently slumped under its 50-day moving average (DMA) line, but remains well above its prior highs and 200 DMA line.
| Oil Services |
$OSX |
249.50 |
+0.77 |
+0.31% |
+1.79% |
| Healthcare |
$HMO |
2,382.97 |
+32.93 |
+1.40% |
+40.84% |
| Integrated Oil |
$XOI |
1,236.01 |
+7.84 |
+0.64% |
+1.88% |
| Semiconductor |
$SOX |
395.27 |
+2.77 |
+0.71% |
-4.02% |
| Networking |
$NWX |
292.04 |
+4.69 |
+1.63% |
+4.09% |
| Internet |
$IIX |
299.33 |
+3.72 |
+1.26% |
-2.73% |
| Broker/Dealer |
$XBD |
104.45 |
+0.47 |
+0.45% |
-14.04% |
| Retail |
$RLX |
518.42 |
+5.30 |
+1.03% |
+1.97% |
| Gold & Silver |
$XAU |
192.17 |
+0.28 |
+0.15% |
-15.19% |
| Bank |
$BKX |
46.96 |
+0.64 |
+1.38% |
-10.06% |
| Biotech |
$BTK |
1,431.40 |
+18.41 |
+1.30% |
+10.31% |
|
|
|
 |
Thinly Traded Finance Firm Faces Little Resistance
Kenneth J. Gruneisen - Passed the CAN SLIM® Master's Exam
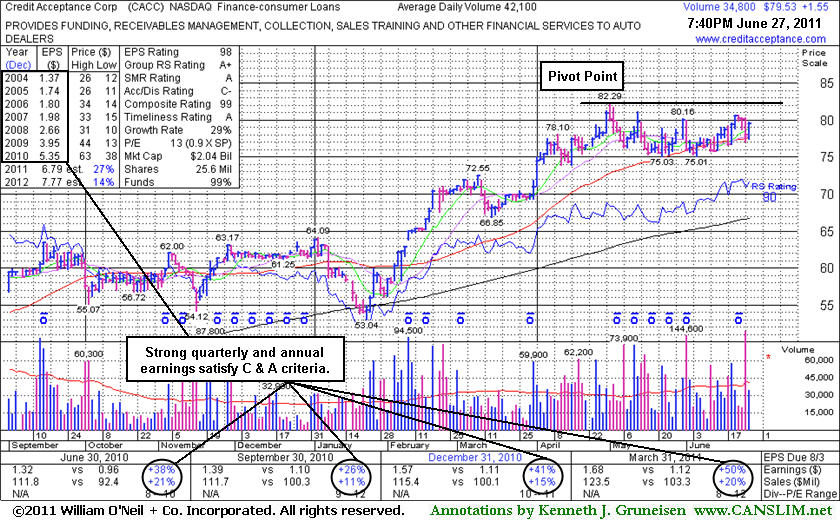
Credit Acceptance Corp (CACC +$1.55 or +1.99% to $79.53) is a high-ranked leader in the Finance - Consumer Loans industry consolidating just above its 50-day moving average (DMA) line. It faces little resistance due to overhead supply while now perched -3.4% off its 52-week high. Its color code was changed back to yellow after its recent resilience. Disciplined investors may watch for gains above its recent highs and wait for a follow-through day from at least one of the major averages to confirm a new rally (M criteria). Meanwhile, recent lows near $75 define important support to watch just below initial support at its 50 DMA line. It has endured distributional pressure since its last appearance in this FSU section on 06/06/11 with an annotated weekly graph under the headline, "Increasing Ownership By Top-Rated Funds is a Plus". It was featured in yellow in the 6/02/11 mid-day report with an annotated daily graph (read here) with a pivot point based on its 52-week high plus 10 cents.
It is thinly traded (42,100 shares average daily volume) and has a small supply (S criteria) of shares outstanding. Its strong earnings history satisfies the C and A criteria. The number of top-rated funds owning its shares rose from 181 in Jun '10 to 219 in Mar '11, a reassuring sign concerning the I criteria of the fact-based system. The M criteria currently argues against new buying efforts until a new confirmed rally with follow-through day (FTD). Meanwhile, a subsequent gain above its pivot point with heavy volume, coupled with a new FTD, could trigger a technical buy signal.
|
|
|
Color Codes Explained :
Y - Better candidates highlighted by our
staff of experts.
G - Previously featured
in past reports as yellow but may no longer be buyable under the
guidelines.
***Last / Change / Volume data in this table is the closing quote data***
Symbol/Exchange
Company Name
Industry Group |
PRICE |
CHANGE
(%Change) |
Day High |
Volume
(% DAV)
(% 50 day avg vol) |
52 Wk Hi
% From Hi |
Featured
Date |
Price
Featured |
Pivot Featured |
|
Max Buy |
CACC
-
NASDAQ
Credit Acceptance Corp
FINANCIAL SERVICES - Credit Services
|
$79.53
|
+1.55
1.99% |
$79.77
|
38,779
92.11% of 50 DAV
50 DAV is 42,100
|
$82.29
-3.35%
|
6/2/2011
|
$76.10
|
PP = $82.39
|
|
MB = $86.51
|
 Most Recent Note - 6/27/2011 5:53:43 PM
Y - This high-ranked leader in the Finance - Consumer Loans industry is consolidating just above its 50 DMA line. It faces little resistance due to overhead supply while now perched -3.4% off its 52-week high. Its color code was changed back to yellow after its recent resilience. Disciplined investors may watch for gains above its recent highs and wait for a follow-through day to confirm a new rally. Meanwhile, recent lows near $75 define important support to watch.
>>> The latest Featured Stock Update with an annotated graph appeared on 6/27/2011. Click here.
View all notes |
Alert me of new notes |
CANSLIM.net Company Profile |
SEC |
Zacks Reports |
StockTalk |
News |
Chart |
Request a new note
C
A N
S L
I M


|
CMG
-
NYSE
Chipotle Mexican Grill
LEISURE - Restaurants
|
$301.46
|
+8.21
2.80% |
$302.72
|
1,177,535
113.99% of 50 DAV
50 DAV is 1,033,000
|
$297.00
1.50%
|
4/1/2011
|
$274.00
|
PP = $275.10
|
|
MB = $288.86
|
Most Recent Note - 6/27/2011 5:52:30 PM
G - It hit another new all-time high today with a 3rd consecutive gain. It is clear of all resistance, but it has not formed a sound new base pattern. The upward trendline connecting its July 2010 and May 2011 lows defines an initial technical support level to watch.
>>> The latest Featured Stock Update with an annotated graph appeared on 6/15/2011. Click here.
View all notes |
Alert me of new notes |
CANSLIM.net Company Profile |
SEC |
Zacks Reports |
StockTalk |
News |
Chart |
Request a new note
C
A N
S L
I M
|
EZPW
-
NASDAQ
Ezcorp Inc Cl A
SPECIALTY RETAIL - Specialty Retail, Other
|
$34.32
|
+2.25
7.02% |
$34.44
|
968,986
287.19% of 50 DAV
50 DAV is 337,400
|
$33.31
3.03%
|
6/13/2011
|
$31.18
|
PP = $33.41
|
|
MB = $35.08
|
Most Recent Note - 6/27/2011 11:53:54 AM
Y - Gapped up today following an analyst upgrade, breaking out to new all-time highs. Found support near its 50 DMA line and above its recent lows that define important near-term chart support in the $29 area.
>>> The latest Featured Stock Update with an annotated graph appeared on 6/13/2011. Click here.
View all notes |
Alert me of new notes |
CANSLIM.net Company Profile |
SEC |
Zacks Reports |
StockTalk |
News |
Chart |
Request a new note
C
A N
S L
I M
|
FCFS
-
NASDAQ
First Cash Financial Svs
SPECIALTY RETAIL - Specialty Retail, Other
|
$40.11
|
+1.20
3.08% |
$40.22
|
149,739
78.44% of 50 DAV
50 DAV is 190,900
|
$42.36
-5.31%
|
5/31/2011
|
$42.00
|
PP = $40.23
|
|
MB = $42.24
|
Most Recent Note - 6/27/2011 5:51:04 PM
G - Up on lighter than average volume today for its second best close ever. Its 50 DMA line and prior lows in the $37 area define support to watch.
>>> The latest Featured Stock Update with an annotated graph appeared on 6/22/2011. Click here.
View all notes |
Alert me of new notes |
CANSLIM.net Company Profile |
SEC |
Zacks Reports |
StockTalk |
News |
Chart |
Request a new note
C
A N
S L
I M
|
FOSL
-
NASDAQ
Fossil Inc
CONSUMER DURABLES - Recreational Goods, Other
|
$114.04
|
+0.63
0.56% |
$115.30
|
492,439
67.25% of 50 DAV
50 DAV is 732,300
|
$115.50
-1.26%
|
2/1/2011
|
$73.30
|
PP = $74.44
|
|
MB = $78.16
|
Most Recent Note - 6/23/2011 5:06:21 PM
G - Hit another new all-time high after a positive reversal today. Inching higher after 5 weeks of trading in a very tight range forming a "late-stage" base. Recent lows near $99 define important support to watch just below its 50 DMA line.
>>> The latest Featured Stock Update with an annotated graph appeared on 6/7/2011. Click here.
View all notes |
Alert me of new notes |
CANSLIM.net Company Profile |
SEC |
Zacks Reports |
StockTalk |
News |
Chart |
Request a new note
C
A N
S L
I M
|
Symbol/Exchange
Company Name
Industry Group |
PRICE |
CHANGE
(%Change) |
Day High |
Volume
(% DAV)
(% 50 day avg vol) |
52 Wk Hi
% From Hi |
Featured
Date |
Price
Featured |
Pivot Featured |
|
Max Buy |
HS
-
NYSE
Healthspring Inc
HEALTH SERVICES - Health Care Plans
|
$45.97
|
+0.93
2.06% |
$46.37
|
909,906
103.00% of 50 DAV
50 DAV is 883,400
|
$47.78
-3.79%
|
6/16/2011
|
$42.44
|
PP = $45.21
|
|
MB = $47.47
|
Most Recent Note - 6/27/2011 5:56:31 PM
Y - Gain today with average volume for its second best close ever. Prior resistance defines support after its recent streak of gains with above average volume to new all-time highs.
>>> The latest Featured Stock Update with an annotated graph appeared on 6/16/2011. Click here.
View all notes |
Alert me of new notes |
CANSLIM.net Company Profile |
SEC |
Zacks Reports |
StockTalk |
News |
Chart |
Request a new note
C
A N
S L
I M
|
INFA
-
NASDAQ
Informatica Corp
COMPUTER SOFTWARE and SERVICES - Business Software and Services
|
$57.45
|
+0.64
1.13% |
$57.72
|
989,503
77.60% of 50 DAV
50 DAV is 1,275,100
|
$59.98
-4.22%
|
3/24/2011
|
$50.04
|
PP = $49.86
|
|
MB = $52.35
|
Most Recent Note - 6/23/2011 4:55:46 PM
G - Managed a positive reversal today after a small gap down. Recently found support near its 50 DMA line. This high-ranked Computer Software - Database firm has not formed a sound new base pattern.
>>> The latest Featured Stock Update with an annotated graph appeared on 6/17/2011. Click here.
View all notes |
Alert me of new notes |
CANSLIM.net Company Profile |
SEC |
Zacks Reports |
StockTalk |
News |
Chart |
Request a new note
C
A N
S L
I M
|
LULU
-
NASDAQ
Lululemon Athletica
MANUFACTURING - Textile Manufacturing
|
$108.58
|
+4.20
4.02% |
$108.99
|
2,329,178
113.65% of 50 DAV
50 DAV is 2,049,400
|
$106.75
1.71%
|
6/21/2011
|
$102.95
|
PP = $101.14
|
|
MB = $106.20
|
Most Recent Note - 6/27/2011 3:22:06 PM
G - Surging to new 52-week and all-time highs today, getting extended from its latest base. Disciplined investors avoid chasing extended stocks. Prior highs define important chart support to watch.
>>> The latest Featured Stock Update with an annotated graph appeared on 6/21/2011. Click here.
View all notes |
Alert me of new notes |
CANSLIM.net Company Profile |
SEC |
Zacks Reports |
StockTalk |
News |
Chart |
Request a new note
C
A N
S L
I M
|
MWIV
-
NASDAQ
M W I Veterinary Supply
HEALTH SERVICES - Medical Instruments and; Supplies
|
$80.40
|
+0.19
0.24% |
$80.86
|
50,132
59.89% of 50 DAV
50 DAV is 83,700
|
$86.99
-7.58%
|
11/4/2010
|
$61.79
|
PP = $59.60
|
|
MB = $62.58
|
Most Recent Note - 6/22/2011 5:48:53 PM
G - It may be forming a new base, however gains have lacked volume conviction following its 50 DMA line violation, and that short-term average is now acting as a resistance level. A gain above it is needed for its outlook to improve.
>>> The latest Featured Stock Update with an annotated graph appeared on 6/9/2011. Click here.
View all notes |
Alert me of new notes |
CANSLIM.net Company Profile |
SEC |
Zacks Reports |
StockTalk |
News |
Chart |
Request a new note
C
A N
S L
I M
|
OPNT
-
NASDAQ
Opnet Technologies
INTERNET - Internet Software and Services
|
$39.37
|
+0.28
0.72% |
$39.75
|
61,296
51.04% of 50 DAV
50 DAV is 120,100
|
$42.51
-7.39%
|
5/11/2011
|
$41.21
|
PP = $40.50
|
|
MB = $42.53
|
Most Recent Note - 6/24/2011 4:12:29 PM
G - Gains this week without great volume conviction helped it rise back above its 50 DMA line. Its recent lows near $36 define important near-term chart support.
>>> The latest Featured Stock Update with an annotated graph appeared on 6/10/2011. Click here.
View all notes |
Alert me of new notes |
CANSLIM.net Company Profile |
SEC |
Zacks Reports |
StockTalk |
News |
Chart |
Request a new note
C
A N
S L
I M
|
Symbol/Exchange
Company Name
Industry Group |
PRICE |
CHANGE
(%Change) |
Day High |
Volume
(% DAV)
(% 50 day avg vol) |
52 Wk Hi
% From Hi |
Featured
Date |
Price
Featured |
Pivot Featured |
|
Max Buy |
OTEX
-
NASDAQ
Open Text Corp
INTERNET - Internet Software and Services
|
$60.65
|
+0.22
0.36% |
$60.85
|
149,817
47.35% of 50 DAV
50 DAV is 316,400
|
$67.08
-9.59%
|
6/1/2011
|
$65.86
|
PP = $67.18
|
|
MB = $70.54
|
Most Recent Note - 6/24/2011 3:42:29 PM
G - Gains above its 50 DMA line are needed for its outlook to improve, technically. Its 50 DMA line has acted as resistance recently, and it faces overhead supply up through $66 after trading at higher levels in recent months.
>>> The latest Featured Stock Update with an annotated graph appeared on 6/24/2011. Click here.
View all notes |
Alert me of new notes |
CANSLIM.net Company Profile |
SEC |
Zacks Reports |
StockTalk |
News |
Chart |
Request a new note
C
A N
S L
I M
|
SWI
-
NYSE
Solarwinds Inc
COMPUTER SOFTWARE and SERVICES - Application Software
|
$25.11
|
+0.31
1.25% |
$25.17
|
726,878
91.12% of 50 DAV
50 DAV is 797,700
|
$26.68
-5.88%
|
6/7/2011
|
$24.22
|
PP = $25.05
|
|
MB = $26.30
|
Most Recent Note - 6/24/2011 3:39:09 PM
Y - Consolidating back under its pivot point today with a loss on light volume. Prior resistance in the $24-25 area defines support. A close under its old high close ($24.77 on 4/25/11) would raise concerns by negating its recent breakout.
>>> The latest Featured Stock Update with an annotated graph appeared on 6/8/2011. Click here.
View all notes |
Alert me of new notes |
CANSLIM.net Company Profile |
SEC |
Zacks Reports |
StockTalk |
News |
Chart |
Request a new note
C
A N
S L
I M
|
ULTA
-
NASDAQ
Ulta Salon Cosm & Frag
SPECIALTY RETAIL - Specialty Retail, Other
|
$63.17
|
+0.35
0.56% |
$64.85
|
976,242
119.17% of 50 DAV
50 DAV is 819,200
|
$63.05
0.19%
|
1/6/2011
|
$36.12
|
PP = $37.34
|
|
MB = $39.21
|
Most Recent Note - 6/24/2011 4:14:12 PM
G - Perched at its all-time high, extended from any sound base pattern after a 3rd consecutive weekly gain. It may produce more climactic gains, but disciplined investors avoid chasing extended stocks.
>>> The latest Featured Stock Update with an annotated graph appeared on 6/20/2011. Click here.
View all notes |
Alert me of new notes |
CANSLIM.net Company Profile |
SEC |
Zacks Reports |
StockTalk |
News |
Chart |
Request a new note
C
A N
S L
I M
|
ZAGG
-
NASDAQ
Zagg Inc
SPECIALTY RETAIL - Specialty Retail, Other
|
$14.01
|
-0.31
-2.16% |
$14.55
|
2,220,073
140.89% of 50 DAV
50 DAV is 1,575,800
|
$15.85
-11.61%
|
6/1/2011
|
$10.92
|
PP = $10.59
|
|
MB = $11.12
|
Most Recent Note - 6/27/2011 6:01:57 PM
G - Finished in the upper half of its intra-day range today, consolidating from its all-time high after a spurt of volume-driven gains. It is extended from a sound base. Prior highs define initial support to watch on pullbacks. See the latest FSU analysis for more details and a new annotated graph.
>>> The latest Featured Stock Update with an annotated graph appeared on 6/23/2011. Click here.
View all notes |
Alert me of new notes |
CANSLIM.net Company Profile |
SEC |
Zacks Reports |
StockTalk |
News |
Chart |
Request a new note
C
A N
S L
I M
|
|
|
|
THESE ARE NOT BUY RECOMMENDATIONS!
Comments contained in the body of this report are technical
opinions only. The material herein has been obtained
from sources believed to be reliable and accurate, however,
its accuracy and completeness cannot be guaranteed.
This site is not an investment advisor, hence it does
not endorse or recommend any securities or other investments.
Any recommendation contained in this report may not
be suitable for all investors and it is not to be deemed
an offer or solicitation on our part with respect to
the purchase or sale of any securities. All trademarks,
service marks and trade names appearing in this report
are the property of their respective owners, and are
likewise used for identification purposes only.
This report is a service available
only to active Paid Premium Members.
You may opt-out of receiving report notifications
at any time. Questions or comments may be submitted
by writing to Premium Membership Services 665 S.E. 10 Street, Suite 201 Deerfield Beach, FL 33441-5634 or by calling 1-800-965-8307
or 954-785-1121.
|
|
|

