You are not logged in.
This means you
CAN ONLY VIEW reports that were published prior to Monday, April 14, 2025.
You
MUST UPGRADE YOUR MEMBERSHIP if you want to see any current reports.
AFTER MARKET UPDATE - TUESDAY, JUNE 25TH, 2013
Previous After Market Report Next After Market Report >>>
|
|
|
|
DOW |
+100.75 |
14,760.31 |
+0.69% |
|
Volume |
810,016,870 |
-16% |
|
Volume |
1,598,766,080 |
-18% |
|
NASDAQ |
+27.13 |
3,347.89 |
+0.82% |
|
Advancers |
2,478 |
79% |
|
Advancers |
1,779 |
69% |
|
S&P 500 |
+14.94 |
1,588.03 |
+0.95% |
|
Decliners |
591 |
19% |
|
Decliners |
709 |
27% |
|
Russell 2000 |
+10.21 |
961.26 |
+1.07% |
|
52 Wk Highs |
35 |
|
|
52 Wk Highs |
70 |
|
|
S&P 600 |
+5.62 |
541.94 |
+1.05% |
|
52 Wk Lows |
145 |
|
|
52 Wk Lows |
40 |
|
|
 |
Major Averages Posted Gains With Less Volume Conviction
Kenneth J. Gruneisen - Passed the CAN SLIM® Master's Exam
The major averages held solid gains into Tuesday's closing bell. However, the volume totals were reported lighter than the prior session totals on the NYSE and on the Nasdaq exchange, giving an obvious hint that the institutional crowd was not accumulating stocks. Breadth was positive as advancers led decliners by a 4-1 margin on the NYSE and by more than 2-1 on the Nasdaq exchange. There were 18 high-ranked companies from the CANSLIM.net Leaders List made new 52-week highs and appeared on the CANSLIM.net BreakOuts Page, up from the prior session total of 13 stocks. The list of stocks hitting new 52-lows contracted yet still outnumbered new 52-week highs on the NYSE, meanwhile new highs outnumbered new lows on the Nasdaq exchange. There were gains for 7 of the 8 high-ranked companies currently included on the Featured Stocks Page, a list that has been waning in recent weeks.

Stocks managed to pare some of their recent declines on the heels of several positive economic reports. Looking at the data, May durable goods orders and June consumer confidence increased more than expected. Housing data was also positive as new home sales ticked higher in May and the Case-Shiller index showed a +1.7% increase in April home prices.
All 10 sectors on the S&P were higher led by a rally in financials including Bank of America Corp (BAC +3.01%). On the earnings front, Lennar Corp (LEN +0.69%) edged higher after posting a better-than-expected profit tally. On the downside, Walgreen Co (WAG -5.89%) shares slumped as the company fell short of analysts' estimates. In other news, Pandora Media Inc (P +8.46%) rallied after the company announced that its streaming radio service would be featured in 100 new vehicle models.
Turning to fixed income markets, Treasuries were lower along the curve. The benchmark 10-year note was down 17/32 to yield 2.61% and the 30-year bond was off over a full point to yield 3.63%.
The market (M criteria) weakness has been noted as a "correction" and this commentary has repeatedly reminded members - "Be protective of any gains, and limit losses! Be especially watchful for any individual issues flashing technical sell signals. It is vitally important to your success with the fact-based investment system to reduce exposure and preserve cash during market downdrafts."
There is a need for caution until a follow-through day of meaningful gains from at least one of the major averages on higher volume coupled with an expansion in leadership (stocks hitting new 52-week highs). Watch upcoming CANSLIM.net reports and especially the bold portion for us to observe any noteworthy shifts in the market direction (M criteria).
Individual leaders best matching the winning models of the fact-based investment system are on the Featured Stocks Page - with our Certified experts' latest notes and links to additional resources including detailed analysis with annotated graphs. The Premium Member Homepage - includes "dynamic archives" to all prior pay reports published. Watch for an announcement via email concerning the next WEBCAST.
PICTURED: The S&P 500 Index posted a gain on lighter volume after a damaging violation of its 50-day moving average (DMA) line and prior lows with heavier volume behind its losses.
|
 Kenneth J. Gruneisen started out as a licensed stockbroker in August 1987, a couple of months prior to the historic stock market crash that took the Dow Jones Industrial Average down -22.6% in a single day. He has published daily fact-based fundamental and technical analysis on high-ranked stocks online for two decades. Through FACTBASEDINVESTING.COM, Kenneth provides educational articles, news, market commentary, and other information regarding proven investment systems that work in good times and bad.
Comments contained in the body of this report are technical opinions only and are not necessarily those of Gruneisen Growth Corp. The material herein has been obtained from sources believed to be reliable and accurate, however, its accuracy and completeness cannot be guaranteed. Our firm, employees, and customers may effect transactions, including transactions contrary to any recommendation herein, or have positions in the securities mentioned herein or options with respect thereto. Any recommendation contained in this report may not be suitable for all investors and it is not to be deemed an offer or solicitation on our part with respect to the purchase or sale of any securities. |
|
 |
Financial, Retail, Tech, and Energy-Related Groups Rose
Kenneth J. Gruneisen - Passed the CAN SLIM® Master's Exam
Financial stocks underpinned the major averages as they bounced on Tuesday while the Broker/Dealer Index ($XBD +1.46%) and the Bank Index ($BKX +2.18%) posted gains. The Retail Index ($RLX +0.80%) was a positive influence, and there were gains for the Biotechnology Index ($BTK +1.09%) and the Internet Index ($IIX +0.93%), followed by a smaller gain for the Networking Index ($NWX +0.26%). Energy-related shares also had a positive slant as the Integrated Oil Index ($XOI +1.21%) and the Oil Services Index ($OSX +1.32%) posted gains. Meanwhile, defensive groups were clearly laggards as the Healthcare Index ($HMO -0.35%) and the Gold & Silver Index ($XAU -0.13%) edged lower.
Charts courtesy www.stockcharts.com
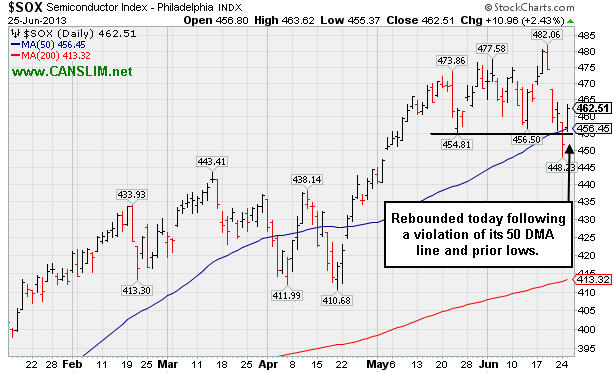
PICTURED: The Semiconductor Index ($SOX +2.43%) led the tech sector higher, promptly rebounding following a violation of its 50-day moving average (DMA) line and prior lows.
| Oil Services |
$OSX |
251.19 |
+3.27 |
+1.32% |
+14.09% |
| Healthcare |
$HMO |
3,128.72 |
-11.03 |
-0.35% |
+24.44% |
| Integrated Oil |
$XOI |
1,316.47 |
+15.68 |
+1.21% |
+6.01% |
| Semiconductor |
$SOX |
462.51 |
+10.96 |
+2.43% |
+20.43% |
| Networking |
$NWX |
254.57 |
+0.66 |
+0.26% |
+12.37% |
| Internet |
$IIX |
372.09 |
+3.42 |
+0.93% |
+13.79% |
| Broker/Dealer |
$XBD |
124.06 |
+1.78 |
+1.46% |
+31.51% |
| Retail |
$RLX |
771.65 |
+6.09 |
+0.80% |
+18.16% |
| Gold & Silver |
$XAU |
87.22 |
-0.11 |
-0.13% |
-47.33% |
| Bank |
$BKX |
60.48 |
+1.29 |
+2.18% |
+17.94% |
| Biotech |
$BTK |
1,883.97 |
+20.28 |
+1.09% |
+21.78% |
|
|
|
 |
Extended From Base After Rallying With No Overhead Supply
Kenneth J. Gruneisen - Passed the CAN SLIM® Master's Exam
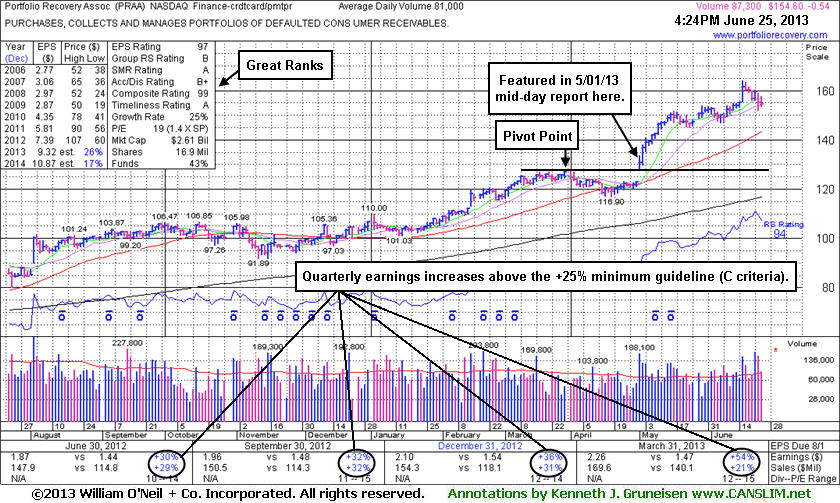
Portfolio Recovery Assoc (PRAA -$0.54 or -0.35% to $154.60) is consolidating near its all-time high, extended from any sound base. It rallied into new high territory in recent weeks with no resistance due to overhead supply. Its 50-day moving average (DMA) line defines important near-term chart support to watch on pullbacks. Patient investors may continue watching for a new base or secondary buy point to possibly develop and be noted in the weeks ahead. Since highlighted in the 5/01/13 mid-day report (read here) after its "breakaway gap" it has shown bullish action and traded up as much as +25.3%.
Its last appearance in this FSU section was on 6/10/13 with an annotated graph under the headline, "Perched Near High After Mild Distributional Pressure". The high-ranked leader from the Finance - Credit Card/Payment Processing industry group has strong fundamentals. It reported earnings +54% on +21% sales revenues for the Mar '13 quarter, continuing its record of strong earnings increases above the +25% minimum guideline (C criteria). The number of top-rated funds owning its shares rose from 308 in Jun '12 to 384 in Mar '13, a reassuring sign concerning the I criteria. Its Up/Down Volume Ratio is currently at 2.1, an unbiased indication that its shares have been under accumulation over the past 50 days.
|
|
|
Color Codes Explained :
Y - Better candidates highlighted by our
staff of experts.
G - Previously featured
in past reports as yellow but may no longer be buyable under the
guidelines.
***Last / Change / Volume data in this table is the closing quote data***
Symbol/Exchange
Company Name
Industry Group |
PRICE |
CHANGE
(%Change) |
Day High |
Volume
(% DAV)
(% 50 day avg vol) |
52 Wk Hi
% From Hi |
Featured
Date |
Price
Featured |
Pivot Featured |
|
Max Buy |
AMBA
-
NASDAQ
Ambarella Inc
ELECTRONICS - Semiconductor - Specialized
|
$16.47
|
+0.52
3.26% |
$16.49
|
900,665
81.91% of 50 DAV
50 DAV is 1,099,600
|
$18.58
-11.36%
|
5/6/2013
|
$15.31
|
PP = $16.10
|
|
MB = $16.91
|
 Most Recent Note - 6/25/2013 5:35:49 PM
Y - Halted its slide with a gain today on lighter volume and its color code is changed to yellow while consolidating below its "max buy" level. Its 50 DMA line ($15.35 now) defines important chart support to watch where a violation would trigger a worrisome technical sell signal.
>>> The latest Featured Stock Update with an annotated graph appeared on 6/14/2013. Click here.
View all notes |
Alert me of new notes |
CANSLIM.net Company Profile |
SEC |
Zacks Reports |
StockTalk |
News |
Chart |
Request a new note
C
A N
S L
I M


|
EQM
-
NYSE
E Q T Midstream Partners
ENERGY - Oil and Gas Pipelines
|
$49.22
|
+0.30
0.61% |
$49.61
|
52,730
37.94% of 50 DAV
50 DAV is 139,000
|
$51.72
-4.83%
|
4/25/2013
|
$40.16
|
PP = $40.84
|
|
MB = $42.88
|
Most Recent Note - 6/25/2013 5:37:55 PM
G - Small gain on light volume today following 3 consecutive losses with average or above average volume after challenging its 52-week high. Extended from any sound base. Recent low and its 50 DMA line define important near-term support in the $45 area.
>>> The latest Featured Stock Update with an annotated graph appeared on 6/21/2013. Click here.
View all notes |
Alert me of new notes |
CANSLIM.net Company Profile |
SEC |
Zacks Reports |
StockTalk |
News |
Chart |
Request a new note
C
A N
S L
I M
|
FLT
-
NYSE
Fleetcor Technologies
DIVERSIFIED SERVICES - Business/Management Services
|
$83.40
|
+1.02
1.24% |
$84.06
|
499,844
55.08% of 50 DAV
50 DAV is 907,500
|
$89.75
-7.08%
|
5/29/2013
|
$86.02
|
PP = $85.66
|
|
MB = $89.94
|
Most Recent Note - 6/25/2013 5:41:22 PM
Y- Halted its slide at its 50 DMA line ($82.09) with a gain today on light volume following 4 consecutive losses on higher volume. Recent low ($80.28 on 6/21/13) defines important near-term chart support where a violation may raise greater concerns and trigger a technical sell signal.
>>> The latest Featured Stock Update with an annotated graph appeared on 6/18/2013. Click here.
View all notes |
Alert me of new notes |
CANSLIM.net Company Profile |
SEC |
Zacks Reports |
StockTalk |
News |
Chart |
Request a new note
C
A N
S L
I M
|
LOPE
-
NASDAQ
Grand Canyon Education
DIVERSIFIED SERVICES - Education and; Training Services
|
$31.54
|
+0.66
2.14% |
$32.19
|
658,925
167.62% of 50 DAV
50 DAV is 393,100
|
$34.07
-7.43%
|
6/19/2013
|
$31.47
|
PP = $34.17
|
|
MB = $35.88
|
Most Recent Note - 6/25/2013 5:43:24 PM
Y - Gapped up today for a gain backed by above average volume. Consolidating above its 50 DMA line and well above additional support at prior highs in the $27 area. Subsequent volume driven gains above its pivot point may trigger a new technical buy signal.
>>> The latest Featured Stock Update with an annotated graph appeared on 6/19/2013. Click here.
View all notes |
Alert me of new notes |
CANSLIM.net Company Profile |
SEC |
Zacks Reports |
StockTalk |
News |
Chart |
Request a new note
C
A N
S L
I M
|
PRAA
-
NASDAQ
Portfolio Recovery Assoc
DIVERSIFIED SERVICES - Business/Management Services
|
$154.60
|
-0.54
-0.35% |
$157.70
|
89,119
110.02% of 50 DAV
50 DAV is 81,000
|
$163.87
-5.66%
|
5/1/2013
|
$130.77
|
PP = $127.88
|
|
MB = $134.27
|
Most Recent Note - 6/25/2013 5:31:31 PM
G - Extended from any sound base, it rallied with no resistance due to overhead supply. Its 50 DMA line ($143.35 now) defines important near-term chart support. See the latest FSU analysis for more details and a new annotated graph.
>>> The latest Featured Stock Update with an annotated graph appeared on 6/25/2013. Click here.
View all notes |
Alert me of new notes |
CANSLIM.net Company Profile |
SEC |
Zacks Reports |
StockTalk |
News |
Chart |
Request a new note
C
A N
S L
I M
|
Symbol/Exchange
Company Name
Industry Group |
PRICE |
CHANGE
(%Change) |
Day High |
Volume
(% DAV)
(% 50 day avg vol) |
52 Wk Hi
% From Hi |
Featured
Date |
Price
Featured |
Pivot Featured |
|
Max Buy |
PRLB
-
NYSE
Proto Labs Inc
MANUFACTURING - Small Tools and Accessories
|
$64.62
|
+3.22
5.24% |
$66.25
|
738,576
144.17% of 50 DAV
50 DAV is 512,300
|
$65.12
-0.77%
|
6/17/2013
|
$59.37
|
PP = $59.94
|
|
MB = $62.94
|
Most Recent Note - 6/25/2013 12:26:42 PM
G- Gapped up today hitting a new 52-week high following a "positive reversal" on the prior session, finding prompt support near prior highs. Color code is changed to green after rallying above its "max buy" level.
>>> The latest Featured Stock Update with an annotated graph appeared on 6/12/2013. Click here.
View all notes |
Alert me of new notes |
CANSLIM.net Company Profile |
SEC |
Zacks Reports |
StockTalk |
News |
Chart |
Request a new note
C
A N
S L
I M
|
RRTS
-
NYSE
Roadrunner Trans Systems
TRANSPORTATION - Air Delivery and Freight Service
|
$27.07
|
+0.71
2.69% |
$27.19
|
148,908
73.94% of 50 DAV
50 DAV is 201,400
|
$29.52
-8.30%
|
4/3/2013
|
$22.77
|
PP = $23.75
|
|
MB = $24.94
|
Most Recent Note - 6/25/2013 5:44:55 PM
G - Posted a gain today with below average volume following a streak of 6 losses after a "negative reversal" at its 52-week high. Fundamental concerns were raised by its sub par earnings increase in the Mar '13 quarter.
>>> The latest Featured Stock Update with an annotated graph appeared on 6/20/2013. Click here.
View all notes |
Alert me of new notes |
CANSLIM.net Company Profile |
SEC |
Zacks Reports |
StockTalk |
News |
Chart |
Request a new note
C
A N
S L
I M
|
VRX
-
NYSE
Valeant Pharmaceuticals
DRUGS - Drug Manufacturers - Other
|
$85.24
|
+1.24
1.48% |
$85.37
|
2,050,766
103.94% of 50 DAV
50 DAV is 1,973,100
|
$96.25
-11.44%
|
4/30/2013
|
$60.24
|
PP = $76.66
|
|
MB = $80.49
|
Most Recent Note - 6/24/2013 5:44:12 PM
G- Completed a new Public Offering on 6/18/13 following recent M&A news. Concerns were raised by its sub par Mar '13 earnings report. See latest FSU analysis for more details and a new annotated graph.
>>> The latest Featured Stock Update with an annotated graph appeared on 6/24/2013. Click here.
View all notes |
Alert me of new notes |
CANSLIM.net Company Profile |
SEC |
Zacks Reports |
StockTalk |
News |
Chart |
Request a new note
C
A N
S L
I M
|
|
|
|
THESE ARE NOT BUY RECOMMENDATIONS!
Comments contained in the body of this report are technical
opinions only. The material herein has been obtained
from sources believed to be reliable and accurate, however,
its accuracy and completeness cannot be guaranteed.
This site is not an investment advisor, hence it does
not endorse or recommend any securities or other investments.
Any recommendation contained in this report may not
be suitable for all investors and it is not to be deemed
an offer or solicitation on our part with respect to
the purchase or sale of any securities. All trademarks,
service marks and trade names appearing in this report
are the property of their respective owners, and are
likewise used for identification purposes only.
This report is a service available
only to active Paid Premium Members.
You may opt-out of receiving report notifications
at any time. Questions or comments may be submitted
by writing to Premium Membership Services 665 S.E. 10 Street, Suite 201 Deerfield Beach, FL 33441-5634 or by calling 1-800-965-8307
or 954-785-1121.
|
|
|

