You are not logged in.
This means you
CAN ONLY VIEW reports that were published prior to Tuesday, April 15, 2025.
You
MUST UPGRADE YOUR MEMBERSHIP if you want to see any current reports.
AFTER MARKET UPDATE - WEDNESDAY, JUNE 26TH, 2013
Previous After Market Report Next After Market Report >>>
|
|
|
|
DOW |
+149.83 |
14,910.14 |
+1.02% |
|
Volume |
774,154,730 |
-4% |
|
Volume |
1,587,545,400 |
-1% |
|
NASDAQ |
+28.33 |
3,376.22 |
+0.85% |
|
Advancers |
2,346 |
74% |
|
Advancers |
1,349 |
52% |
|
S&P 500 |
+15.23 |
1,603.26 |
+0.96% |
|
Decliners |
741 |
24% |
|
Decliners |
1,110 |
43% |
|
Russell 2000 |
+2.57 |
963.83 |
+0.27% |
|
52 Wk Highs |
64 |
|
|
52 Wk Highs |
90 |
|
|
S&P 600 |
+0.81 |
542.75 |
+0.15% |
|
52 Wk Lows |
58 |
|
|
52 Wk Lows |
32 |
|
|
 |
Major Averages Rose Without Great Volume Conviction
Kenneth J. Gruneisen - Passed the CAN SLIM® Master's Exam
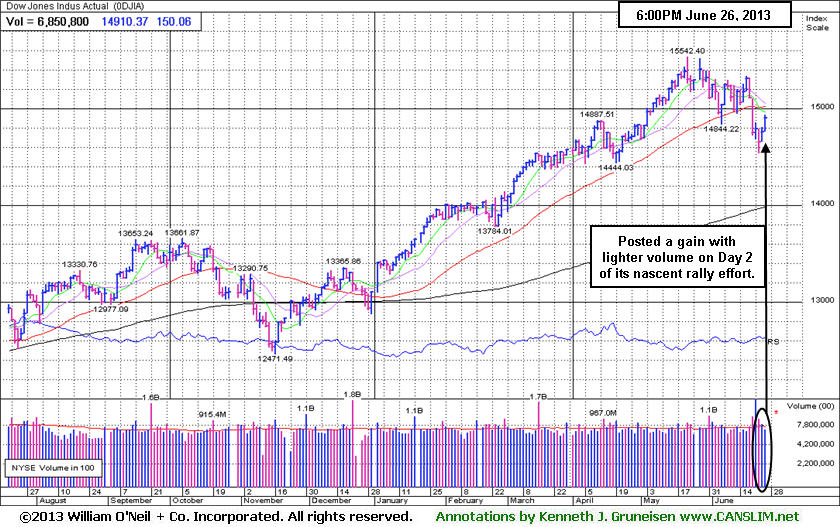
The major averages extended their solid gains into Wednesday's closing bell. However, the volume totals were reported near or lighter than the prior session totals on the NYSE and on the Nasdaq exchange, still hinting that the institutional crowd was not aggressively accumulating stocks. Breadth was positive as advancers led decliners by more than a 3-1 margin on the NYSE, but advancers led by a narrow 7-6 margin on the Nasdaq exchange. There were 20 high-ranked companies from the CANSLIM.net Leaders List made new 52-week highs and appeared on the CANSLIM.net BreakOuts Page, versus the prior session total of 18 stocks. The list of stocks hitting new 52-lows has abruptly contracted, and new 52-week highs outnumbered new 52-week lows on both the NYSE and the Nasdaq exchange. There were gains for 5 of the 8 high-ranked companies currently included on the Featured Stocks Page, a list that has waned in recent weeks.
The major averages were able to post a second day of gains despite a downward revision to first quarter GDP from 2.4% to 1.8%. Concerns over a credit crunch in China eased after the central bank pledged to keep financial institutions liquid.
All 10 sectors on the S&P ended higher, led by gains in health care stocks including Johnson & Johnson (JNJ +1.92%). On the earnings front, for-profit educator Apollo Group (APOL -10.27%) fell hard after the company posted quarterly revenues that were below analysts' estimates. Also on the downside Smith & Wesson Holding Corp (SWHC -2.1%) and General Mills Inc (GIS -0.48%) ended lower following their profit tallies.
Turning to fixed income markets, Treasuries ended higher along the curve. The benchmark 10-year note was up 17/32 to yield 2.54% and the 30-year bond advanced 5/8 of a point to yield 3.58%.
The market (M criteria) weakness has been noted as a "correction" and this commentary has repeatedly reminded members - "Be protective of any gains, and limit losses! Be especially watchful for any individual issues flashing technical sell signals. It is vitally important to your success with the fact-based investment system to reduce exposure and preserve cash during market downdrafts."
There is a need for caution until a follow-through day of meaningful gains (+1.4% or greater) from at least one of the major averages on higher volume coupled with an expansion in leadership (stocks hitting new 52-week highs). Watch upcoming CANSLIM.net reports and especially the bold portion for us to observe any noteworthy shifts in the market direction (M criteria).
Individual leaders best matching the winning models of the fact-based investment system are on the Featured Stocks Page - with our Certified experts' latest notes and links to additional resources including detailed analysis with annotated graphs. The Premium Member Homepage - includes "dynamic archives" to all prior pay reports published. Watch for an announcement via email concerning the next WEBCAST.
PICTURED: The Dow Jones Industrial Average posted a gain on Day 2 of its nascent rally attempt with lighter volume after a damaging violation of its 50-day moving average (DMA) line and prior lows with heavier volume behind its losses.
|
 Kenneth J. Gruneisen started out as a licensed stockbroker in August 1987, a couple of months prior to the historic stock market crash that took the Dow Jones Industrial Average down -22.6% in a single day. He has published daily fact-based fundamental and technical analysis on high-ranked stocks online for two decades. Through FACTBASEDINVESTING.COM, Kenneth provides educational articles, news, market commentary, and other information regarding proven investment systems that work in good times and bad.
Comments contained in the body of this report are technical opinions only and are not necessarily those of Gruneisen Growth Corp. The material herein has been obtained from sources believed to be reliable and accurate, however, its accuracy and completeness cannot be guaranteed. Our firm, employees, and customers may effect transactions, including transactions contrary to any recommendation herein, or have positions in the securities mentioned herein or options with respect thereto. Any recommendation contained in this report may not be suitable for all investors and it is not to be deemed an offer or solicitation on our part with respect to the purchase or sale of any securities. |
|
 |
Retail, Financial Groups Gain; XAU Slammed Again
Kenneth J. Gruneisen - Passed the CAN SLIM® Master's Exam
The Gold & Silver Index ($XAU -5.58%) was punished with yet another large loss while the Retail Index ($RLX +1.21%) growth-oriented areas fared much better on Wednesday. The financial groups were also a positive influence on the major averages as the Broker/Dealer Index ($XBD +0.42%) and the Bank Index ($BKX +0.94%) both rose. Energy-related shares traded up and gave the Integrated Oil Index ($XOI +1.04%) and the Oil Services Index ($OSX +0.38%) each a boost. The Biotechnology Index ($BTK +3.10% ) led the tech sector while the Healthcare Index ($HMO +0.74%) also had a positive bias. The Internet Index ($IIX +0.87%) and the Semiconductor Index ($SOX +0.52%) each posted smaller gains while the Networking Index ($NWX -0.44%) ended with a modest loss.
Charts courtesy www.stockcharts.com
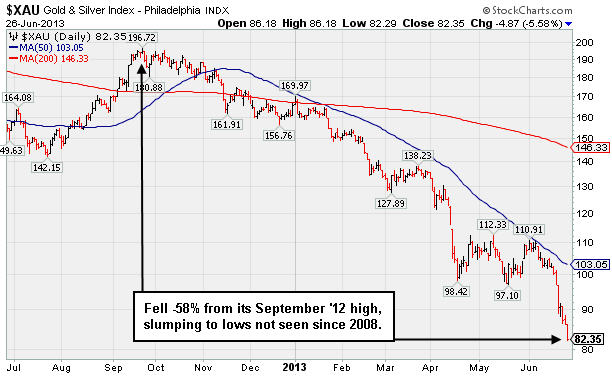
PICTURED: The Gold & Silver Index ($XAU -5.58%) has lost -58% from its September 2012 high. The outlook for gold and silver producing companies has turned increasingly grim as the underlying precious metals' prices have slumped following a record setting multi-year run-up.
| Oil Services |
$OSX |
252.14 |
+0.95 |
+0.38% |
+14.53% |
| Healthcare |
$HMO |
3,151.75 |
+23.03 |
+0.74% |
+25.36% |
| Integrated Oil |
$XOI |
1,330.10 |
+13.63 |
+1.04% |
+7.11% |
| Semiconductor |
$SOX |
464.93 |
+2.42 |
+0.52% |
+21.06% |
| Networking |
$NWX |
253.45 |
-1.12 |
-0.44% |
+11.88% |
| Internet |
$IIX |
375.34 |
+3.25 |
+0.87% |
+14.78% |
| Broker/Dealer |
$XBD |
124.58 |
+0.53 |
+0.42% |
+32.07% |
| Retail |
$RLX |
781.01 |
+9.36 |
+1.21% |
+19.59% |
| Gold & Silver |
$XAU |
82.35 |
-4.87 |
-5.58% |
-50.27% |
| Bank |
$BKX |
61.05 |
+0.57 |
+0.94% |
+19.05% |
| Biotech |
$BTK |
1,942.33 |
+58.36 |
+3.10% |
+25.55% |
|
|
|
 |
Fundamentals and Technical Action Remain Strong
Kenneth J. Gruneisen - Passed the CAN SLIM® Master's Exam
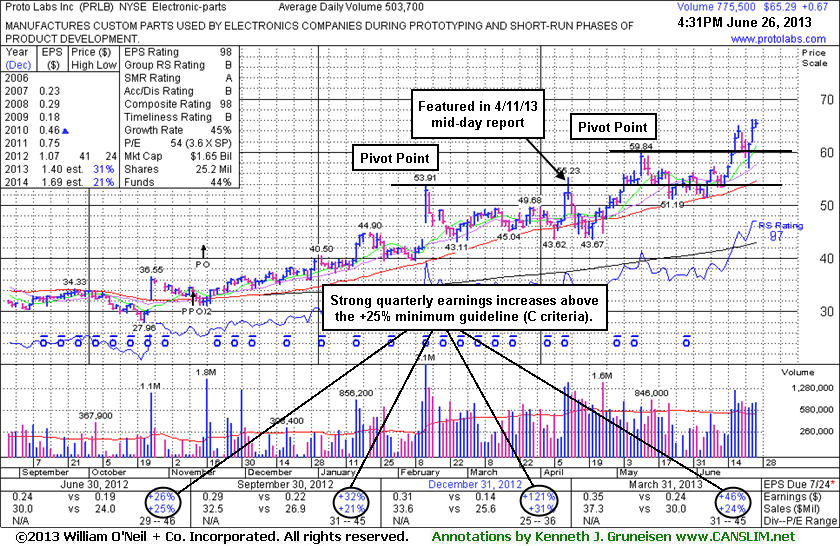
Proto Labs Inc (PRLB +$0.67 or +1.04% to $65.29) is perched at its 52-week high after posting 2 additional volume-driven gains following its noted "positive reversal" on 6/24/13. It found prompt support near prior highs. The high-ranked Electronic - Parts firm was last shown in this FSU section with an annotated graph on 6/12/13 under the headline, "Finding Support Above 50-Day Moving Average Line". A new pivot point was then cited on 6/17/13, and it subsequently broke out with a considerable volume-driven gain on 6/18/13 triggering a new (or add-on) technical buy signal. It has traded up as much as +32.6% from $49.97 when first featured in yellow in the 4/10/13 mid-day report (read here). It recently reported earnings +46% on +24% sales revenues for the Mar '13 quarter, continuing its strong growth trend satisfying the C criteria.
PRLB may continue to find support prior highs in the $59 area, however any slump back into its prior base would raise concerns. Disciplined investors always limit losses by selling if any stock falls more than -7% from their purchase price. Keep in mind that 3 out of 4 stocks tend to move in the direction of the major averages (M criteria), and weak action in the broader market has recently been recognized as a "correction" which prompts disciplined investors to adopt a more defensive stance.
The number of top-rated funds owning its shares rose from 131 in Jun '12 to 212 in Mar '13, a reassuring trend concerning the I criteria. Its small supply of only 18.9 million shares (S criteria) in the publicly traded float is ideal, yet it can contribute to greater price volatility in the event of institutional buying or selling. Its Accumulation/ Distribution Rating is currently a B, having improved from a D rating which was noted as a concern earlier. Its Up/Down Volume Ratio of 1.4 is another unbiased indication that its shares have been under accumulation over the past 50 days.
 |
|
|
Color Codes Explained :
Y - Better candidates highlighted by our
staff of experts.
G - Previously featured
in past reports as yellow but may no longer be buyable under the
guidelines.
***Last / Change / Volume data in this table is the closing quote data***
Symbol/Exchange
Company Name
Industry Group |
PRICE |
CHANGE
(%Change) |
Day High |
Volume
(% DAV)
(% 50 day avg vol) |
52 Wk Hi
% From Hi |
Featured
Date |
Price
Featured |
Pivot Featured |
|
Max Buy |
AMBA
-
NASDAQ
Ambarella Inc
ELECTRONICS - Semiconductor - Specialized
|
$16.41
|
-0.06
-0.36% |
$16.84
|
702,613
63.46% of 50 DAV
50 DAV is 1,107,200
|
$18.58
-11.68%
|
5/6/2013
|
$15.31
|
PP = $16.10
|
|
MB = $16.91
|
Most Recent Note - 6/25/2013 5:35:49 PM
Y - Halted its slide with a gain today on lighter volume and its color code is changed to yellow while consolidating below its "max buy" level. Its 50 DMA line ($15.35 now) defines important chart support to watch where a violation would trigger a worrisome technical sell signal.
>>> The latest Featured Stock Update with an annotated graph appeared on 6/14/2013. Click here.
View all notes |
Alert me of new notes |
CANSLIM.net Company Profile |
SEC |
Zacks Reports |
StockTalk |
News |
Chart |
Request a new note
C
A N
S L
I M


|
EQM
-
NYSE
E Q T Midstream Partners
ENERGY - Oil and Gas Pipelines
|
$49.96
|
+0.74
1.50% |
$50.17
|
39,445
29.05% of 50 DAV
50 DAV is 135,800
|
$51.72
-3.40%
|
4/25/2013
|
$40.16
|
PP = $40.84
|
|
MB = $42.88
|
Most Recent Note - 6/25/2013 5:37:55 PM
G - Small gain on light volume today following 3 consecutive losses with average or above average volume after challenging its 52-week high. Extended from any sound base. Recent low and its 50 DMA line define important near-term support in the $45 area.
>>> The latest Featured Stock Update with an annotated graph appeared on 6/21/2013. Click here.
View all notes |
Alert me of new notes |
CANSLIM.net Company Profile |
SEC |
Zacks Reports |
StockTalk |
News |
Chart |
Request a new note
C
A N
S L
I M
|
FLT
-
NYSE
Fleetcor Technologies
DIVERSIFIED SERVICES - Business/Management Services
|
$84.91
|
+1.51
1.81% |
$85.52
|
655,991
72.84% of 50 DAV
50 DAV is 900,600
|
$89.75
-5.39%
|
5/29/2013
|
$86.02
|
PP = $85.66
|
|
MB = $89.94
|
Most Recent Note - 6/25/2013 5:41:22 PM
Y- Halted its slide at its 50 DMA line ($82.09) with a gain today on light volume following 4 consecutive losses on higher volume. Recent low ($80.28 on 6/21/13) defines important near-term chart support where a violation may raise greater concerns and trigger a technical sell signal.
>>> The latest Featured Stock Update with an annotated graph appeared on 6/18/2013. Click here.
View all notes |
Alert me of new notes |
CANSLIM.net Company Profile |
SEC |
Zacks Reports |
StockTalk |
News |
Chart |
Request a new note
C
A N
S L
I M
|
LOPE
-
NASDAQ
Grand Canyon Education
DIVERSIFIED SERVICES - Education and; Training Services
|
$31.46
|
-0.08
-0.25% |
$32.13
|
312,987
78.38% of 50 DAV
50 DAV is 399,300
|
$34.07
-7.66%
|
6/19/2013
|
$31.47
|
PP = $34.17
|
|
MB = $35.88
|
Most Recent Note - 6/25/2013 5:43:24 PM
Y - Gapped up today for a gain backed by above average volume. Consolidating above its 50 DMA line and well above additional support at prior highs in the $27 area. Subsequent volume driven gains above its pivot point may trigger a new technical buy signal.
>>> The latest Featured Stock Update with an annotated graph appeared on 6/19/2013. Click here.
View all notes |
Alert me of new notes |
CANSLIM.net Company Profile |
SEC |
Zacks Reports |
StockTalk |
News |
Chart |
Request a new note
C
A N
S L
I M
|
PRAA
-
NASDAQ
Portfolio Recovery Assoc
DIVERSIFIED SERVICES - Business/Management Services
|
$154.77
|
+0.17
0.11% |
$155.63
|
60,028
73.74% of 50 DAV
50 DAV is 81,400
|
$163.87
-5.55%
|
5/1/2013
|
$130.77
|
PP = $127.88
|
|
MB = $134.27
|
Most Recent Note - 6/25/2013 5:31:31 PM
G - Extended from any sound base, it rallied with no resistance due to overhead supply. Its 50 DMA line ($143.35 now) defines important near-term chart support. See the latest FSU analysis for more details and a new annotated graph.
>>> The latest Featured Stock Update with an annotated graph appeared on 6/25/2013. Click here.
View all notes |
Alert me of new notes |
CANSLIM.net Company Profile |
SEC |
Zacks Reports |
StockTalk |
News |
Chart |
Request a new note
C
A N
S L
I M
|
Symbol/Exchange
Company Name
Industry Group |
PRICE |
CHANGE
(%Change) |
Day High |
Volume
(% DAV)
(% 50 day avg vol) |
52 Wk Hi
% From Hi |
Featured
Date |
Price
Featured |
Pivot Featured |
|
Max Buy |
PRLB
-
NYSE
Proto Labs Inc
MANUFACTURING - Small Tools and Accessories
|
$65.29
|
+0.67
1.04% |
$66.21
|
776,484
154.16% of 50 DAV
50 DAV is 503,700
|
$66.25
-1.45%
|
6/17/2013
|
$59.37
|
PP = $59.94
|
|
MB = $62.94
|
 Most Recent Note - 6/26/2013 12:47:29 PM
G- Perched at its 52-week high following a "positive reversal" on 6/24/13 followed by a considerable gap up gain on higher volume. Found prompt support near prior highs.
>>> The latest Featured Stock Update with an annotated graph appeared on 6/26/2013. Click here.
View all notes |
Alert me of new notes |
CANSLIM.net Company Profile |
SEC |
Zacks Reports |
StockTalk |
News |
Chart |
Request a new note
C
A N
S L
I M
|
RRTS
-
NYSE
Roadrunner Trans Systems
TRANSPORTATION - Air Delivery and Freight Service
|
$27.51
|
+0.44
1.63% |
$27.51
|
105,651
53.12% of 50 DAV
50 DAV is 198,900
|
$29.52
-6.81%
|
4/3/2013
|
$22.77
|
PP = $23.75
|
|
MB = $24.94
|
Most Recent Note - 6/25/2013 5:44:55 PM
G - Posted a gain today with below average volume following a streak of 6 losses after a "negative reversal" at its 52-week high. Fundamental concerns were raised by its sub par earnings increase in the Mar '13 quarter.
>>> The latest Featured Stock Update with an annotated graph appeared on 6/20/2013. Click here.
View all notes |
Alert me of new notes |
CANSLIM.net Company Profile |
SEC |
Zacks Reports |
StockTalk |
News |
Chart |
Request a new note
C
A N
S L
I M
|
VRX
-
NYSE
Valeant Pharmaceuticals
DRUGS - Drug Manufacturers - Other
|
$84.95
|
-0.29
-0.34% |
$86.76
|
1,814,326
91.10% of 50 DAV
50 DAV is 1,991,500
|
$96.25
-11.74%
|
4/30/2013
|
$60.24
|
PP = $76.66
|
|
MB = $80.49
|
Most Recent Note - 6/24/2013 5:44:12 PM
G- Completed a new Public Offering on 6/18/13 following recent M&A news. Concerns were raised by its sub par Mar '13 earnings report. See latest FSU analysis for more details and a new annotated graph.
>>> The latest Featured Stock Update with an annotated graph appeared on 6/24/2013. Click here.
View all notes |
Alert me of new notes |
CANSLIM.net Company Profile |
SEC |
Zacks Reports |
StockTalk |
News |
Chart |
Request a new note
C
A N
S L
I M
|
|
|
|
THESE ARE NOT BUY RECOMMENDATIONS!
Comments contained in the body of this report are technical
opinions only. The material herein has been obtained
from sources believed to be reliable and accurate, however,
its accuracy and completeness cannot be guaranteed.
This site is not an investment advisor, hence it does
not endorse or recommend any securities or other investments.
Any recommendation contained in this report may not
be suitable for all investors and it is not to be deemed
an offer or solicitation on our part with respect to
the purchase or sale of any securities. All trademarks,
service marks and trade names appearing in this report
are the property of their respective owners, and are
likewise used for identification purposes only.
This report is a service available
only to active Paid Premium Members.
You may opt-out of receiving report notifications
at any time. Questions or comments may be submitted
by writing to Premium Membership Services 665 S.E. 10 Street, Suite 201 Deerfield Beach, FL 33441-5634 or by calling 1-800-965-8307
or 954-785-1121.
|
|
|

