You are not logged in.
This means you
CAN ONLY VIEW reports that were published prior to Monday, April 14, 2025.
You
MUST UPGRADE YOUR MEMBERSHIP if you want to see any current reports.
AFTER MARKET UPDATE - THURSDAY, JUNE 23RD, 2011
Previous After Market Report Next After Market Report >>>
|
|
|
|
DOW |
-59.67 |
12,050.00 |
-0.49% |
|
Volume |
1,117,432,580 |
+30% |
|
Volume |
2,021,766,660 |
+28% |
|
NASDAQ |
+17.56 |
2,686.75 |
+0.66% |
|
Advancers |
1,266 |
40% |
|
Advancers |
1,389 |
51% |
|
S&P 500 |
-3.64 |
1,283.50 |
-0.28% |
|
Decliners |
1,751 |
56% |
|
Decliners |
1,212 |
45% |
|
Russell 2000 |
+2.81 |
802.68 |
+0.35% |
|
52 Wk Highs |
28 |
|
|
52 Wk Highs |
42 |
|
|
S&P 600 |
+0.58 |
430.54 |
+0.13% |
|
52 Wk Lows |
49 |
|
|
52 Wk Lows |
71 |
|
|
 |
Indices Rebounded From Deep Early Losses and Closed Mixed
Kenneth J. Gruneisen - Passed the CAN SLIM® Master's Exam
The major averages rebounded from deeper losses on Thursday, finishing mixed and much better than many expected at mid-session. The volume totals were reported higher on the Nasdaq exchange and the NYSE. Declining issues beat advancers by nearly 3-2 on the NYSE while advancers edged out decliners by a 7-6 ratio on the Nasdaq exchange. New 52-week lows outnumbered new 52-week highs on both the Nasdaq exchange and the NYSE. There were 15 high-ranked companies from the CANSLIM.net Leaders List that made new 52-week highs and appeared on the CANSLIM.net BreakOuts Page, down from the total of 41 on the prior session. There were 11 gainers out of the 14 of the high-ranked leaders currently included on the Featured Stocks Page.
The Dow bounced back from an early loss of 235 points, and the Nasdaq Composite Index finished positive. Airline stocks including United Continental Holdings (UAL +4.84%) rallied on lower energy prices. Aflac Inc (AFL -0.71%) was down only slightly after disclosing a $610 million loss tied to European investments.
Oil tumbled to the lowest price in four months after the International Energy Agency said its members would release crude from strategic reserves. At one point, oil slipped below $90 per barrel for the first time since February.
The market was stunned early by fears of European debt contagion, but investors were comforted late in the day by a report that European leaders approved Greek austerity measures necessary for the next round of aid.
There was no relief on the U.S. jobs front. Initial jobless claims rose more than expected last week. Homebuilders edged higher after a report that new home prices increased in May from the month before.
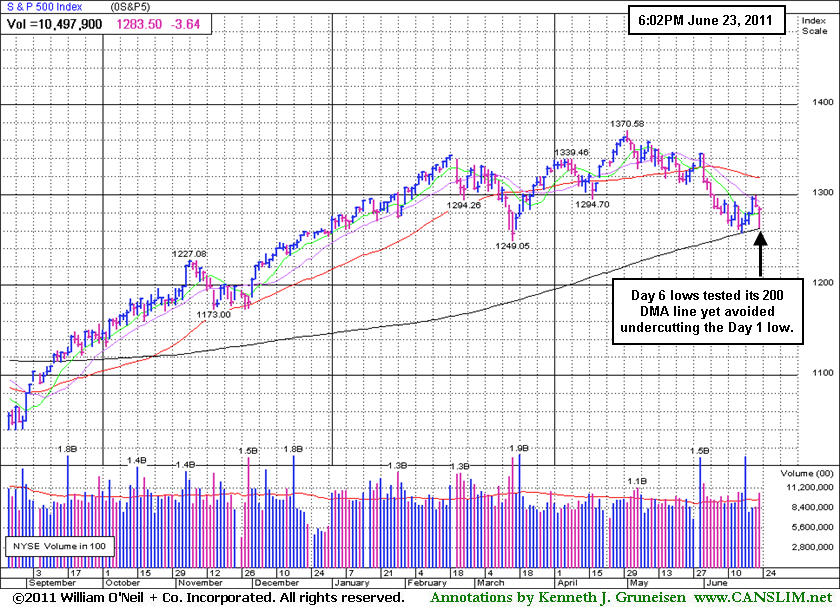
The S&P 500 Index's +1.34% gain on Tuesday was considered a questionable gain borderline with the minimum gain expected for a follow-through day (FTD). On Tuesday the S&P 400 Mid-Cap Index and S&P 600 Small-Cap Index both posted +1.9% gains on Day 3 and Day 4 of their rally attempts, respectively. The strength in small stocks and expansion in the new 52-week highs list was noted as an encouraging sign for growth-oriented investors who might cautiously look to accumulate ideal buy candidates, however the newspaper summarized the latest action with the conclusion that the broader market (M criteria) still remains in a correction.
A follow-through day (FTD) occurring between Day 4 and Day 7 of a new rally is considered the most ideal confirmation of a new rally attempt. As previously explained, to produce a solid FTD there should be a gain of at least +1.4% or more from at least one of the major averages, and the gain must come with higher volume and an expansion in leadership (new 52-week highs). Meanwhile, any deterioration under the Day 1 lows would officially end the nascent rally attempt and signal that the market's correction is continuing.
Upgraded members will have access to the upcoming Q2 2011 Webcast scheduled for Wednesday, June 29th at 8PM EST and the July 2011 issue of CANSLIM.net News to be released soon afterward.
PICTURED: The S&P 500 Index closed near the session high and nearly overcame a 24 point intra-day loss. Even at the session low it remained about 5 points above the Day 1 (June 16th) low.
|
 Kenneth J. Gruneisen started out as a licensed stockbroker in August 1987, a couple of months prior to the historic stock market crash that took the Dow Jones Industrial Average down -22.6% in a single day. He has published daily fact-based fundamental and technical analysis on high-ranked stocks online for two decades. Through FACTBASEDINVESTING.COM, Kenneth provides educational articles, news, market commentary, and other information regarding proven investment systems that work in good times and bad.
Comments contained in the body of this report are technical opinions only and are not necessarily those of Gruneisen Growth Corp. The material herein has been obtained from sources believed to be reliable and accurate, however, its accuracy and completeness cannot be guaranteed. Our firm, employees, and customers may effect transactions, including transactions contrary to any recommendation herein, or have positions in the securities mentioned herein or options with respect thereto. Any recommendation contained in this report may not be suitable for all investors and it is not to be deemed an offer or solicitation on our part with respect to the purchase or sale of any securities. |
|
 |
Financial and Commodity-Linked Groups Fell
Kenneth J. Gruneisen - Passed the CAN SLIM® Master's Exam
Financial shares faltered and the Bank Index ($BKX -1.06%) and Broker/Dealer Index ($XBD -0.96%) lost ground on Thursday. Commodity-linked groups also were on the decline as the Integrated Oil Index ($XOI -1.29%), Oil Services Index ($OSX -0.41%), and Gold & Silver Index ($XAU -0.90%) fell. The Healthcare Index ($HMO -0.34%) edged lower, yet the Biotechnology Index ($BTK +0.32%) posted a small gain and the Internet Index ($IIX +0.96%), Networking Index ($NWX +1.36%), and Semiconductor Index ($SOX +1.47%) unanimously erased early losses and closed the session with solid gains. The Retail Index ($RLX +1.38%) also was a positive influence.
Charts courtesy www.stockcharts.com
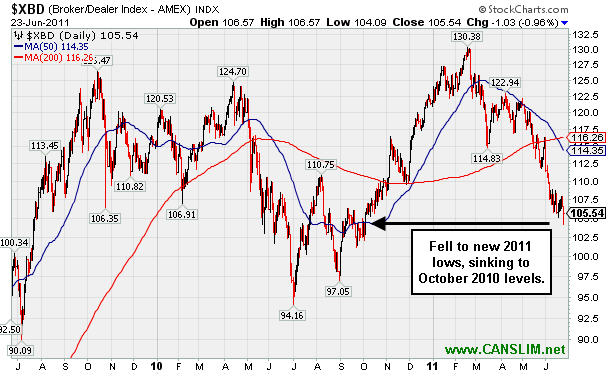
PICTURED: The Broker/Dealer Index ($XBD -0.96%) fell to new 2011 lows, sinking to October 2010 levels.
| Oil Services |
$OSX |
254.73 |
-1.06 |
-0.41% |
+3.92% |
| Healthcare |
$HMO |
2,377.79 |
-8.11 |
-0.34% |
+40.53% |
| Integrated Oil |
$XOI |
1,250.33 |
-16.40 |
-1.29% |
+3.06% |
| Semiconductor |
$SOX |
402.56 |
+5.83 |
+1.47% |
-2.25% |
| Networking |
$NWX |
291.85 |
+3.90 |
+1.36% |
+4.03% |
| Internet |
$IIX |
299.99 |
+2.86 |
+0.96% |
-2.51% |
| Broker/Dealer |
$XBD |
105.55 |
-1.02 |
-0.96% |
-13.14% |
| Retail |
$RLX |
520.57 |
+7.11 |
+1.38% |
+2.40% |
| Gold & Silver |
$XAU |
196.47 |
-1.79 |
-0.90% |
-13.29% |
| Bank |
$BKX |
46.79 |
-0.50 |
-1.06% |
-10.38% |
| Biotech |
$BTK |
1,430.34 |
+4.58 |
+0.32% |
+10.23% |
|
|
|
 |
Outlier Tallied Big Gains and Deserves Time to Deliver More
Kenneth J. Gruneisen - Passed the CAN SLIM® Master's Exam
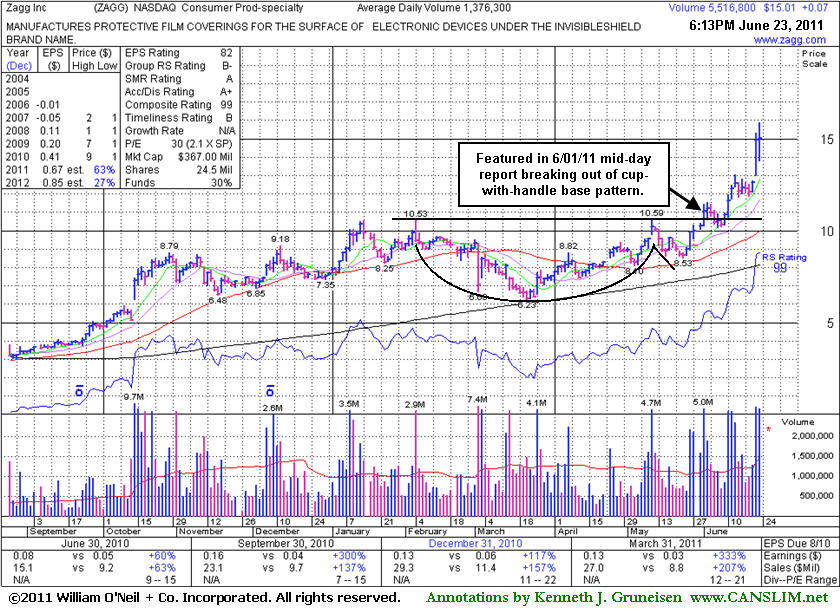
Zagg Inc (ZAGG +$0.08 or +0.56% to $15.02) hit yet another new all-time high today, overcoming a gap down for an early loss. A gap up and considerable volume-driven gain on 6/22/11 came after news it bought privately held mobile device accessories company iFrogz Inc for about $105 million. Now it is very extended from a sound base, and prior highs define initial support to watch on pullbacks. The high-ranked Consumer Product - Specialty firm was first featured in the 6/01/11 mid-day report as it broke out from a cup-with-handle type base. There was heavy volume behind its 4th consecutive gain as it triggered a technical buy signal. The FSU section on 6/01/11 included an annotated graph below the headline, "Bullish Action is a Good Start, But Broader Market is a Major Factor". The stock has been unhindered by resistance due overhead supply, but most of the time since it was featured the M criteria has been a concern. Typically 3 out of 4 stocks follow the direction of the broader market, so this outlier has clearly been the exception, rather than the rule, in recent weeks.
Strong quarterly and annual earnings increases satisfy the C and A criteria. The number of top-rated funds owning its shares rose from 13 in Jun '10 to 53 in Mar '11, a reassuring sign concerning the I criteria. As always, strict buying and selling rules must always be followed in order to maximize gains and minimize losses. In the Certification they teach investors to adhere to a rule of holding stocks for a minimum of at least 8 weeks whenever they rise more than +20% in the first 2-3 weeks after they are first bought. Stocks that quickly tallied such large gains have historically proven to produce some of the stock market's biggest gains. Disciplined investors never chase stocks that are extended from a sound base, however they might watch for secondary buy points to develop and be noted.
 |
|
|
Color Codes Explained :
Y - Better candidates highlighted by our
staff of experts.
G - Previously featured
in past reports as yellow but may no longer be buyable under the
guidelines.
***Last / Change / Volume data in this table is the closing quote data***
Symbol/Exchange
Company Name
Industry Group |
PRICE |
CHANGE
(%Change) |
Day High |
Volume
(% DAV)
(% 50 day avg vol) |
52 Wk Hi
% From Hi |
Featured
Date |
Price
Featured |
Pivot Featured |
|
Max Buy |
CACC
-
NASDAQ
Credit Acceptance Corp
FINANCIAL SERVICES - Credit Services
|
$80.07
|
-0.14
-0.17% |
$80.30
|
19,686
50.48% of 50 DAV
50 DAV is 39,000
|
$82.29
-2.70%
|
6/2/2011
|
$76.10
|
PP = $82.39
|
|
MB = $86.51
|
Most Recent Note - 6/20/2011 1:34:45 PM
Y - High-ranked leader in the Finance - Consumer Loans industry is consolidating above its 50 DMA line. It faces little resistance due to overhead supply while now perched -4.2% off its 52-week high. Its color code was changed back to yellow after its recent resilience. Disciplined investors may watch for gains above its recent highs and wait for a follow-through day to confirm a new rally. Meanwhile, recent lows near $75 define important support to watch.
>>> The latest Featured Stock Update with an annotated graph appeared on 6/6/2011. Click here.
View all notes |
Alert me of new notes |
CANSLIM.net Company Profile |
SEC |
Zacks Reports |
StockTalk |
News |
Chart |
Request a new note
C
A N
S L
I M


|
CMG
-
NYSE
Chipotle Mexican Grill
LEISURE - Restaurants
|
$290.78
|
+6.32
2.22% |
$291.55
|
1,016,308
98.07% of 50 DAV
50 DAV is 1,036,300
|
$295.99
-1.76%
|
4/1/2011
|
$274.00
|
PP = $275.10
|
|
MB = $288.86
|
 Most Recent Note - 6/23/2011 4:59:28 PM
G - Managed a positive reversal today after a small gap down. Closed -1.8% of its all-time high, but it has not formed a sound new base pattern. An upward trendline connecting its July 2010 and May 2011 lows defines an initial technical support level to watch.
>>> The latest Featured Stock Update with an annotated graph appeared on 6/15/2011. Click here.
View all notes |
Alert me of new notes |
CANSLIM.net Company Profile |
SEC |
Zacks Reports |
StockTalk |
News |
Chart |
Request a new note
C
A N
S L
I M
|
EZPW
-
NASDAQ
Ezcorp Inc Cl A
SPECIALTY RETAIL - Specialty Retail, Other
|
$31.87
|
+0.70
2.25% |
$31.87
|
458,164
137.26% of 50 DAV
50 DAV is 333,800
|
$33.31
-4.32%
|
6/13/2011
|
$31.18
|
PP = $33.41
|
|
MB = $35.08
|
Most Recent Note - 6/23/2011 5:02:30 PM
Y - Managed a positive reversal today after a small gap down, finishing at the session high and only -4.3% from its all-time high. Finding support near its 50 DMA line, and its recent lows also help define important near-term chart support in the $29 area.
>>> The latest Featured Stock Update with an annotated graph appeared on 6/13/2011. Click here.
View all notes |
Alert me of new notes |
CANSLIM.net Company Profile |
SEC |
Zacks Reports |
StockTalk |
News |
Chart |
Request a new note
C
A N
S L
I M
|
FCFS
-
NASDAQ
First Cash Financial Svs
SPECIALTY RETAIL - Specialty Retail, Other
|
$39.02
|
+0.06
0.15% |
$39.30
|
247,651
132.36% of 50 DAV
50 DAV is 187,100
|
$42.36
-7.88%
|
5/31/2011
|
$42.00
|
PP = $40.23
|
|
MB = $42.24
|
Most Recent Note - 6/22/2011 6:46:46 PM
G - Lost ground today on lighter than average volume. Its 50 DMA line and prior lows in the $37 area define support to watch. See the latest FSU analysis for more details and a new annotated graph.
>>> The latest Featured Stock Update with an annotated graph appeared on 6/22/2011. Click here.
View all notes |
Alert me of new notes |
CANSLIM.net Company Profile |
SEC |
Zacks Reports |
StockTalk |
News |
Chart |
Request a new note
C
A N
S L
I M
|
FOSL
-
NASDAQ
Fossil Inc
CONSUMER DURABLES - Recreational Goods, Other
|
$114.77
|
+2.34
2.08% |
$115.00
|
851,227
114.49% of 50 DAV
50 DAV is 743,500
|
$114.80
-0.03%
|
2/1/2011
|
$73.30
|
PP = $74.44
|
|
MB = $78.16
|
Most Recent Note - 6/23/2011 5:06:21 PM
G - Hit another new all-time high after a positive reversal today. Inching higher after 5 weeks of trading in a very tight range forming a "late-stage" base. Recent lows near $99 define important support to watch just below its 50 DMA line.
>>> The latest Featured Stock Update with an annotated graph appeared on 6/7/2011. Click here.
View all notes |
Alert me of new notes |
CANSLIM.net Company Profile |
SEC |
Zacks Reports |
StockTalk |
News |
Chart |
Request a new note
C
A N
S L
I M
|
Symbol/Exchange
Company Name
Industry Group |
PRICE |
CHANGE
(%Change) |
Day High |
Volume
(% DAV)
(% 50 day avg vol) |
52 Wk Hi
% From Hi |
Featured
Date |
Price
Featured |
Pivot Featured |
|
Max Buy |
HS
-
NYSE
Healthspring Inc
HEALTH SERVICES - Health Care Plans
|
$45.92
|
-0.24
-0.52% |
$46.20
|
1,048,917
120.25% of 50 DAV
50 DAV is 872,300
|
$47.78
-3.89%
|
6/16/2011
|
$42.44
|
PP = $45.21
|
|
MB = $47.47
|
Most Recent Note - 6/22/2011 12:48:06 PM
Y - Gapped up today, rising to a new all-time high near its "max buy" level. Finished strong on the prior session following a gap up gain, rising above its new pivot point previously noted for a 4th consecutive gain backed by +91% above average volume, technically triggering a new (or add-on) buy signal.
>>> The latest Featured Stock Update with an annotated graph appeared on 6/16/2011. Click here.
View all notes |
Alert me of new notes |
CANSLIM.net Company Profile |
SEC |
Zacks Reports |
StockTalk |
News |
Chart |
Request a new note
C
A N
S L
I M
|
INFA
-
NASDAQ
Informatica Corp
COMPUTER SOFTWARE and SERVICES - Business Software and Services
|
$57.41
|
+0.97
1.72% |
$57.58
|
958,471
74.65% of 50 DAV
50 DAV is 1,284,000
|
$59.98
-4.28%
|
3/24/2011
|
$50.04
|
PP = $49.86
|
|
MB = $52.35
|
Most Recent Note - 6/23/2011 4:55:46 PM
G - Managed a positive reversal today after a small gap down. Recently found support near its 50 DMA line. This high-ranked Computer Software - Database firm has not formed a sound new base pattern.
>>> The latest Featured Stock Update with an annotated graph appeared on 6/17/2011. Click here.
View all notes |
Alert me of new notes |
CANSLIM.net Company Profile |
SEC |
Zacks Reports |
StockTalk |
News |
Chart |
Request a new note
C
A N
S L
I M
|
LULU
-
NASDAQ
Lululemon Athletica
MANUFACTURING - Textile Manufacturing
|
$106.70
|
+5.33
5.26% |
$106.75
|
3,168,144
157.38% of 50 DAV
50 DAV is 2,013,000
|
$104.92
1.70%
|
6/21/2011
|
$102.95
|
PP = $101.14
|
|
MB = $106.20
|
Most Recent Note - 6/23/2011 12:30:36 PM
Y - Holding its ground, poised for a best-ever close today. Hit new 52-week and all-time highs as it was featured again in the 6/21/11 mid-day report highlighted in yellow with new pivot point cited based on a "double bottom" base formed over the past 9 weeks. See the latest FSU analysis for more details and a new annotated graph.
>>> The latest Featured Stock Update with an annotated graph appeared on 6/21/2011. Click here.
View all notes |
Alert me of new notes |
CANSLIM.net Company Profile |
SEC |
Zacks Reports |
StockTalk |
News |
Chart |
Request a new note
C
A N
S L
I M
|
MWIV
-
NASDAQ
M W I Veterinary Supply
HEALTH SERVICES - Medical Instruments and; Supplies
|
$81.60
|
+1.35
1.68% |
$81.85
|
35,444
42.00% of 50 DAV
50 DAV is 84,400
|
$86.99
-6.20%
|
11/4/2010
|
$61.79
|
PP = $59.60
|
|
MB = $62.58
|
Most Recent Note - 6/22/2011 5:48:53 PM
G - It may be forming a new base, however gains have lacked volume conviction following its 50 DMA line violation, and that short-term average is now acting as a resistance level. A gain above it is needed for its outlook to improve.
>>> The latest Featured Stock Update with an annotated graph appeared on 6/9/2011. Click here.
View all notes |
Alert me of new notes |
CANSLIM.net Company Profile |
SEC |
Zacks Reports |
StockTalk |
News |
Chart |
Request a new note
C
A N
S L
I M
|
OPNT
-
NASDAQ
Opnet Technologies
INTERNET - Internet Software and Services
|
$38.94
|
+0.66
1.72% |
$39.00
|
53,465
44.52% of 50 DAV
50 DAV is 120,100
|
$42.51
-8.40%
|
5/11/2011
|
$41.21
|
PP = $40.50
|
|
MB = $42.53
|
Most Recent Note - 6/21/2011 2:37:11 PM
G - Today's gain without great volume conviction has it rising back above its 50 DMA line which recently has acted as resistance. Subsequent deterioration under its earlier chart low ($35.13 on 4/12/11) would raise more serious concerns.
>>> The latest Featured Stock Update with an annotated graph appeared on 6/10/2011. Click here.
View all notes |
Alert me of new notes |
CANSLIM.net Company Profile |
SEC |
Zacks Reports |
StockTalk |
News |
Chart |
Request a new note
C
A N
S L
I M
|
Symbol/Exchange
Company Name
Industry Group |
PRICE |
CHANGE
(%Change) |
Day High |
Volume
(% DAV)
(% 50 day avg vol) |
52 Wk Hi
% From Hi |
Featured
Date |
Price
Featured |
Pivot Featured |
|
Max Buy |
OTEX
-
NASDAQ
Open Text Corp
INTERNET - Internet Software and Services
|
$61.35
|
+0.28
0.46% |
$61.63
|
261,614
82.45% of 50 DAV
50 DAV is 317,300
|
$67.08
-8.54%
|
6/1/2011
|
$65.86
|
PP = $67.18
|
|
MB = $70.54
|
Most Recent Note - 6/21/2011 2:39:36 PM
G - Technically, today's gain has it rallying back near its 50 DMA line which may now act as resistance. It faces overhead supply up through $66 after trading at higher levels in recent months.
>>> The latest Featured Stock Update with an annotated graph appeared on 6/2/2011. Click here.
View all notes |
Alert me of new notes |
CANSLIM.net Company Profile |
SEC |
Zacks Reports |
StockTalk |
News |
Chart |
Request a new note
C
A N
S L
I M
|
SWI
-
NYSE
Solarwinds Inc
COMPUTER SOFTWARE and SERVICES - Application Software
|
$25.34
|
-0.32
-1.25% |
$25.36
|
1,064,250
143.97% of 50 DAV
50 DAV is 739,200
|
$26.68
-5.02%
|
6/7/2011
|
$24.22
|
PP = $25.05
|
|
MB = $26.30
|
Most Recent Note - 6/22/2011 1:16:09 PM
Y - Consolidating above its pivot point today following a volume-driven gain on the prior session. Following its recent breakout there was a worrisome negative reversal on 6/15/11 with volume 4 times average after hitting a new 52-week high. Prior resistance in the $24-25 area acted as a support level.
>>> The latest Featured Stock Update with an annotated graph appeared on 6/8/2011. Click here.
View all notes |
Alert me of new notes |
CANSLIM.net Company Profile |
SEC |
Zacks Reports |
StockTalk |
News |
Chart |
Request a new note
C
A N
S L
I M
|
ULTA
-
NASDAQ
Ulta Salon Cosm & Frag
SPECIALTY RETAIL - Specialty Retail, Other
|
$62.58
|
+1.09
1.77% |
$62.83
|
913,076
123.42% of 50 DAV
50 DAV is 739,800
|
$62.69
-0.18%
|
1/6/2011
|
$36.12
|
PP = $37.34
|
|
MB = $39.21
|
Most Recent Note - 6/21/2011 12:59:09 PM
G - Gain today for a new all-time high, getting more extended from any sound base pattern. It may produce more climactic gains, but disciplined investors avoid chasing extended stocks.
>>> The latest Featured Stock Update with an annotated graph appeared on 6/20/2011. Click here.
View all notes |
Alert me of new notes |
CANSLIM.net Company Profile |
SEC |
Zacks Reports |
StockTalk |
News |
Chart |
Request a new note
C
A N
S L
I M
|
ZAGG
-
NASDAQ
Zagg Inc
SPECIALTY RETAIL - Specialty Retail, Other
|
$15.02
|
+0.08
0.56% |
$15.85
|
5,551,900
403.39% of 50 DAV
50 DAV is 1,376,300
|
$15.30
-1.83%
|
6/1/2011
|
$10.92
|
PP = $10.59
|
|
MB = $11.12
|
Most Recent Note - 6/23/2011 12:45:47 PM
G - Hit yet another new all-time high today, overcoming a gap down for an early loss. Considerable volume-driven gains came after news it bought privately held mobile device accessories company iFrogz Inc for about $105 million. It is extended from a sound base, and prior highs define initial support to watch on pullbacks.
>>> The latest Featured Stock Update with an annotated graph appeared on 6/23/2011. Click here.
View all notes |
Alert me of new notes |
CANSLIM.net Company Profile |
SEC |
Zacks Reports |
StockTalk |
News |
Chart |
Request a new note
C
A N
S L
I M
|
|
|
|
THESE ARE NOT BUY RECOMMENDATIONS!
Comments contained in the body of this report are technical
opinions only. The material herein has been obtained
from sources believed to be reliable and accurate, however,
its accuracy and completeness cannot be guaranteed.
This site is not an investment advisor, hence it does
not endorse or recommend any securities or other investments.
Any recommendation contained in this report may not
be suitable for all investors and it is not to be deemed
an offer or solicitation on our part with respect to
the purchase or sale of any securities. All trademarks,
service marks and trade names appearing in this report
are the property of their respective owners, and are
likewise used for identification purposes only.
This report is a service available
only to active Paid Premium Members.
You may opt-out of receiving report notifications
at any time. Questions or comments may be submitted
by writing to Premium Membership Services 665 S.E. 10 Street, Suite 201 Deerfield Beach, FL 33441-5634 or by calling 1-800-965-8307
or 954-785-1121.
|
|
|

