You are not logged in.
This means you
CAN ONLY VIEW reports that were published prior to Monday, April 14, 2025.
You
MUST UPGRADE YOUR MEMBERSHIP if you want to see any current reports.
AFTER MARKET UPDATE - WEDNESDAY, JUNE 22ND, 2011
Previous After Market Report Next After Market Report >>>
|
|
|
|
DOW |
-80.34 |
12,109.67 |
-0.66% |
|
Volume |
856,369,550 |
+1% |
|
Volume |
1,583,885,440 |
-13% |
|
NASDAQ |
-18.07 |
2,669.19 |
-0.67% |
|
Advancers |
1,233 |
39% |
|
Advancers |
874 |
33% |
|
S&P 500 |
-8.38 |
1,287.14 |
-0.65% |
|
Decliners |
1,776 |
57% |
|
Decliners |
1,716 |
64% |
|
Russell 2000 |
-6.50 |
799.87 |
-0.81% |
|
52 Wk Highs |
66 |
|
|
52 Wk Highs |
58 |
|
|
S&P 600 |
-3.26 |
429.96 |
-0.75% |
|
52 Wk Lows |
23 |
|
|
52 Wk Lows |
41 |
|
|
 |
Stocks Fall After Fed Lowers GDP Forecast
Kenneth J. Gruneisen - Passed the CAN SLIM® Master's Exam
While the major averages lost ground on Wednesday, the volume total was reported lower on the Nasdaq exchange, and the NYSE volume total was near the prior session's total. Declining issues beat advancers by 4-3 on the NYSE and by 2-1 on the Nasdaq exchange. For a second consecutive session new 52-week highs outnumbered new 52-week lows on both the Nasdaq exchange and the NYSE. There were 41 high-ranked companies from the CANSLIM.net Leaders List that made new 52-week highs and appeared on the CANSLIM.net BreakOuts Page, one notch above the total of 40 on the prior session. However, only 2 of the 14 of the high-ranked leaders currently included on the Featured Stocks Page posted gains.
The Federal Open Market Committee downgraded its assessment of the economic recovery, but offered no new steps to improve growth or jobs. The central bank repeated a pledge to keep interest rates low for an extended period and said inflation pressures appear to be temporary. The major averages drifted steadily lower during the afternoon as Wall Street received the cautious forecast from the Federal Reserve. During Chairman Bernanke's press conference he announced that the Fed now believes 2011 Gross Domestic Product (GDP) growth will range from 2.7% to 2.9%, down from the range of 3.1% to 3.3% that was announced in April.
Encouraging comments from FedEx Corp (FDX +2.59%) included a positive earnings report and promising outlook. Earnings and revenue topped expectations for the shipping giant and the news inspired optimism in transportation sector shares. D.R. Horton Inc (DHI +1.4%) and other homebuilders also advanced after the Federal Housing Finance Agency said prices gained in April from a month earlier. Analysts were expecting a decline. Meanwhile, Adobe Systems Inc (ADBE -6.25%) was hurt after giving a disappointing forecast.
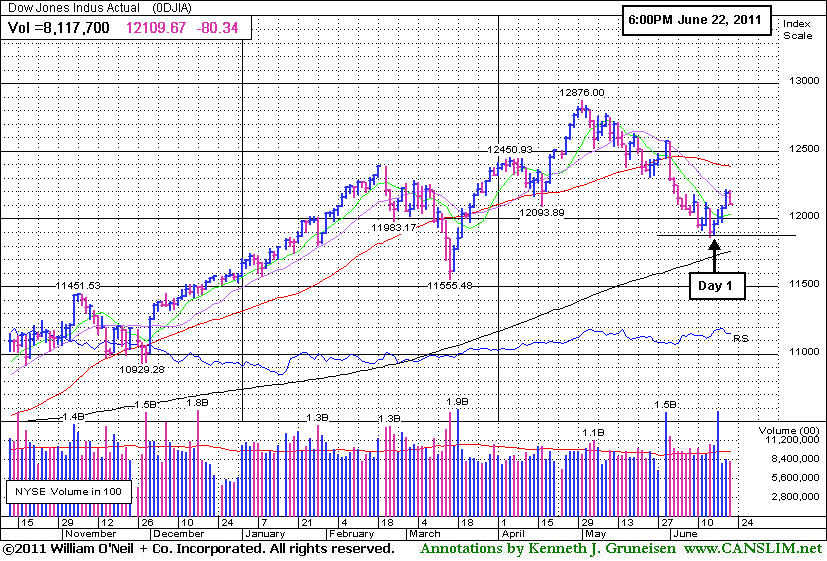
The S&P 500 Index's +1.34% gain on Tuesday was considered a questionable gain borderline with the minimum gain expected for a follow-through day (FTD). On Tuesday the S&P 400 Mid-Cap Index and S&P 600 Small-Cap Index both posted +1.9% gains on Day 3 and Day 4 of their rally attempts, respectively. The strength in small stocks and expansion in the new 52-week highs list was noted as an encouraging sign for growth-oriented investors who might cautiously look to accumulate ideal buy candidates, however the newspaper summarized the latest action with the conclusion that the broader market (M criteria) still remains in a correction. Thursday's session will mark Day 4 of the Nasdaq Composite Index's rally attempt.
A follow-through day (FTD) occurring between Day 4 and Day 7 of a new rally is considered the most ideal confirmation of a new rally attempt. As previously explained, to produce a solid FTD there should be a gain of at least +1.4% or more from at least one of the major averages, and the gain must come with higher volume and an expansion in leadership (new 52-week highs). Meanwhile, any deterioration under the Day 1 lows would officially end the nascent rally attempt and signal that the market's correction is continuing.
Upgraded members will have access to the upcoming Q2 2011 Webcast scheduled for Wednesday, June 29th at 8PM EST and the July 2011 issue of CANSLIM.net News to be released soon afterward.
PICTURED: The Dow Jones Industrial Average's loss marked Day 5 of its rally attempt.
|
 Kenneth J. Gruneisen started out as a licensed stockbroker in August 1987, a couple of months prior to the historic stock market crash that took the Dow Jones Industrial Average down -22.6% in a single day. He has published daily fact-based fundamental and technical analysis on high-ranked stocks online for two decades. Through FACTBASEDINVESTING.COM, Kenneth provides educational articles, news, market commentary, and other information regarding proven investment systems that work in good times and bad.
Comments contained in the body of this report are technical opinions only and are not necessarily those of Gruneisen Growth Corp. The material herein has been obtained from sources believed to be reliable and accurate, however, its accuracy and completeness cannot be guaranteed. Our firm, employees, and customers may effect transactions, including transactions contrary to any recommendation herein, or have positions in the securities mentioned herein or options with respect thereto. Any recommendation contained in this report may not be suitable for all investors and it is not to be deemed an offer or solicitation on our part with respect to the purchase or sale of any securities. |
|
 |
Tech, Retail, and Influential Financial Groups Fell
Kenneth J. Gruneisen - Passed the CAN SLIM® Master's Exam
Weakness in the Retail Index ($RLX -1.14%) and influential financial shares' losses dragged the Broker/Dealer Index ($XBD -1.03%) and Bank Index ($BKX -0.92%) lower, weighing on the major averages. The Healthcare Index ($HMO -0.92%) backpedaled while the Gold & Silver Index ($XAU +0.77%) posted a gain and energy related shares were mixed as the Integrated Oil Index ($XOI -0.48%) edged lower and the Oil Services Index ($OSX +0.39%) edged higher. The tech sector's Internet Index ($IIX -0.85%), Networking Index ($NWX -0.72%), and Semiconductor Index ($SOX -0.47%) lost ground and the Biotechnology Index ($BTK -0.02%) finished flat.
Charts courtesy www.stockcharts.com
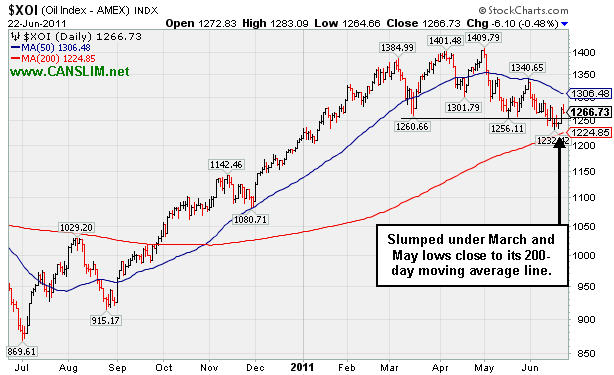
PICTURED: The Integrated Oil Index ($XOI -0.48%) recently slumped under March and May lows toward its 200-day moving average (DMA) line.
| Oil Services |
$OSX |
255.79 |
+0.99 |
+0.39% |
+4.35% |
| Healthcare |
$HMO |
2,385.90 |
-22.24 |
-0.92% |
+41.01% |
| Integrated Oil |
$XOI |
1,266.73 |
-6.10 |
-0.48% |
+4.42% |
| Semiconductor |
$SOX |
396.73 |
-1.88 |
-0.47% |
-3.66% |
| Networking |
$NWX |
287.95 |
-2.08 |
-0.72% |
+2.63% |
| Internet |
$IIX |
297.13 |
-2.55 |
-0.85% |
-3.44% |
| Broker/Dealer |
$XBD |
106.57 |
-1.11 |
-1.03% |
-12.30% |
| Retail |
$RLX |
513.46 |
-5.93 |
-1.14% |
+1.00% |
| Gold & Silver |
$XAU |
198.26 |
+1.52 |
+0.77% |
-12.50% |
| Bank |
$BKX |
47.29 |
-0.44 |
-0.92% |
-9.42% |
| Biotech |
$BTK |
1,425.77 |
-0.24 |
-0.02% |
+9.87% |
|
|
|
 |
Faltering After Breakout Yet Finding Support
Kenneth J. Gruneisen - Passed the CAN SLIM® Master's Exam
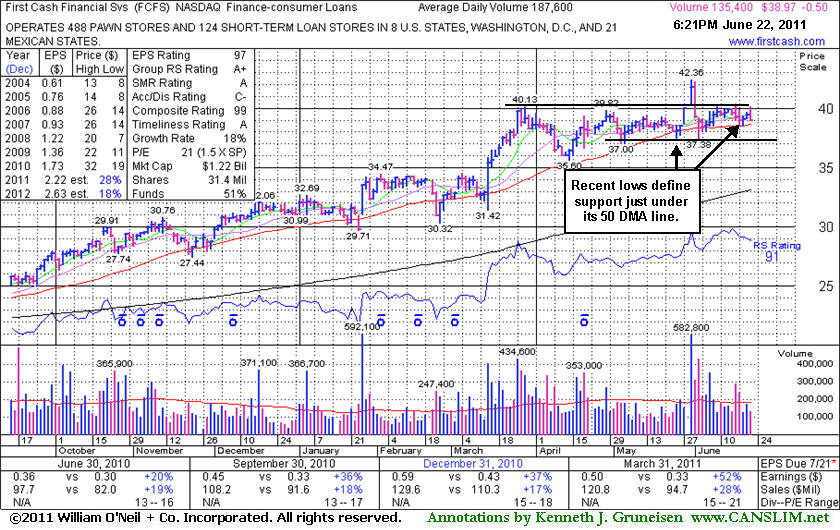
First Cash Financial Services Inc. (FCFS -$0.51 or -1.29% to $38.96) lost ground today on lighter than average volume. Its 50-day moving average (DMA) line defines initial support to watch while its recent lows in the $37 area also define nearby support. Its color code was changed to green after damaging losses on higher volume negated its latest breakout. Its last appearance in this FSU section was on 5/31/11 with an annotated graph under the headline, "Fresh Technical Breakout From Firm in Finance - Consumer Loans Industry", as it gapped up today and hit a new 52-week high, rising from an orderly flat base pattern with 3 times average volume triggering a technical buy signal.
It was color coded yellow with pivot point cited based on its 52-week high plus ten cents when featured in the 5/31/11 mid-day report (read here). It reported earnings +52% on +28% sales revenues for the quarter ended March 31, 2011 versus the year ago period. Its annual earnings (A criteria) history has been steady. The number of top-rated funds owning its shares rose slightly from 336 in Jun '10 to 349 in Mar '11.
The major averages' recent gains were coupled with higher volume totals on the major exchanges and an expansion in the number of stocks hitting new 52-week highs. While the action signaled accumulation, a more convincing follow-through day (FTD) of gains from at least one of the major averages is still needed to confirm a substantial improvement in the M criteria (market direction).
|
|
|
Color Codes Explained :
Y - Better candidates highlighted by our
staff of experts.
G - Previously featured
in past reports as yellow but may no longer be buyable under the
guidelines.
***Last / Change / Volume data in this table is the closing quote data***
Symbol/Exchange
Company Name
Industry Group |
PRICE |
CHANGE
(%Change) |
Day High |
Volume
(% DAV)
(% 50 day avg vol) |
52 Wk Hi
% From Hi |
Featured
Date |
Price
Featured |
Pivot Featured |
|
Max Buy |
CACC
-
NASDAQ
Credit Acceptance Corp
FINANCIAL SERVICES - Credit Services
|
$80.21
|
-0.30
-0.37% |
$80.69
|
21,217
54.26% of 50 DAV
50 DAV is 39,100
|
$82.29
-2.53%
|
6/2/2011
|
$76.10
|
PP = $82.39
|
|
MB = $86.51
|
Most Recent Note - 6/20/2011 1:34:45 PM
Y - High-ranked leader in the Finance - Consumer Loans industry is consolidating above its 50 DMA line. It faces little resistance due to overhead supply while now perched -4.2% off its 52-week high. Its color code was changed back to yellow after its recent resilience. Disciplined investors may watch for gains above its recent highs and wait for a follow-through day to confirm a new rally. Meanwhile, recent lows near $75 define important support to watch.
>>> The latest Featured Stock Update with an annotated graph appeared on 6/6/2011. Click here.
View all notes |
Alert me of new notes |
CANSLIM.net Company Profile |
SEC |
Zacks Reports |
StockTalk |
News |
Chart |
Request a new note
C
A N
S L
I M


|
CMG
-
NYSE
Chipotle Mexican Grill
LEISURE - Restaurants
|
$284.46
|
-0.79
-0.28% |
$289.82
|
545,932
52.75% of 50 DAV
50 DAV is 1,034,900
|
$295.99
-3.90%
|
4/1/2011
|
$274.00
|
PP = $275.10
|
|
MB = $288.86
|
Most Recent Note - 6/21/2011 2:31:46 PM
G - Rising back above its 50 DMA line today and trading within -4.5% of its all-time high, but it has not formed a sound new base pattern. An upward trendline connecting its July 2010 and May 2011 lows defines an initial technical support level to watch.
>>> The latest Featured Stock Update with an annotated graph appeared on 6/15/2011. Click here.
View all notes |
Alert me of new notes |
CANSLIM.net Company Profile |
SEC |
Zacks Reports |
StockTalk |
News |
Chart |
Request a new note
C
A N
S L
I M
|
EZPW
-
NASDAQ
Ezcorp Inc Cl A
SPECIALTY RETAIL - Specialty Retail, Other
|
$31.17
|
-0.23
-0.73% |
$31.81
|
190,703
55.01% of 50 DAV
50 DAV is 346,700
|
$33.31
-6.42%
|
6/13/2011
|
$31.18
|
PP = $33.41
|
|
MB = $35.08
|
Most Recent Note - 6/21/2011 2:34:38 PM
Y - Finding support near its 50 DMA line recently, and today's gain has it trading -5.5% from its all-time high. Recent lows also help define important near-term chart support in the $29 area.
>>> The latest Featured Stock Update with an annotated graph appeared on 6/13/2011. Click here.
View all notes |
Alert me of new notes |
CANSLIM.net Company Profile |
SEC |
Zacks Reports |
StockTalk |
News |
Chart |
Request a new note
C
A N
S L
I M
|
FCFS
-
NASDAQ
First Cash Financial Svs
SPECIALTY RETAIL - Specialty Retail, Other
|
$38.96
|
-0.51
-1.29% |
$40.16
|
140,227
74.75% of 50 DAV
50 DAV is 187,600
|
$42.36
-8.02%
|
5/31/2011
|
$42.00
|
PP = $40.23
|
|
MB = $42.24
|
 Most Recent Note - 6/22/2011 6:46:46 PM
G - Lost ground today on lighter than average volume. Its 50 DMA line and prior lows in the $37 area define support to watch. See the latest FSU analysis for more details and a new annotated graph.
>>> The latest Featured Stock Update with an annotated graph appeared on 6/22/2011. Click here.
View all notes |
Alert me of new notes |
CANSLIM.net Company Profile |
SEC |
Zacks Reports |
StockTalk |
News |
Chart |
Request a new note
C
A N
S L
I M
|
FOSL
-
NASDAQ
Fossil Inc
CONSUMER DURABLES - Recreational Goods, Other
|
$112.43
|
-1.37
-1.20% |
$114.80
|
461,442
61.80% of 50 DAV
50 DAV is 746,700
|
$114.45
-1.76%
|
2/1/2011
|
$73.30
|
PP = $74.44
|
|
MB = $78.16
|
Most Recent Note - 6/21/2011 12:20:24 PM
G - Hitting another new high today, inching higher after 5 weeks of trading in a very tight range forming a "late-stage" base. Recent lows near $99 define important support to watch just below its 50 DMA line.
>>> The latest Featured Stock Update with an annotated graph appeared on 6/7/2011. Click here.
View all notes |
Alert me of new notes |
CANSLIM.net Company Profile |
SEC |
Zacks Reports |
StockTalk |
News |
Chart |
Request a new note
C
A N
S L
I M
|
Symbol/Exchange
Company Name
Industry Group |
PRICE |
CHANGE
(%Change) |
Day High |
Volume
(% DAV)
(% 50 day avg vol) |
52 Wk Hi
% From Hi |
Featured
Date |
Price
Featured |
Pivot Featured |
|
Max Buy |
HS
-
NYSE
Healthspring Inc
HEALTH SERVICES - Health Care Plans
|
$46.16
|
+0.35
0.76% |
$47.78
|
1,601,679
187.70% of 50 DAV
50 DAV is 853,300
|
$46.63
-1.01%
|
6/16/2011
|
$42.44
|
PP = $45.21
|
|
MB = $47.47
|
Most Recent Note - 6/22/2011 12:48:06 PM
Y - Gapped up today, rising to a new all-time high near its "max buy" level. Finished strong on the prior session following a gap up gain, rising above its new pivot point previously noted for a 4th consecutive gain backed by +91% above average volume, technically triggering a new (or add-on) buy signal.
>>> The latest Featured Stock Update with an annotated graph appeared on 6/16/2011. Click here.
View all notes |
Alert me of new notes |
CANSLIM.net Company Profile |
SEC |
Zacks Reports |
StockTalk |
News |
Chart |
Request a new note
C
A N
S L
I M
|
INFA
-
NASDAQ
Informatica Corp
COMPUTER SOFTWARE and SERVICES - Business Software and Services
|
$56.44
|
-0.16
-0.28% |
$56.90
|
1,006,672
78.84% of 50 DAV
50 DAV is 1,276,800
|
$59.98
-5.90%
|
3/24/2011
|
$50.04
|
PP = $49.86
|
|
MB = $52.35
|
Most Recent Note - 6/20/2011 4:38:41 PM
G - Posted a second consecutive gain today with lighter volume, finding support near its 50 DMA line. Hit a new 52-week high on 6/01/11 but then there was a negative reversal noted. This high-ranked Computer Software - Database firm did not form a sound new base pattern.
>>> The latest Featured Stock Update with an annotated graph appeared on 6/17/2011. Click here.
View all notes |
Alert me of new notes |
CANSLIM.net Company Profile |
SEC |
Zacks Reports |
StockTalk |
News |
Chart |
Request a new note
C
A N
S L
I M
|
LULU
-
NASDAQ
Lululemon Athletica
MANUFACTURING - Textile Manufacturing
|
$101.37
|
-1.44
-1.40% |
$104.92
|
2,075,469
103.63% of 50 DAV
50 DAV is 2,002,700
|
$103.45
-2.01%
|
6/21/2011
|
$102.95
|
PP = $101.14
|
|
MB = $106.20
|
Most Recent Note - 6/21/2011 6:26:30 PM
Y - Finished strong after noted hitting new 52-week and all-time highs in today's mid-day report. Color code was changed to yellow with new pivot point cited based on a "double bottom" base formed over the past 9 weeks. See the latest FSU analysis for more details and a new annotated graph.
>>> The latest Featured Stock Update with an annotated graph appeared on 6/21/2011. Click here.
View all notes |
Alert me of new notes |
CANSLIM.net Company Profile |
SEC |
Zacks Reports |
StockTalk |
News |
Chart |
Request a new note
C
A N
S L
I M
|
MWIV
-
NASDAQ
M W I Veterinary Supply
HEALTH SERVICES - Medical Instruments and; Supplies
|
$80.25
|
-0.66
-0.82% |
$81.74
|
30,284
35.75% of 50 DAV
50 DAV is 84,700
|
$86.99
-7.75%
|
11/4/2010
|
$61.79
|
PP = $59.60
|
|
MB = $62.58
|
Most Recent Note - 6/22/2011 5:48:53 PM
G - It may be forming a new base, however gains have lacked volume conviction following its 50 DMA line violation, and that short-term average is now acting as a resistance level. A gain above it is needed for its outlook to improve.
>>> The latest Featured Stock Update with an annotated graph appeared on 6/9/2011. Click here.
View all notes |
Alert me of new notes |
CANSLIM.net Company Profile |
SEC |
Zacks Reports |
StockTalk |
News |
Chart |
Request a new note
C
A N
S L
I M
|
OPNT
-
NASDAQ
Opnet Technologies
INTERNET - Internet Software and Services
|
$38.28
|
-0.23
-0.60% |
$38.89
|
66,951
55.29% of 50 DAV
50 DAV is 121,100
|
$42.51
-9.95%
|
5/11/2011
|
$41.21
|
PP = $40.50
|
|
MB = $42.53
|
Most Recent Note - 6/21/2011 2:37:11 PM
G - Today's gain without great volume conviction has it rising back above its 50 DMA line which recently has acted as resistance. Subsequent deterioration under its earlier chart low ($35.13 on 4/12/11) would raise more serious concerns.
>>> The latest Featured Stock Update with an annotated graph appeared on 6/10/2011. Click here.
View all notes |
Alert me of new notes |
CANSLIM.net Company Profile |
SEC |
Zacks Reports |
StockTalk |
News |
Chart |
Request a new note
C
A N
S L
I M
|
Symbol/Exchange
Company Name
Industry Group |
PRICE |
CHANGE
(%Change) |
Day High |
Volume
(% DAV)
(% 50 day avg vol) |
52 Wk Hi
% From Hi |
Featured
Date |
Price
Featured |
Pivot Featured |
|
Max Buy |
OTEX
-
NASDAQ
Open Text Corp
INTERNET - Internet Software and Services
|
$61.07
|
-0.42
-0.68% |
$61.33
|
250,035
78.78% of 50 DAV
50 DAV is 317,400
|
$67.08
-8.96%
|
6/1/2011
|
$65.86
|
PP = $67.18
|
|
MB = $70.54
|
Most Recent Note - 6/21/2011 2:39:36 PM
G - Technically, today's gain has it rallying back near its 50 DMA line which may now act as resistance. It faces overhead supply up through $66 after trading at higher levels in recent months.
>>> The latest Featured Stock Update with an annotated graph appeared on 6/2/2011. Click here.
View all notes |
Alert me of new notes |
CANSLIM.net Company Profile |
SEC |
Zacks Reports |
StockTalk |
News |
Chart |
Request a new note
C
A N
S L
I M
|
SWI
-
NYSE
Solarwinds Inc
COMPUTER SOFTWARE and SERVICES - Application Software
|
$25.66
|
-0.08
-0.31% |
$25.90
|
1,034,868
142.17% of 50 DAV
50 DAV is 727,900
|
$26.68
-3.82%
|
6/7/2011
|
$24.22
|
PP = $25.05
|
|
MB = $26.30
|
Most Recent Note - 6/22/2011 1:16:09 PM
Y - Consolidating above its pivot point today following a volume-driven gain on the prior session. Following its recent breakout there was a worrisome negative reversal on 6/15/11 with volume 4 times average after hitting a new 52-week high. Prior resistance in the $24-25 area acted as a support level.
>>> The latest Featured Stock Update with an annotated graph appeared on 6/8/2011. Click here.
View all notes |
Alert me of new notes |
CANSLIM.net Company Profile |
SEC |
Zacks Reports |
StockTalk |
News |
Chart |
Request a new note
C
A N
S L
I M
|
ULTA
-
NASDAQ
Ulta Salon Cosm & Frag
SPECIALTY RETAIL - Specialty Retail, Other
|
$61.49
|
-0.59
-0.95% |
$62.69
|
867,701
118.23% of 50 DAV
50 DAV is 733,900
|
$62.39
-1.44%
|
1/6/2011
|
$36.12
|
PP = $37.34
|
|
MB = $39.21
|
Most Recent Note - 6/21/2011 12:59:09 PM
G - Gain today for a new all-time high, getting more extended from any sound base pattern. It may produce more climactic gains, but disciplined investors avoid chasing extended stocks.
>>> The latest Featured Stock Update with an annotated graph appeared on 6/20/2011. Click here.
View all notes |
Alert me of new notes |
CANSLIM.net Company Profile |
SEC |
Zacks Reports |
StockTalk |
News |
Chart |
Request a new note
C
A N
S L
I M
|
ZAGG
-
NASDAQ
Zagg Inc
SPECIALTY RETAIL - Specialty Retail, Other
|
$14.94
|
+2.34
18.54% |
$15.30
|
7,241,729
580.87% of 50 DAV
50 DAV is 1,246,700
|
$13.05
14.45%
|
6/1/2011
|
$10.92
|
PP = $10.59
|
|
MB = $11.12
|
Most Recent Note - 6/22/2011 1:23:04 PM
G - Gapped up today and hit a new all-time high with a considerable volume-driven gain after news it bought privately held mobile device accessories company iFrogz Inc for about $105 million. It is very extended from the previously noted cup-with-handle type base pattern. Prior highs define initial support to watch on pullbacks.
>>> The latest Featured Stock Update with an annotated graph appeared on 6/1/2011. Click here.
View all notes |
Alert me of new notes |
CANSLIM.net Company Profile |
SEC |
Zacks Reports |
StockTalk |
News |
Chart |
Request a new note
C
A N
S L
I M
|
|
|
|
THESE ARE NOT BUY RECOMMENDATIONS!
Comments contained in the body of this report are technical
opinions only. The material herein has been obtained
from sources believed to be reliable and accurate, however,
its accuracy and completeness cannot be guaranteed.
This site is not an investment advisor, hence it does
not endorse or recommend any securities or other investments.
Any recommendation contained in this report may not
be suitable for all investors and it is not to be deemed
an offer or solicitation on our part with respect to
the purchase or sale of any securities. All trademarks,
service marks and trade names appearing in this report
are the property of their respective owners, and are
likewise used for identification purposes only.
This report is a service available
only to active Paid Premium Members.
You may opt-out of receiving report notifications
at any time. Questions or comments may be submitted
by writing to Premium Membership Services 665 S.E. 10 Street, Suite 201 Deerfield Beach, FL 33441-5634 or by calling 1-800-965-8307
or 954-785-1121.
|
|
|

