You are not logged in.
This means you
CAN ONLY VIEW reports that were published prior to Monday, April 14, 2025.
You
MUST UPGRADE YOUR MEMBERSHIP if you want to see any current reports.
AFTER MARKET UPDATE - MONDAY, JUNE 21ST, 2010
Previous After Market Report Next After Market Report >>>
|
|
|
|
DOW |
-8.23 |
10,442.41 |
-0.08% |
|
Volume |
1,068,428,060 |
-40% |
|
Volume |
1,849,554,470 |
-4% |
|
NASDAQ |
-20.71 |
2,289.09 |
-0.90% |
|
Advancers |
1,256 |
40% |
|
Advancers |
888 |
32% |
|
S&P 500 |
-4.31 |
1,113.20 |
-0.39% |
|
Decliners |
1,810 |
57% |
|
Decliners |
1,811 |
65% |
|
Russell 2000 |
-6.89 |
660.03 |
-1.03% |
|
52 Wk Highs |
105 |
|
|
52 Wk Highs |
79 |
|
|
S&P 600 |
-3.26 |
351.81 |
-0.92% |
|
52 Wk Lows |
9 |
|
|
52 Wk Lows |
46 |
|
|
 |
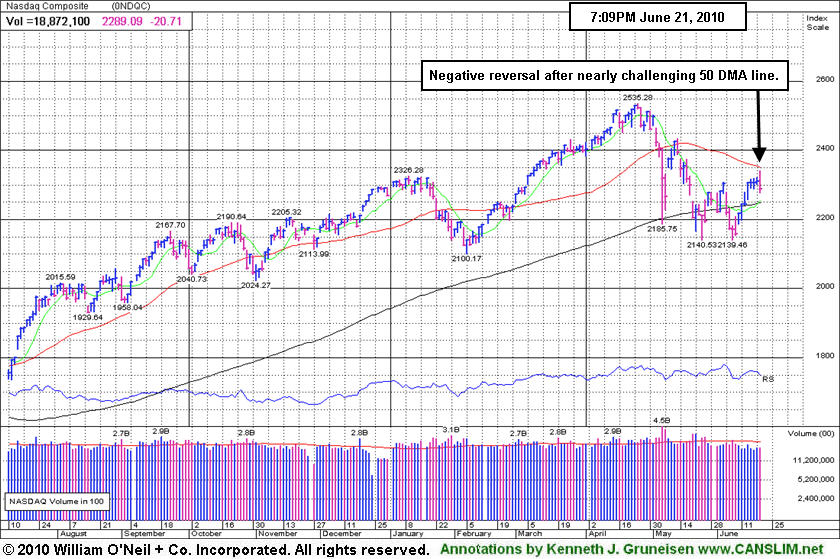
Negative Reversal After Early Gains And Enthusiasm Faded
Adam Sarhan, Contributing Writer,
Collectively, the major averages negatively reversed (opened higher and closed lower) on Monday after The People’s Bank of China pledged on June 19 to make the yuan more flexible. As expected, volume totals were reported lower on both major exchanges, down from Friday's quadruple witching levels. Decliners led advancers by a 3-to-2 ratio on the NYSE and by a 2-to-1 ratio on the Nasdaq exchange. There were 50 high-ranked companies from the CANSLIM.net Leaders List that made a new 52-week high and appeared on the CANSLIM.net BreakOuts Page, higher than the 33 issues that appeared on the prior session. New 52-week highs outnumbered new 52-week lows on the NYSE and on the Nasdaq exchange.
Overnight, Asian and European equities soared after China said it will allow its currency, the yuan, to be more flexible against the US dollar. Since the 2008 financial crisis, the yuan has been artificially pegged to the US dollar to protect Chinese exporters. During that time, a slew of Western governments, including the US, have pressured Beijing to remove the onerous peg but each time Beijing has dismissed their requests. It is important to note that China's economy is experiencing explosive growth and Beijing has taken several key measures in recent years to curb that robust growth. Allowing the yuan to be more flexible is simply another calculated measure to achieving that goal.
The news sent global stocks up for a 10th consecutive day which helped send the MSCI World Index to its longest rally in nearly a year. Gold continued its recent run and hit a fresh all-time high of $1,266.50 an ounce before backing off and closing lower on the day. An increasing number of high-ranked stocks have triggered fresh technical buy signals since last Tuesday's follow-through day (FTD) which bodes well for this nascent rally. Remember that now that a proper follow-through day has emerged the window will remain open for the next 13 weeks for the most ideal buying in high-ranked stocks as they trigger fresh technical buy signals.
It is also important to note that it was encouraging to also see the Dow Jones Industrial Average and the benchmark S&P 500 Index rally above their respective 200-day moving average (DMA) lines last week. The 200 DMA line should now act as support as this market continues advancing, while any reversal below that key technical level would be a worrisome sign.
Remember to remain very selective and disciplined because all of the major averages are still trading below their downward sloping 50-day moving average (DMA) lines which in earlier rally tries acted as resistance. It is also important to note that approximately 75% of FTDs lead to new sustained rallies, while 25% fail. In addition, every major rally in market history has begun with a FTD, but not every FTD leads to a new rally. Trade accordingly.
Are You Ready For This NEW Confirmed Rally?
Inquire Today About Our Professional Money Management Services:
If your portfolio is greater than $100,000 and you need assistance, click here to get connected with one of our portfolio managers. ** Serious inquires only, please.
PICTURED: The Nasdaq Composite Index broke a 7 session winning streak and erased its early gain for a negative reversal after it had nearly rallied back up to its 50 DMA line. An earlier rebound effort fizzled out when its short-term average line acted as resistance.
|
|
|
 |
Retail and Gold Indexes Among Weaker Performers
Kenneth J. Gruneisen - Passed the CAN SLIM® Master's Exam
The Retail Index ($RLX -1.71%) had a negative influence on the major averages as most industry groups reversed early gains and closed lower on Monday. Losses for the Broker/Dealer Index ($XBD -0.63%) and Bank Index ($BKX -0.22%) created a drag on the major averages.Meanwhile, commodity-linked groups also fell as the Gold & Silver Index ($XAU -2.17%) faced pressure and the Oil Services Index ($OSX -0.91%) and Integrated Oil Index ($XOI -0.29%) suffered small losses. The tech sector faced pressure as the Internet Index ($IIX -1.07%), Semiconductor Index ($SOX -0.85%), Biotechnology Index ($BTK -0.78%), and Networking Index ($NWX -0.70%) ended unanimously lower. The Healthcare Index ($HMO -0.82%) also slumped.
Charts courtesy www.stockcharts.com
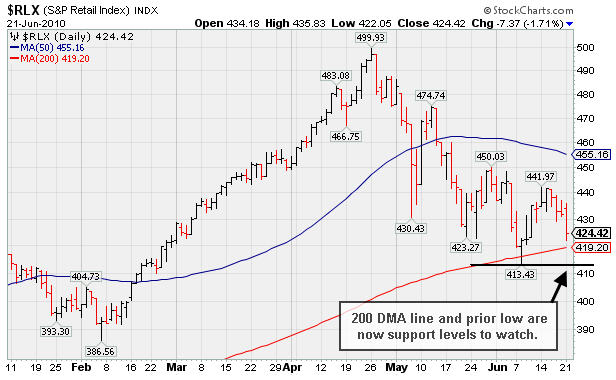
PICTURED: The Retail Index ($RLX -1.71%) suffered a 4th consecutive loss and fell toward its 200-day moving average (DMA) line. That long-term average and the recent chart low are now important support levels to watch, where subsequent deterioration would bode poorly for the overall market outlook.
| Oil Services |
$OSX |
181.95 |
-1.68 |
-0.91% |
-6.65% |
| Healthcare |
$HMO |
1,556.08 |
-12.83 |
-0.82% |
+5.64% |
| Integrated Oil |
$XOI |
974.77 |
-2.81 |
-0.29% |
-8.75% |
| Semiconductor |
$SOX |
368.04 |
-3.17 |
-0.85% |
+2.26% |
| Networking |
$NWX |
237.28 |
-1.68 |
-0.70% |
+2.69% |
| Internet |
$IIX |
241.48 |
-2.61 |
-1.07% |
+3.26% |
| Broker/Dealer |
$XBD |
105.52 |
-0.67 |
-0.63% |
-8.29% |
| Retail |
$RLX |
424.42 |
-7.37 |
-1.71% |
+3.24% |
| Gold & Silver |
$XAU |
181.60 |
-4.02 |
-2.17% |
+7.93% |
| Bank |
$BKX |
49.94 |
-0.11 |
-0.22% |
+16.93% |
| Biotech |
$BTK |
1,089.90 |
-8.55 |
-0.78% |
+15.68% |
|
|
|
 |
Usually Not Ideal Choices When Base Pattern Has Flaws
Kenneth J. Gruneisen - Passed the CAN SLIM® Master's Exam
The current market (M criteria) conditions have improved since a follow-through-day recently confirmed a new rally. That is not a reason to select stocks with flaws in their bases, and it is not a guarantee that perfect-looking leaders will go on to rally substantially either. Investors usually have the best odds when they remain disciplined and trade based upon the long-standing guidelines of the fact-based investment system.
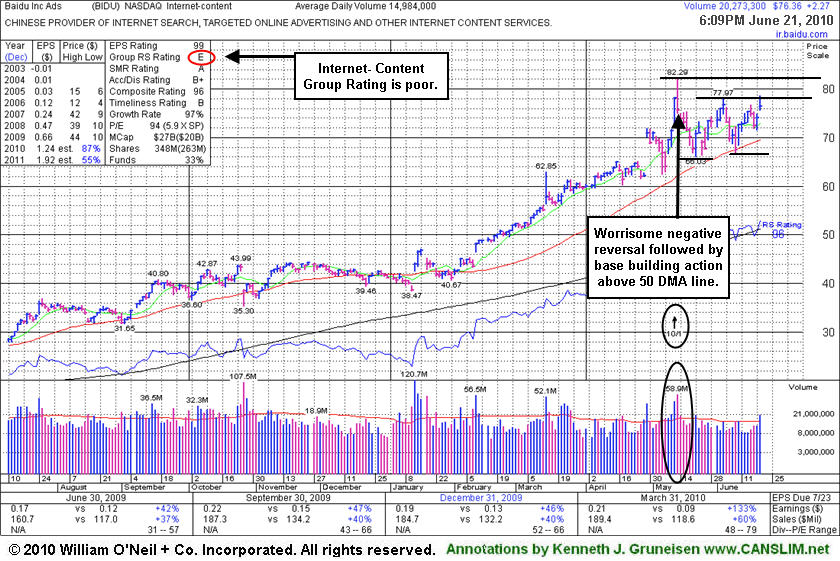
High-ranked Internet - Content firm Baidu.com, Inc. ( BIDU +$2.27 or +3.05% to $76.36) gapped up today and posted a gain with above average volume, but it closed in the lower third of its intra-day range, finishing the session below its 6/03/10 high (and closing price). In the paper it was recently labeled an "irregular double bottom" pattern with a pivot point based upon that day's high plus ten cents. Others might chose to call it a choppy 6-week base with a higher pivot point based upon its all-time high, or they might simply wait for a better base pattern to eventually form.
BIDU has a stellar sales and earnings history that satisfies the C & A criteria, in fact, the quarter ended March 31, 2010 showed sales revenues and earnings growth accelerating impressively. However, it saw a slight decline in the number of top-rated funds owning shares from being reported at 204 in Dec '09 to 201 in Mar '10. Another concern that makes it a less favorable candidate under the system guidelines is the lack of leadership (L criteria) in the group, with the Internet - Content group currently ranked very low. Yet, a reassuring characteristic to its consolidation is that it has found support at its 50-day moving average (DMA) line. Volume totals have also cooled behind recent distribution days since its worrisome negative reversal from its all-time high on 5/13/10. Its share price was impacted by a 10:1 stock split as of 5/12/10, and the split reduced the share price while it greatly increased the supply of shares (S criteria) outstanding. The best market winners typically has smaller supplies closer to its pre-split levels.
Keep in mind that BIDU has traded up more than 8-fold, and it has not been a smooth ride since it first featured on Monday, October 30, 2006 in the CANSLIM.net Mid Day Breakouts Report (read here). After making great progress it went through a multi-month consolidation under its 50 and 20 DMA lines, then later returned as a noteworthy leader featured in CANSLIM.net reports. An annotated graph showed a vivid picture at the beginning of the stock's period of greatest weakness back on January 11, 2008 under the headline, "Weakness Hurting Chances For Featured Favorite" (read here). Take a look back at that now! Remember that a dropped stock can be featured again in a future CANSLIM.net report if it repairs its technical damage and forms a new pivot point.
|
|
|
Color Codes Explained :
Y - Better candidates highlighted by our
staff of experts.
G - Previously featured
in past reports as yellow but may no longer be buyable under the
guidelines.
***Last / Change / Volume data in this table is the closing quote data***
Symbol/Exchange
Company Name
Industry Group |
PRICE |
CHANGE
(%Change) |
Day High |
Volume
(% DAV)
(% 50 day avg vol) |
52 Wk Hi
% From Hi |
Featured
Date |
Price
Featured |
Pivot Featured |
|
Max Buy |
AAPL
-
NASDAQ
Apple Inc
COMPUTER HARDWARE - Personal Computers
|
$270.17
|
-3.90
-1.42% |
$279.01
|
27,604,563
101.21% of 50 DAV
50 DAV is 27,273,700
|
$275.00
-1.76%
|
6/17/2010
|
$270.95
|
PP = $272.56
|
|
MB = $286.19
|
 Most Recent Note - 6/21/2010 5:46:51 PM
Y - Gapped up today and marked a new all-time high, then it negatively reversed, breaking a streak of 7 consecutive gains. In the 6/17/10 mid-day report (read here) it was featured again in yellow with a new pivot point cited based upon its all-time high plus ten cents while "working on the right side of a choppy 9-week consolidation marked by heavy distribution."
>>> The latest Featured Stock Update with an annotated graph appeared on 6/17/2010. Click here.
View all notes |
Alert me of new notes |
CANSLIM.net Company Profile |
SEC |
Zacks Reports |
StockTalk |
News |
Chart |
Request a new note
C
A N
S L
I M


|
APEI
-
NASDAQ
American Public Educ Inc
DIVERSIFIED SERVICES - Education and Training Services
|
$48.00
|
+0.01
0.02% |
$48.95
|
148,832
86.53% of 50 DAV
50 DAV is 172,000
|
$48.49
-1.01%
|
6/7/2010
|
$46.60
|
PP = $46.29
|
|
MB = $48.60
|
Most Recent Note - 6/21/2010 5:50:14 PM
Y - Gapped up today and hit a new 52-week high, then completely erased the gain and closed near the session low. Recently slumped near its 50 DMA line, then positively reversed and closed with a solid gain.
>>> The latest Featured Stock Update with an annotated graph appeared on 6/14/2010. Click here.
View all notes |
Alert me of new notes |
CANSLIM.net Company Profile |
SEC |
Zacks Reports |
StockTalk |
News |
Chart |
Request a new note
C
A N
S L
I M
|
BIDU
-
NASDAQ
Baidu Inc Ads
INTERNET - Internet Information Providers
|
$76.36
|
+2.27
3.06% |
$78.55
|
20,491,642
136.76% of 50 DAV
50 DAV is 14,984,000
|
$82.29
-7.21%
|
1/13/2010
|
$43.13
|
PP = $42.68
|
|
MB = $44.81
|
Most Recent Note - 6/21/2010 7:40:28 PM
G - Gapped up today for a gain with above average volume, then closed in the lower half of its intra-day range, finishing about -7% below its 52-week high.
>>> The latest Featured Stock Update with an annotated graph appeared on 6/21/2010. Click here.
View all notes |
Alert me of new notes |
CANSLIM.net Company Profile |
SEC |
Zacks Reports |
StockTalk |
News |
Chart |
Request a new note
C
A N
S L
I M
|
BRLI
-
NASDAQ
Bio Reference Labs Inc
HEALTH SERVICES - Medical Laboratories and Researc
|
$22.93
|
-0.41
-1.76% |
$23.68
|
139,756
74.74% of 50 DAV
50 DAV is 187,000
|
$24.67
-7.07%
|
6/15/2010
|
$23.57
|
PP = $24.77
|
|
MB = $26.01
|
Most Recent Note - 6/21/2010 7:43:18 PM
Y - Reversed into the red after gapping up today, slumping to a close just below its 50 DMA line.
>>> The latest Featured Stock Update with an annotated graph appeared on 6/15/2010. Click here.
View all notes |
Alert me of new notes |
CANSLIM.net Company Profile |
SEC |
Zacks Reports |
StockTalk |
News |
Chart |
Request a new note
C
A N
S L
I M
|
CISG
-
NASDAQ
Cninsure Inc Ads
INSURANCE - Insurance Brokers
|
$27.50
|
+0.41
1.51% |
$28.14
|
592,416
196.82% of 50 DAV
50 DAV is 301,000
|
$28.62
-3.91%
|
6/16/2010
|
$27.20
|
PP = $27.75
|
|
MB = $29.14
|
Most Recent Note - 6/21/2010 12:12:42 PM
Y - Near the session low after early gains today helped it briefly trade above its pivot point. Featured in the 6/16/10 mid-day report (read here) with new pivot point cited based upon its 5/13/10 high.
>>> The latest Featured Stock Update with an annotated graph appeared on 6/18/2010. Click here.
View all notes |
Alert me of new notes |
CANSLIM.net Company Profile |
SEC |
Zacks Reports |
StockTalk |
News |
Chart |
Request a new note
C
A N
S L
I M
|
Symbol/Exchange
Company Name
Industry Group |
PRICE |
CHANGE
(%Change) |
Day High |
Volume
(% DAV)
(% 50 day avg vol) |
52 Wk Hi
% From Hi |
Featured
Date |
Price
Featured |
Pivot Featured |
|
Max Buy |
CRM
-
NYSE
Salesforce.Com Inc
INTERNET - Internet Software and Services
|
$95.41
|
-0.31
-0.32% |
$97.94
|
2,760,995
103.28% of 50 DAV
50 DAV is 2,673,200
|
$97.58
-2.22%
|
6/2/2010
|
$88.44
|
PP = $89.60
|
|
MB = $94.08
|
Most Recent Note - 6/21/2010 7:45:06 PM
G - Still hovering near its all-time high, extended from its latest sound base. Prior highs in the $89 area are an important support level to watch above its 50 DMA line.
>>> The latest Featured Stock Update with an annotated graph appeared on 6/2/2010. Click here.
View all notes |
Alert me of new notes |
CANSLIM.net Company Profile |
SEC |
Zacks Reports |
StockTalk |
News |
Chart |
Request a new note
C
A N
S L
I M
|
DECK
-
NASDAQ
Deckers Outdoor Corp
CONSUMER NON-DURABLES - Textile - Apparel Footwear
|
$160.33
|
-4.59
-2.78% |
$168.52
|
596,561
113.72% of 50 DAV
50 DAV is 524,600
|
$167.49
-4.27%
|
6/11/2010
|
$157.34
|
PP = $158.57
|
|
MB = $166.50
|
Most Recent Note - 6/21/2010 7:25:37 PM
Y - Reached a new all-time high today and then negatively reversed for a loss on slightly higher volume. Prior chart highs may now serve as initial support on pullbacks.
>>> The latest Featured Stock Update with an annotated graph appeared on 6/11/2010. Click here.
View all notes |
Alert me of new notes |
CANSLIM.net Company Profile |
SEC |
Zacks Reports |
StockTalk |
News |
Chart |
Request a new note
C
A N
S L
I M
|
FFIV
-
NASDAQ
F 5 Networks Inc
INTERNET - Internet Software and Services
|
$74.22
|
+0.41
0.56% |
$77.09
|
1,871,231
112.79% of 50 DAV
50 DAV is 1,659,100
|
$75.93
-2.25%
|
6/16/2010
|
$74.50
|
PP = $74.10
|
|
MB = $77.81
|
Most Recent Note - 6/21/2010 7:27:11 PM
Y - Hit a new all-time high today but reversed and closed near its session low. Gain on 6/16/10 with +55% above average volume helped it trigger a technical buy signal with its breakout from a flat base of about 5-weeks. Featured in the 6/16/10 mid-day report (read here) as its color code was changed to yellow with a pivot point based upon its 5/13/10 high plus ten cents.
>>> The latest Featured Stock Update with an annotated graph appeared on 6/16/2010. Click here.
View all notes |
Alert me of new notes |
CANSLIM.net Company Profile |
SEC |
Zacks Reports |
StockTalk |
News |
Chart |
Request a new note
C
A N
S L
I M
|
MELI
-
NASDAQ
Mercadolibre Inc
INTERNET - Internet Software and; Services
|
$60.63
|
+1.40
2.36% |
$62.08
|
1,036,395
132.46% of 50 DAV
50 DAV is 782,400
|
$62.14
-2.43%
|
5/13/2010
|
$54.21
|
PP = $55.85
|
|
MB = $58.64
|
Most Recent Note - 6/21/2010 7:29:48 PM
G - Gapped up today and posted a solid gain. Extended from its prior base, its prior chart highs in the $55 area may act as an initial support level on pullbacks.
>>> The latest Featured Stock Update with an annotated graph appeared on 6/10/2010. Click here.
View all notes |
Alert me of new notes |
CANSLIM.net Company Profile |
SEC |
Zacks Reports |
StockTalk |
News |
Chart |
Request a new note
C
A N
S L
I M
|
ROVI
-
NASDAQ
Rovi Corp
COMPUTER SOFTWARE andamp; SERVICES - Security Software andamp; Services
|
$37.41
|
+0.03
0.08% |
$37.95
|
915,942
67.79% of 50 DAV
50 DAV is 1,351,100
|
$40.06
-6.62%
|
6/3/2010
|
$38.70
|
PP = $40.16
|
|
MB = $42.17
|
Most Recent Note - 6/21/2010 7:30:30 PM
G - Hovering near its 50 DMA line. Recently found support near prior lows in the $35 area, and stayed above its October 2009 chart high.
>>> The latest Featured Stock Update with an annotated graph appeared on 6/9/2010. Click here.
View all notes |
Alert me of new notes |
CANSLIM.net Company Profile |
SEC |
Zacks Reports |
StockTalk |
News |
Chart |
Request a new note
C
A N
S L
I M
|
Symbol/Exchange
Company Name
Industry Group |
PRICE |
CHANGE
(%Change) |
Day High |
Volume
(% DAV)
(% 50 day avg vol) |
52 Wk Hi
% From Hi |
Featured
Date |
Price
Featured |
Pivot Featured |
|
Max Buy |
SUMR
-
NASDAQ
Summer Infant Inc
CONSUMER NON-DURABLES - Personal Products
|
$7.16
|
-0.12
-1.65% |
$7.33
|
59,134
73.83% of 50 DAV
50 DAV is 80,100
|
$8.42
-14.96%
|
5/4/2010
|
$6.85
|
PP = $7.09
|
|
MB = $7.44
|
Most Recent Note - 6/21/2010 7:31:40 PM
G - Consolidating above its 50 DMA line and prior chart highs in the $7 area. Recent chart lows in the $6.25 area define important support to watch now.
>>> The latest Featured Stock Update with an annotated graph appeared on 6/8/2010. Click here.
View all notes |
Alert me of new notes |
CANSLIM.net Company Profile |
SEC |
Zacks Reports |
StockTalk |
News |
Chart |
Request a new note
C
A N
S L
I M
|
THOR
-
NASDAQ
Thoratec Corp
HEALTH SERVICES - Medical Instruments and Supplies
|
$46.43
|
+0.13
0.28% |
$47.26
|
585,065
59.91% of 50 DAV
50 DAV is 976,600
|
$47.93
-3.13%
|
6/3/2010
|
$44.38
|
PP = $45.35
|
|
MB = $47.62
|
Most Recent Note - 6/21/2010 7:33:20 PM
Y- Quietly consolidating above its pivot point and below its "max buy" level. No resistance remains due to overhead supply, and it could produce more climactic gains.
>>> The latest Featured Stock Update with an annotated graph appeared on 6/3/2010. Click here.
View all notes |
Alert me of new notes |
CANSLIM.net Company Profile |
SEC |
Zacks Reports |
StockTalk |
News |
Chart |
Request a new note
C
A N
S L
I M
|
ULTA
-
NASDAQ
Ulta Salon Cosm & Frag
SPECIALTY RETAIL - Specialty Retail, Other
|
$25.55
|
-0.63
-2.41% |
$26.75
|
864,368
139.80% of 50 DAV
50 DAV is 618,300
|
$26.50
-3.58%
|
5/28/2010
|
$25.58
|
PP = $25.86
|
|
MB = $27.15
|
Most Recent Note - 6/21/2010 7:35:09 PM
Y - Hit a new all-time high today after gapping up, but it closed lower after a negative reversal. No overhead supply remains to act as resistance, however, on 6/11/10 it completed a Secondary Offering which may hinder upward price progress for the near-term.
>>> The latest Featured Stock Update with an annotated graph appeared on 6/7/2010. Click here.
View all notes |
Alert me of new notes |
CANSLIM.net Company Profile |
SEC |
Zacks Reports |
StockTalk |
News |
Chart |
Request a new note
C
A N
S L
I M
|
|
|
|
THESE ARE NOT BUY RECOMMENDATIONS!
Comments contained in the body of this report are technical
opinions only. The material herein has been obtained
from sources believed to be reliable and accurate, however,
its accuracy and completeness cannot be guaranteed.
This site is not an investment advisor, hence it does
not endorse or recommend any securities or other investments.
Any recommendation contained in this report may not
be suitable for all investors and it is not to be deemed
an offer or solicitation on our part with respect to
the purchase or sale of any securities. All trademarks,
service marks and trade names appearing in this report
are the property of their respective owners, and are
likewise used for identification purposes only.
This report is a service available
only to active Paid Premium Members.
You may opt-out of receiving report notifications
at any time. Questions or comments may be submitted
by writing to Premium Membership Services 665 S.E. 10 Street, Suite 201 Deerfield Beach, FL 33441-5634 or by calling 1-800-965-8307
or 954-785-1121.
|
|
|


