You are not logged in.
This means you
CAN ONLY VIEW reports that were published prior to Monday, April 14, 2025.
You
MUST UPGRADE YOUR MEMBERSHIP if you want to see any current reports.
AFTER MARKET UPDATE - THURSDAY, JUNE 20TH, 2013
Previous After Market Report Next After Market Report >>>
|
|
|
|
DOW |
-353.87 |
14,758.32 |
-2.34% |
|
Volume |
1,066,893,890 |
+40% |
|
Volume |
1,975,772,140 |
+20% |
|
NASDAQ |
-78.57 |
3,364.63 |
-2.28% |
|
Advancers |
148 |
5% |
|
Advancers |
364 |
14% |
|
S&P 500 |
-40.74 |
1,588.19 |
-2.50% |
|
Decliners |
2,994 |
94% |
|
Decliners |
2,160 |
83% |
|
Russell 2000 |
-25.98 |
960.52 |
-2.63% |
|
52 Wk Highs |
17 |
|
|
52 Wk Highs |
45 |
|
|
S&P 600 |
-13.58 |
541.11 |
-2.45% |
|
52 Wk Lows |
373 |
|
|
52 Wk Lows |
75 |
|
|
 |
Major Averages Violate 50-Day Moving Average Lines as Correction Worsens
Kenneth J. Gruneisen - Passed the CAN SLIM® Master's Exam
On Thursday the 3 major averages suffered more damaging losses and the previously noted correction worsened. Collectively, the Dow Jones Industrial Average, S&P 500 Index and the Nasdaq Composite Index violated their recent lows and they also sliced below their respective 50-day moving average (DMA) lines. Coupled with the large losses, the volume totals were reported even higher than the prior session totals on the NYSE and on the Nasdaq exchange - again a sign that institutional investors were increasing their selling efforts. Breadth was decisively negative as decliners led advancers by 20-1 on the NYSE and by nearly 6-1 on the Nasdaq exchange. Leadership literally evaporated as only 3 high-ranked companies from the CANSLIM.net Leaders List made new 52-week highs and appeared on the CANSLIM.net BreakOuts Page, down from the prior session total of 48 stocks, and a far cry from the total of 72 on Tuesday. Stocks hitting new 52-lows outnumbered new 52-week highs on both the NYSE and the Nasdaq exchange, whereas new highs had consistently trounced new lows on both exchanges in recent months. There was only 1 gainer among the 11 high-ranked companies currently included on the Featured Stocks Page.
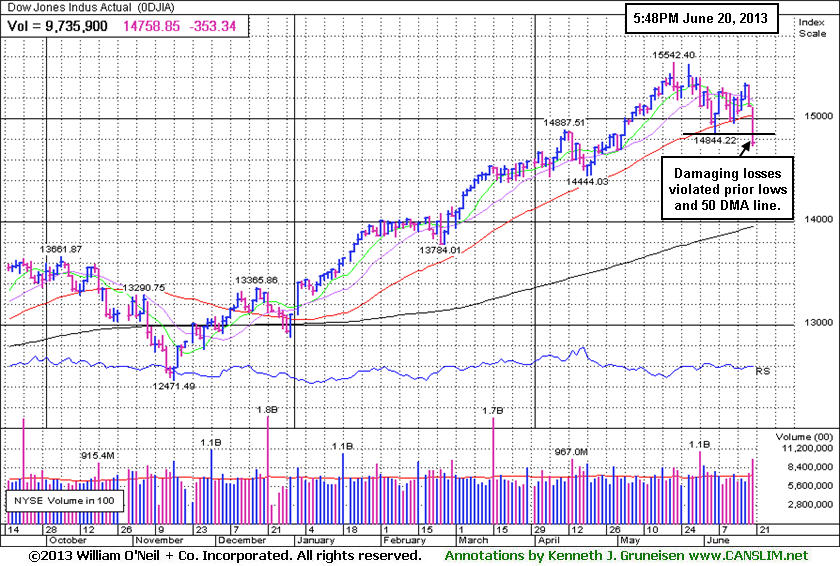
Losses undercutting the prior lows obviously killed the nascent rally attempt on Thursday as the Dow dropped 354 points to finish below 15,000 at 14,758. The S&P 500 Index retreated 41 points to 1,588 while the Nasdaq Composite Index shed 79 points to close at 3,364. The major averages experienced a second day of steep losses after Fed Chairman Ben Bernanke suggested the central bank may start to taper its bond purchases later this year. The market decline was also attributed to a lower-than-expected Chinese manufacturing report. Updates on the U.S economy showed existing home sales grew +4.2% in May to its highest level since November 2009 and Mid-Atlantic manufacturing unexpectedly expanded in June. A separate report showed weekly jobless claims increased 18,000 to 354,000. The leading indicators index rose +0.1%, less than the consensus expected.
All 10 sectors in the S&P 500 finished firmly in negative territory. Consumer discretionary fell the most with homebuilder PulteGroup, Inc (PHM -9.10%) tumbling. Materials and energy also weighed on the market amid a decline in commodity prices as Newmont Mining Corp (NEM -6.74%) and Halliburton Co (HAL -2.90%) both ended lower. Video game retailer GameStop Corp (GME +6.25%) was a notable gainer, climbing after Microsoft Corp (MSFT -3.18%) reversed its stance on sharing games on its new Xbox console.
Treasuries ended the session lower with the 10-year note down 16/32 to yield 2.41%.
Last week the market (M criteria) weakness was labeled a "correction" and this commentary repeatedly reminded members - "Be protective of any gains, and limit losses! Be especially watchful for any individual issues flashing technical sell signals. It is vitally important to your success with the fact-based investment system to reduce exposure and preserve cash during market downdrafts."
There was not a follow-through day of meaningful gains from at least one of the major averages on higher volume as the recent rally attempt sputtered. Instead, leadership (stocks hitting new 52-week highs) ominously disappeared from the landscape. Watch upcoming CANSLIM.net reports and especially the bold portion for us to observe noteworthy shifts in the market direction (M criteria).
Individual leaders best matching the winning models of the fact-based investment system are on the Featured Stocks Page - with our Certified experts' latest notes and links to additional resources including detailed analysis with annotated graphs. The Premium Member Homepage - includes "dynamic archives" to all prior pay reports published. Watch for an announcement via email concerning the next WEBCAST.
PICTURED: The Dow Jones Industrial Average violated near-term support at its 50-day moving average (DMA) line and prior lows, and heavier volume behind the retreat indicated institutional investors were more aggressively abandoning stocks.
|
 Kenneth J. Gruneisen started out as a licensed stockbroker in August 1987, a couple of months prior to the historic stock market crash that took the Dow Jones Industrial Average down -22.6% in a single day. He has published daily fact-based fundamental and technical analysis on high-ranked stocks online for two decades. Through FACTBASEDINVESTING.COM, Kenneth provides educational articles, news, market commentary, and other information regarding proven investment systems that work in good times and bad.
Comments contained in the body of this report are technical opinions only and are not necessarily those of Gruneisen Growth Corp. The material herein has been obtained from sources believed to be reliable and accurate, however, its accuracy and completeness cannot be guaranteed. Our firm, employees, and customers may effect transactions, including transactions contrary to any recommendation herein, or have positions in the securities mentioned herein or options with respect thereto. Any recommendation contained in this report may not be suitable for all investors and it is not to be deemed an offer or solicitation on our part with respect to the purchase or sale of any securities. |
|
 |
Precious Metals Led Vicious and Widespread Losses
Kenneth J. Gruneisen - Passed the CAN SLIM® Master's Exam
The Retail Index ($RLX -2.15%) lost ground and the financial groups weighed on the major averages as the Broker/Dealer Index ($XBD -1.95%) and Bank Index ($BKX -0.96%) fell on Thursday's widely negative session. The tech sector suffered unanimous losses led by the Semiconductor Index ($SOX -3.12%) and Biotechnology Index ($BTK -2.81%), followed by the Internet Index ($IIX -1.87%) and Networking Index ($NWX -1.50%). Weakness in energy-related shares pressured the Integrated Oil Index ($XOI -2.96%) and the Oil Services Index ($OSX -2.21%). The Healthcare Index ($HMO -1.84%) suffered along with the broader market's ills.
Chart courtesy www.stockcharts.com
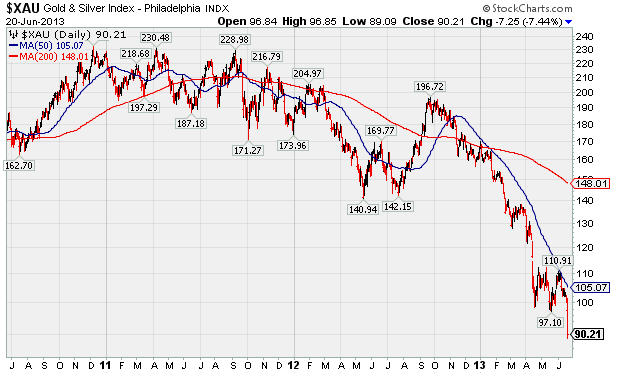
PICTURED 1: The 3-year chart of the Gold & Silver Index ($XAU -7.44%) shows its ongoing decline from late 2010 highs. Thursday's large loss violated its recent lows while falling fast and furiously. The XAU was last shown in the Industry Group Watch section on 6/11/13 (read here) after encountering resistance at its 50-day moving average (DMA) line.
Chart courtesy www.bigcharts.com
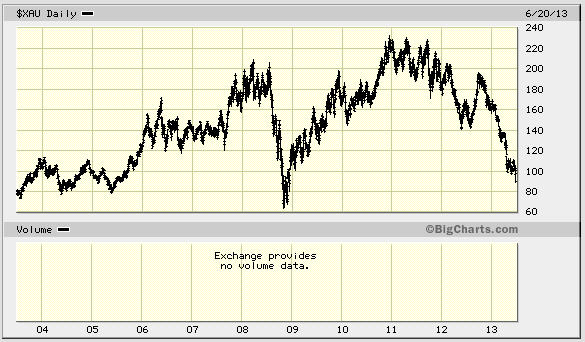
PICTURED 2: The 10-year chart of the Gold & Silver Index ($XAU -7.44%) illustrates how it is retracing toward multi-year lows.
| Oil Services |
$OSX |
251.35 |
-5.69 |
-2.21% |
+14.17% |
| Healthcare |
$HMO |
3,099.56 |
-58.13 |
-1.84% |
+23.28% |
| Integrated Oil |
$XOI |
1,322.59 |
-40.37 |
-2.96% |
+6.50% |
| Semiconductor |
$SOX |
459.72 |
-14.79 |
-3.12% |
+19.70% |
| Networking |
$NWX |
260.74 |
-3.98 |
-1.50% |
+15.09% |
| Internet |
$IIX |
375.00 |
-7.15 |
-1.87% |
+14.68% |
| Broker/Dealer |
$XBD |
124.06 |
-2.46 |
-1.95% |
+31.52% |
| Retail |
$RLX |
772.75 |
-17.00 |
-2.15% |
+18.33% |
| Gold & Silver |
$XAU |
90.21 |
-7.25 |
-7.44% |
-45.53% |
| Bank |
$BKX |
59.98 |
-0.58 |
-0.96% |
+16.97% |
| Biotech |
$BTK |
1,852.18 |
-53.47 |
-2.81% |
+19.73% |
|
|
|
 |
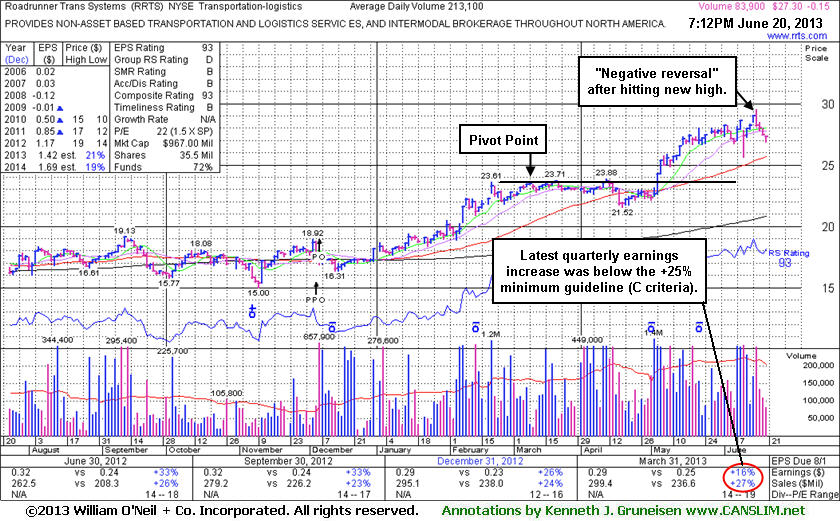
Following Negative Reversal With Losses on Lighter Volume
Kenneth J. Gruneisen - Passed the CAN SLIM® Master's Exam
Roadrunner Transportation Systems Inc (RRTS $-0.15 or -0.55% to 27.30) has fallen 3 more sessions on lighter volume since the "negative reversal" on heavy volume at its 52-week high on 6/17/13. Its last appearance in this FSU section was on 6/04/13 with an annotated graph under the headline, "Chart Shows 'Wedging' Higher In Recent Weeks on Light Volume.". The prior highs in the $23 area define support to watch below its 50-day moving average (DMA) line. It showed resilience near its 50-day moving average (DMA) line, then started the month of May with a spike higher with heavy volume behind big gains. Because the fact-based system suggests watching for technical sell signals before exiting profitable position it was previously noted - "Investors who may own it might choose to give the stock the benefit of the doubt unless it flashes any weak action, however a disciplined investor following the fact-based system would usually avoid making new buying efforts in any companies failing to solidly satisfy the fundamental guidelines."
Fundamental concerns recently were raised after it reported earnings +16% on +27% sales revenues for the quarter ended March 31, 2013 versus the year ago period, below the +25% minimum earnings guideline (C criteria). It is more ideal when a company shows accelerating sales revenues and earnings increases. Often a bullish price/volume chart anticipates strong earnings results in the coming quarter, while bearish price/volume chart patterns frequently predict weaker earnings in the future. Time will say if it can resume growth above the +25% rate. Consensus estimates are currently calling for +21% and +19% earnings growth in FY '13 and '14, respectively. Earnings growth is crucial to the fact-based investment approach and obviously weighs into the newspaper's Earnings Per Share (EPS) rating system. Its current EPS rank of 93 is still well above the 80+ guideline for buy candidates.
The number of top-rated funds owning its shares rose from 168 in Jun '12 to 201 in Mar '13, a reassuring sign concerning the I criteria. The company completed a new Public Offering on 12/06/12 and, technically, it broke out above previously stubborn resistance in $19 area with volume-driven gains in January.
|
|
|
Color Codes Explained :
Y - Better candidates highlighted by our
staff of experts.
G - Previously featured
in past reports as yellow but may no longer be buyable under the
guidelines.
***Last / Change / Volume data in this table is the closing quote data***
Symbol/Exchange
Company Name
Industry Group |
PRICE |
CHANGE
(%Change) |
Day High |
Volume
(% DAV)
(% 50 day avg vol) |
52 Wk Hi
% From Hi |
Featured
Date |
Price
Featured |
Pivot Featured |
|
Max Buy |
AL
-
NYSE
Air Lease Corp Cl A
DIVERSIFIED SERVICES - Rental and Leasing Services
|
$26.99
|
-1.00
-3.57% |
$27.85
|
391,885
71.02% of 50 DAV
50 DAV is 551,800
|
$31.00
-12.94%
|
5/9/2013
|
$30.95
|
PP = $29.38
|
|
MB = $30.85
|
 Most Recent Note - 6/20/2013 8:01:00 PM
G - Sputtering below its 50 DMA line which recently has acted as resistance. Completed a Secondary Offering on 5/31/13. More damaging losses below recent lows in the $25-26 area may raise serious concerns.
>>> The latest Featured Stock Update with an annotated graph appeared on 6/17/2013. Click here.
View all notes |
Alert me of new notes |
CANSLIM.net Company Profile |
SEC |
Zacks Reports |
StockTalk |
News |
Chart |
Request a new note
C
A N
S L
I M


|
AMBA
-
NASDAQ
Ambarella Inc
ELECTRONICS - Semiconductor - Specialized
|
$16.93
|
-1.23
-6.77% |
$17.90
|
1,776,989
170.86% of 50 DAV
50 DAV is 1,040,000
|
$18.58
-8.88%
|
5/6/2013
|
$15.31
|
PP = $16.10
|
|
MB = $16.91
|
Most Recent Note - 6/20/2013 5:22:02 PM
G - Retreated from its 52-week high with a 2nd loss on above average volume in the span of 3 sessions. Recent lows and its 50 DMA line ($15.11 now) define important chart support to watch on pullbacks.
>>> The latest Featured Stock Update with an annotated graph appeared on 6/14/2013. Click here.
View all notes |
Alert me of new notes |
CANSLIM.net Company Profile |
SEC |
Zacks Reports |
StockTalk |
News |
Chart |
Request a new note
C
A N
S L
I M
|
EQM
-
NYSE
E Q T Midstream Partners
ENERGY - Oil and Gas Pipelines
|
$50.50
|
-0.32
-0.63% |
$50.95
|
138,136
111.49% of 50 DAV
50 DAV is 123,900
|
$51.72
-2.36%
|
4/25/2013
|
$40.16
|
PP = $40.84
|
|
MB = $42.88
|
Most Recent Note - 6/17/2013 12:24:34 PM
G - Gapped up for a 2nd consecutive considerable gain with volume running at an above average pace while challenging its 52-week high. Recent low and its 50 DMA line define important near-term support in the $45 area.
>>> The latest Featured Stock Update with an annotated graph appeared on 6/6/2013. Click here.
View all notes |
Alert me of new notes |
CANSLIM.net Company Profile |
SEC |
Zacks Reports |
StockTalk |
News |
Chart |
Request a new note
C
A N
S L
I M
|
FLT
-
NYSE
Fleetcor Technologies
DIVERSIFIED SERVICES - Business/Management Services
|
$83.94
|
-4.21
-4.78% |
$87.48
|
1,141,068
134.93% of 50 DAV
50 DAV is 845,700
|
$89.75
-6.47%
|
5/29/2013
|
$86.02
|
PP = $85.66
|
|
MB = $89.94
|
Most Recent Note - 6/20/2013 7:52:37 PM
Y- Fell with above average volume today, slumping below its pivot point and toward its 50 DMA line ($81.64) defining important near-term chart support. See the latest FSU analysis for more details and an annotated graph.
>>> The latest Featured Stock Update with an annotated graph appeared on 6/18/2013. Click here.
View all notes |
Alert me of new notes |
CANSLIM.net Company Profile |
SEC |
Zacks Reports |
StockTalk |
News |
Chart |
Request a new note
C
A N
S L
I M
|
LOPE
-
NASDAQ
Grand Canyon Education
DIVERSIFIED SERVICES - Education and; Training Services
|
$31.63
|
+0.16
0.51% |
$32.62
|
293,907
75.38% of 50 DAV
50 DAV is 389,900
|
$34.07
-7.16%
|
6/19/2013
|
$31.47
|
PP = $34.17
|
|
MB = $35.88
|
Most Recent Note - 6/19/2013 8:23:07 PM
Y - Color code is changed to yellow with a new pivot point cited based on its 5/22/13 high plus 10 cents. Subsequent volume driven gains above its pivot point may trigger a new technical buy signal. Consolidating above its 50 DMA line and well above additional support at prior highs in the $27 area. See the latest FSU analysis for more details and a new annotated graph.
>>> The latest Featured Stock Update with an annotated graph appeared on 6/19/2013. Click here.
View all notes |
Alert me of new notes |
CANSLIM.net Company Profile |
SEC |
Zacks Reports |
StockTalk |
News |
Chart |
Request a new note
C
A N
S L
I M
|
Symbol/Exchange
Company Name
Industry Group |
PRICE |
CHANGE
(%Change) |
Day High |
Volume
(% DAV)
(% 50 day avg vol) |
52 Wk Hi
% From Hi |
Featured
Date |
Price
Featured |
Pivot Featured |
|
Max Buy |
MRLN
-
NASDAQ
Marlin Business Services
DIVERSIFIED SERVICES - Rental and Leasing Services
|
$21.97
|
-0.65
-2.87% |
$22.44
|
26,189
106.89% of 50 DAV
50 DAV is 24,500
|
$25.97
-15.40%
|
3/15/2013
|
$22.29
|
PP = $23.18
|
|
MB = $24.34
|
Most Recent Note - 6/20/2013 8:06:04 PM
G - Slumping near its recent low ($21.49 on 5/23/13) and its 200 DMA line ($20.80) defining very important near-term support levels. Its Up/Down Volume Ratio is currently 0.6 which is an unbiased indication it has been encountering heavier distributional pressure over the past 50 days.
>>> The latest Featured Stock Update with an annotated graph appeared on 6/11/2013. Click here.
View all notes |
Alert me of new notes |
CANSLIM.net Company Profile |
SEC |
Zacks Reports |
StockTalk |
News |
Chart |
Request a new note
C
A N
S L
I M
|
NSM
-
NYSE
Nationstar Mtg Hldgs Inc
FINANCIAL SERVICES - Credit Services
|
$39.96
|
-2.58
-6.06% |
$41.84
|
2,152,735
180.52% of 50 DAV
50 DAV is 1,192,500
|
$46.91
-14.82%
|
5/7/2013
|
$39.71
|
PP = $42.34
|
|
MB = $44.46
|
Most Recent Note - 6/20/2013 11:51:05 AM
Y - Volume was above average as it erased an early gain for a "negative reversal" yesterday, and it is testing its 50 DMA line with today's damaging loss. Prior low ($39.22 on 5/29/13) defines important near term chart support where a violation would raise more serious concerns. Disciplined investors always limit losses if any stock falls more than -7% from their purchase price.
>>> The latest Featured Stock Update with an annotated graph appeared on 6/13/2013. Click here.
View all notes |
Alert me of new notes |
CANSLIM.net Company Profile |
SEC |
Zacks Reports |
StockTalk |
News |
Chart |
Request a new note
C
A N
S L
I M
|
PRAA
-
NASDAQ
Portfolio Recovery Assoc
DIVERSIFIED SERVICES - Business/Management Services
|
$156.70
|
-3.36
-2.10% |
$159.90
|
75,153
99.15% of 50 DAV
50 DAV is 75,800
|
$163.87
-4.38%
|
5/1/2013
|
$130.77
|
PP = $127.88
|
|
MB = $134.27
|
Most Recent Note - 6/18/2013 1:00:49 PM
G - On track for a 5th consecutive gain and perched at its all-time high today extended from any sound base. It has rallied with no resistance due to overhead supply, and its 50 DMA line ($139.85 now) defines important chart support.
>>> The latest Featured Stock Update with an annotated graph appeared on 6/10/2013. Click here.
View all notes |
Alert me of new notes |
CANSLIM.net Company Profile |
SEC |
Zacks Reports |
StockTalk |
News |
Chart |
Request a new note
C
A N
S L
I M
|
PRLB
-
NYSE
Proto Labs Inc
MANUFACTURING - Small Tools and Accessories
|
$61.01
|
-2.86
-4.48% |
$63.75
|
798,355
144.89% of 50 DAV
50 DAV is 551,000
|
$65.12
-6.31%
|
6/17/2013
|
$59.37
|
PP = $59.94
|
|
MB = $62.94
|
Most Recent Note - 6/20/2013 7:57:07 PM
Y- Volume-driven gains earlier this week helped it rally above its pivot point triggering a new (or add-on) technical buy signal. Prior highs define initial support to watch, while any close below its old high close ($59.13 on 5/10/13) would raise concerns and completely negate the prior technical breakout.
>>> The latest Featured Stock Update with an annotated graph appeared on 6/12/2013. Click here.
View all notes |
Alert me of new notes |
CANSLIM.net Company Profile |
SEC |
Zacks Reports |
StockTalk |
News |
Chart |
Request a new note
C
A N
S L
I M
|
RRTS
-
NYSE
Roadrunner Trans Systems
TRANSPORTATION - Air Delivery and Freight Service
|
$27.30
|
-0.15
-0.55% |
$27.36
|
83,994
39.42% of 50 DAV
50 DAV is 213,100
|
$29.52
-7.52%
|
4/3/2013
|
$22.77
|
PP = $23.75
|
|
MB = $24.94
|
Most Recent Note - 6/20/2013 7:49:35 PM
G - Followed a "negative reversal" at its 52-week high with 3 losses on lighter volume. Fundamental concerns were raised by its sub par earnings increase in the Mar '13 quarter. See the latest FSU analysis for more details and a new annotated graph.
>>> The latest Featured Stock Update with an annotated graph appeared on 6/20/2013. Click here.
View all notes |
Alert me of new notes |
CANSLIM.net Company Profile |
SEC |
Zacks Reports |
StockTalk |
News |
Chart |
Request a new note
C
A N
S L
I M
|
Symbol/Exchange
Company Name
Industry Group |
PRICE |
CHANGE
(%Change) |
Day High |
Volume
(% DAV)
(% 50 day avg vol) |
52 Wk Hi
% From Hi |
Featured
Date |
Price
Featured |
Pivot Featured |
|
Max Buy |
VRX
-
NYSE
Valeant Pharmaceuticals
DRUGS - Drug Manufacturers - Other
|
$83.84
|
-2.57
-2.97% |
$86.40
|
3,789,901
203.74% of 50 DAV
50 DAV is 1,860,200
|
$96.25
-12.89%
|
4/30/2013
|
$60.24
|
PP = $76.66
|
|
MB = $80.49
|
Most Recent Note - 6/20/2013 8:09:26 PM
G- Completed a new Public Offering on 6/18/13. Concerns were raised by its sub par Mar '13 earnings report, however mostly bullish action has followed. Its 50 DMA line ($78.95) defines near-term support above prior highs in the $76 area.
>>> The latest Featured Stock Update with an annotated graph appeared on 6/7/2013. Click here.
View all notes |
Alert me of new notes |
CANSLIM.net Company Profile |
SEC |
Zacks Reports |
StockTalk |
News |
Chart |
Request a new note
C
A N
S L
I M
|
|
|
|
THESE ARE NOT BUY RECOMMENDATIONS!
Comments contained in the body of this report are technical
opinions only. The material herein has been obtained
from sources believed to be reliable and accurate, however,
its accuracy and completeness cannot be guaranteed.
This site is not an investment advisor, hence it does
not endorse or recommend any securities or other investments.
Any recommendation contained in this report may not
be suitable for all investors and it is not to be deemed
an offer or solicitation on our part with respect to
the purchase or sale of any securities. All trademarks,
service marks and trade names appearing in this report
are the property of their respective owners, and are
likewise used for identification purposes only.
This report is a service available
only to active Paid Premium Members.
You may opt-out of receiving report notifications
at any time. Questions or comments may be submitted
by writing to Premium Membership Services 665 S.E. 10 Street, Suite 201 Deerfield Beach, FL 33441-5634 or by calling 1-800-965-8307
or 954-785-1121.
|
|
|

