You are not logged in.
This means you
CAN ONLY VIEW reports that were published prior to Sunday, April 13, 2025.
You
MUST UPGRADE YOUR MEMBERSHIP if you want to see any current reports.
AFTER MARKET UPDATE - WEDNESDAY, JUNE 19TH, 2013
Previous After Market Report Next After Market Report >>>
|
|
|
|
DOW |
-206.04 |
15,112.19 |
-1.35% |
|
Volume |
760,130,400 |
+18% |
|
Volume |
1,651,503,050 |
+8% |
|
NASDAQ |
-38.98 |
3,443.20 |
-1.12% |
|
Advancers |
455 |
15% |
|
Advancers |
687 |
27% |
|
S&P 500 |
-22.88 |
1,628.93 |
-1.39% |
|
Decliners |
2,595 |
83% |
|
Decliners |
1,809 |
70% |
|
Russell 2000 |
-13.49 |
986.50 |
-1.35% |
|
52 Wk Highs |
117 |
|
|
52 Wk Highs |
127 |
|
|
S&P 600 |
-7.03 |
554.69 |
-1.25% |
|
52 Wk Lows |
83 |
|
|
52 Wk Lows |
28 |
|
|
 |
Distributional Pressure Rose as Indices Fell with Negative Breadth
Kenneth J. Gruneisen - Passed the CAN SLIM® Master's Exam
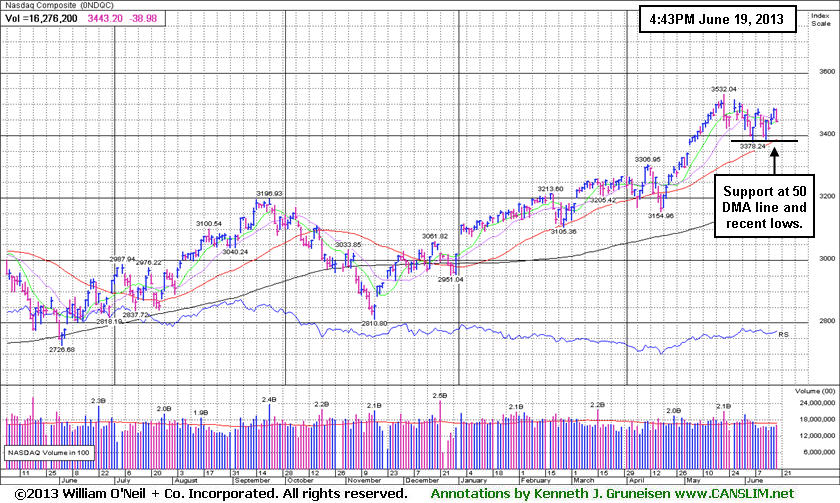
On Wednesday the major averages suffered large losses. Coupled with the losses, the volume totals were reported higher than the prior session totals on the NYSE and on the Nasdaq exchange, a sign that institutional investors were increasing their selling efforts. Breadth was negative as decliners led advancers by more than 5-1 on the NYSE and nearly 3-1 on the Nasdaq exchange. Leadership contracted as there were 48 high-ranked companies from the CANSLIM.net Leaders List making new 52-week highs and appearing on the CANSLIM.net BreakOuts Page, down from the prior session total of 72 stocks. Stocks hitting new 52-week highs outnumbered new 52-week lows on the NYSE and on the Nasdaq exchange. There were gains for 5 of the 11 high-ranked companies currently included on the Featured Stocks Page.
The release of the Fed's policy statement and Chairman Bernanke's press conference gave few details on the plan for its stimulus efforts. The central bank provided an update on its projections for the U.S economy. The market extended its decline as Chairman Bernanke suggested at his press conference the Fed may start to taper purchases later this year.
All 10 sectors in the S&P 500 finished lower on the widely negative session with telecom the worst performing group. Shares of Sprint Nextel Corp (S -4.37% ) paced the group's decline after Dish Network Corp (DISH +0.46%) said it will not make a new offer to buy the wireless carrier.Verizon Communications Inc (VZ -2.91%) and AT&T, Inc (T -2.54%) also slumped. Utilities also weighed on the market with Consolidated Edison Inc (ED -2.83%) falling. Homebuilders paced consumer discretionary lower as DR Horton (DHI -3.77%) and Lennar Corp (LEN -3.74%) fell.
On the earnings front, Adobe Systems Inc (ADBE +5.58%) was the best performing stock in the S&P 500, climbing after the software maker's earnings beat consensus projections. Economic bellwether FedEx Corp (FDX +1.07%) advanced as its better-than-expected quarterly results offset a disappointing profit forecast. Health care and financials also weighed on the market as Tenet Healthcare (THC -3.75%) and The Hartford Financial Services Group, Inc.(HIG -2.17%) traded lower. The energy and materials outperformed as Refiner Tesoro (TSO +0.53%) edged higher, however Freeport McMoRan Copper & Gold Inc (FCX -1.12%) reversed its early gains and ended lower.
Treasuries finished firmly in negative territory. The benchmark 10-year note dropped 1 7/32 to yield 2.33%.
A follow-through day of meaningful gains from at least one of the major averages on higher volume coupled with healthy leadership (stocks hitting new 52-week highs) is an important reassurance to be watching for in the near-term, before disciplined investors might again seriously consider any new buying efforts. Last week the market (M criteria) weakness was labeled a "correction" and this commentary has reminded members - "Be protective of any gains, and limit losses! Be especially watchful for any individual issues flashing technical sell signals. It is vitally important to your success with the fact-based investment system to reduce exposure and preserve cash during market downdrafts."
As always, watch upcoming CANSLIM.net reports for new action-worthy leaders best matching the winning models to be covered as they emerge and then included on the Featured Stocks Page - with our Certified experts' latest notes and links to additional resources including detailed analysis with annotated graphs. The Premium Member Homepage - includes "dynamic archives" to all prior pay reports published. Watch for an announcement via email concerning the next WEBCAST.
PICTURED: The Nasdaq Composite Index is consolidating above near-term support at its 50-day moving average (DMA) line and prior lows. The window is open for a follow-through day (FTD) of gains from the major averages within the most ideal period 4-7 days after the major averages halted their latest slide. Losses undercutting the recent lows would obviously kill the nascent rally attempt.
|
 Kenneth J. Gruneisen started out as a licensed stockbroker in August 1987, a couple of months prior to the historic stock market crash that took the Dow Jones Industrial Average down -22.6% in a single day. He has published daily fact-based fundamental and technical analysis on high-ranked stocks online for two decades. Through FACTBASEDINVESTING.COM, Kenneth provides educational articles, news, market commentary, and other information regarding proven investment systems that work in good times and bad.
Comments contained in the body of this report are technical opinions only and are not necessarily those of Gruneisen Growth Corp. The material herein has been obtained from sources believed to be reliable and accurate, however, its accuracy and completeness cannot be guaranteed. Our firm, employees, and customers may effect transactions, including transactions contrary to any recommendation herein, or have positions in the securities mentioned herein or options with respect thereto. Any recommendation contained in this report may not be suitable for all investors and it is not to be deemed an offer or solicitation on our part with respect to the purchase or sale of any securities. |
|
 |
All Groups Including Defensive Areas Ended Lower
Kenneth J. Gruneisen - Passed the CAN SLIM® Master's Exam
The Retail Index ($RLX -1.32%) was a negative influence on the major indices along with weakness in the financial groups as the Bank Index ($BKX -0.90%) and Broker/Dealer Index ($XBD -0.88%) both fell on Wednesday. Losses in energy-related shares dragged the Integrated Oil Index ($XOI -1.22%) and the Oil Services Index ($OSX -0.93%) lower. The Semiconductor Index ($SOX -1.16%), Biotechnology Index ($BTK -1.12%), and Internet Index ($IIX -0.85%) led the tech sector lower while the Networking Index ($NWX -0.29%) did a better job of holding its ground. The Gold & Silver Index's ($XAU -2.85%) big loss made it a standout laggard as it slumped near its 2013 low, rounding out the widely negative session.
Charts courtesy www.stockcharts.com
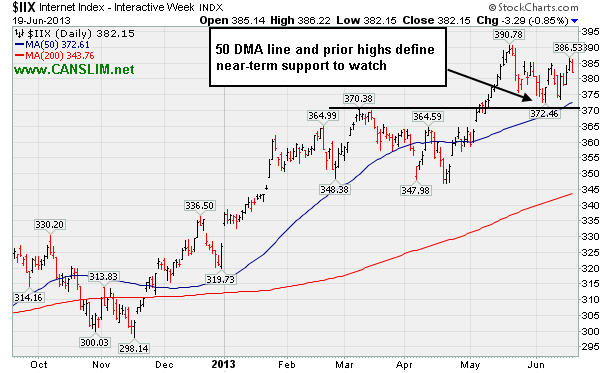
PICTURED: The Internet Index ($IIX -0.85%) is consolidating above its 50-day moving average and above prior highs, in healthy shape chart-wise, and up about +17% year-to-date. It is not unexpected that some individual issues tallied bigger gains than the index itself during that time span. Linkedin Corp (LNKD) has shown resilience since dropped from the Featured Stocks list on 5/19/13. After featured in the 2/08/13 mid-day report (read here) it subsequently traded as much as +38% higher within less than 3 months. It has recently been consolidating, however it is not currently included on the Featured Stocks list.
| Oil Services |
$OSX |
257.04 |
-2.42 |
-0.93% |
+16.75% |
| Healthcare |
$HMO |
3,157.69 |
-31.94 |
-1.00% |
+25.60% |
| Integrated Oil |
$XOI |
1,362.95 |
-16.78 |
-1.22% |
+9.75% |
| Semiconductor |
$SOX |
474.51 |
-5.55 |
-1.16% |
+23.55% |
| Networking |
$NWX |
264.72 |
-0.77 |
-0.29% |
+16.85% |
| Internet |
$IIX |
382.15 |
-3.29 |
-0.85% |
+16.87% |
| Broker/Dealer |
$XBD |
126.53 |
-1.13 |
-0.88% |
+34.13% |
| Retail |
$RLX |
789.75 |
-10.60 |
-1.32% |
+20.93% |
| Gold & Silver |
$XAU |
97.46 |
-2.86 |
-2.85% |
-41.15% |
| Bank |
$BKX |
60.56 |
-0.55 |
-0.90% |
+18.10% |
| Biotech |
$BTK |
1,905.66 |
-21.66 |
-1.12% |
+23.18% |
|
|
|
 |
New Base Forming Following Prior Breakout and Big Gains
Kenneth J. Gruneisen - Passed the CAN SLIM® Master's Exam
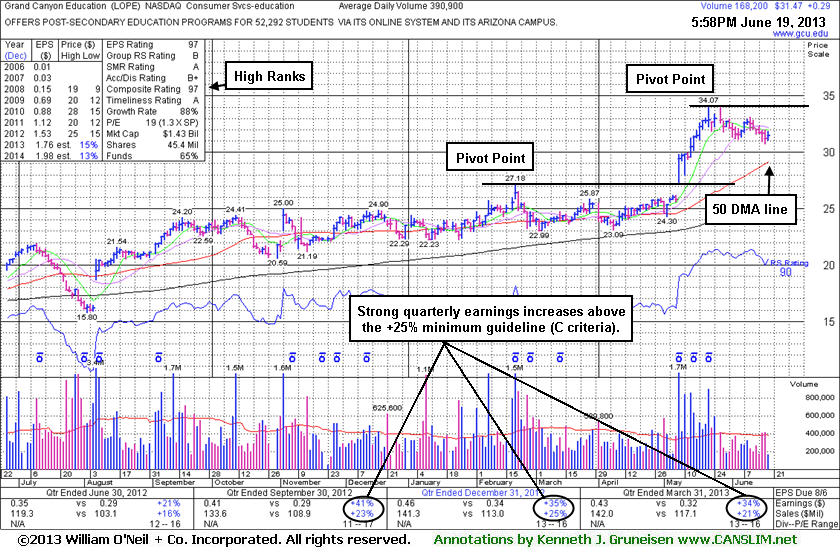
Grand Canyon Education (LOPE +$0.29 or +0.93% to $31.47) was last shown in this FSU section on 6/03/13 with an annotated graph under the headline, "Hovering Near High Following Big Gains In First Weeks After Breakout", as it was noted - "Gains of greater than +20% in the first 2-3 weeks following its "breakaway gap" suggest holding for a minimum of 8 weeks under the fact-based investment system's rules designed to help investors capture big profits from the market's biggest gainers."
It has been more than 8 weeks, and considering the broader market's weakness (M criteria) disciplined investors might be more concerned about protecting gains rather than accumulating more stocks until strength returns to the market. However, it appears to be building a new flat base, and a new pivot point was cited based on its 5/22/13 high plus 10 cents. Subsequent volume-driven gains may trigger a new technical buy signal. Volume totals have been mostly quiet or average while consolidating above its 50-day moving average (DMA) line with additional support at prior highs in the $27 area.
As it made it to all-time high territory above its April 2010 high (N criteria) it was noted - "Showing bullish technical action which may mark the beginning of a meaningful and sustained advance in price." The Commercial Services - Schools group has shown leadership (L criteria) and currently has a B Rating. Its prior pivot point was based on its 2/20/13 high plus 10 cents. The breakaway gap was noted as one exception where investors may chase a stock more than +5% above its prior high or pivot point. However, buying further above prior highs increases the chances that a normal pullback may prompt disciplined investors to limit losses and sell if the stock falls more than -7% from their purchase price.
The number of top-rated funds owning its shares rose from 200 in Mar '12 to 296 in Mar '13, a reassuring trend concerning the I criteria. Its current Up/Down Volume Ratio of 1.9 is an unbiased indication that its shares have been under accumulation over the past 50 days. It most recently reported earnings +34% on +21% sales revenues for the Mar '13 quarter, and earnings increases were above the +25% minimum earnings guideline (C criteria) the past 3 quarterly comparisons. Its Relative Strength Rating (90) remains above the 80+ minimum guideline for buy candidates under the fact-based investment system.
|
|
|
Color Codes Explained :
Y - Better candidates highlighted by our
staff of experts.
G - Previously featured
in past reports as yellow but may no longer be buyable under the
guidelines.
***Last / Change / Volume data in this table is the closing quote data***
Symbol/Exchange
Company Name
Industry Group |
PRICE |
CHANGE
(%Change) |
Day High |
Volume
(% DAV)
(% 50 day avg vol) |
52 Wk Hi
% From Hi |
Featured
Date |
Price
Featured |
Pivot Featured |
|
Max Buy |
AL
-
NYSE
Air Lease Corp Cl A
DIVERSIFIED SERVICES - Rental and Leasing Services
|
$27.99
|
-0.41
-1.44% |
$28.46
|
176,608
31.78% of 50 DAV
50 DAV is 555,700
|
$31.00
-9.71%
|
5/9/2013
|
$30.95
|
PP = $29.38
|
|
MB = $30.85
|
Most Recent Note - 6/17/2013 1:14:30 PM
G - Still consolidating just below its 50 DMA line which may act as resistance. Completed a Secondary Offering on 5/31/13.
>>> The latest Featured Stock Update with an annotated graph appeared on 6/17/2013. Click here.
View all notes |
Alert me of new notes |
CANSLIM.net Company Profile |
SEC |
Zacks Reports |
StockTalk |
News |
Chart |
Request a new note
C
A N
S L
I M


|
AMBA
-
NASDAQ
Ambarella Inc
ELECTRONICS - Semiconductor - Specialized
|
$18.16
|
+0.25
1.40% |
$18.48
|
896,523
87.07% of 50 DAV
50 DAV is 1,029,600
|
$18.58
-2.26%
|
5/6/2013
|
$15.31
|
PP = $16.10
|
|
MB = $16.91
|
Most Recent Note - 6/18/2013 12:10:25 PM
G - Reversed into the red after touching a new 52-week high today following 3 consecutive gains. Tallied 8 consecutive weekly gains. Recent lows and its 50 DMA line ($15.03 now) define important chart support to watch on pullbacks.
>>> The latest Featured Stock Update with an annotated graph appeared on 6/14/2013. Click here.
View all notes |
Alert me of new notes |
CANSLIM.net Company Profile |
SEC |
Zacks Reports |
StockTalk |
News |
Chart |
Request a new note
C
A N
S L
I M
|
EQM
-
NYSE
E Q T Midstream Partners
ENERGY - Oil and Gas Pipelines
|
$50.82
|
+0.25
0.49% |
$51.50
|
146,950
119.67% of 50 DAV
50 DAV is 122,800
|
$51.72
-1.74%
|
4/25/2013
|
$40.16
|
PP = $40.84
|
|
MB = $42.88
|
Most Recent Note - 6/17/2013 12:24:34 PM
G - Gapped up for a 2nd consecutive considerable gain with volume running at an above average pace while challenging its 52-week high. Recent low and its 50 DMA line define important near-term support in the $45 area.
>>> The latest Featured Stock Update with an annotated graph appeared on 6/6/2013. Click here.
View all notes |
Alert me of new notes |
CANSLIM.net Company Profile |
SEC |
Zacks Reports |
StockTalk |
News |
Chart |
Request a new note
C
A N
S L
I M
|
FLT
-
NYSE
Fleetcor Technologies
DIVERSIFIED SERVICES - Business/Management Services
|
$88.15
|
-0.97
-1.09% |
$89.53
|
604,471
71.45% of 50 DAV
50 DAV is 846,000
|
$89.75
-1.78%
|
5/29/2013
|
$86.02
|
PP = $85.66
|
|
MB = $89.94
|
Most Recent Note - 6/18/2013 6:06:29 PM
Y- Recently wedging to new all-time highs without great volume conviction, on track for a 9th consecutive weekly gain. See the latest FSU analysis for more details and a new annotated graph.
>>> The latest Featured Stock Update with an annotated graph appeared on 6/18/2013. Click here.
View all notes |
Alert me of new notes |
CANSLIM.net Company Profile |
SEC |
Zacks Reports |
StockTalk |
News |
Chart |
Request a new note
C
A N
S L
I M
|
LOPE
-
NASDAQ
Grand Canyon Education
DIVERSIFIED SERVICES - Education and; Training Services
|
$31.47
|
+0.29
0.93% |
$31.88
|
171,552
43.89% of 50 DAV
50 DAV is 390,900
|
$34.07
-7.63%
|
6/19/2013
|
$31.47
|
PP = $34.17
|
|
MB = $35.88
|
 Most Recent Note - 6/19/2013 8:23:07 PM
Y - Color code is changed to yellow with a new pivot point cited based on its 5/22/13 high plus 10 cents. Subsequent volume driven gains above its pivot point may trigger a new technical buy signal. Consolidating above its 50 DMA line and well above additional support at prior highs in the $27 area. See the latest FSU analysis for more details and a new annotated graph.
>>> The latest Featured Stock Update with an annotated graph appeared on 6/19/2013. Click here.
View all notes |
Alert me of new notes |
CANSLIM.net Company Profile |
SEC |
Zacks Reports |
StockTalk |
News |
Chart |
Request a new note
C
A N
S L
I M
|
Symbol/Exchange
Company Name
Industry Group |
PRICE |
CHANGE
(%Change) |
Day High |
Volume
(% DAV)
(% 50 day avg vol) |
52 Wk Hi
% From Hi |
Featured
Date |
Price
Featured |
Pivot Featured |
|
Max Buy |
MRLN
-
NASDAQ
Marlin Business Services
DIVERSIFIED SERVICES - Rental and Leasing Services
|
$22.62
|
-0.31
-1.35% |
$23.12
|
17,463
71.28% of 50 DAV
50 DAV is 24,500
|
$25.97
-12.90%
|
3/15/2013
|
$22.29
|
PP = $23.18
|
|
MB = $24.34
|
Most Recent Note - 6/17/2013 1:08:17 PM
G - Slumping below its 50 DMA line today, weak amid a mostly positive market, and its color code is changed to green. Churned above average volume without making meaningful price progress in the past 2 weeks. Up/Down Volume Ratio is currently 0.7 which is an unbiased indication it has been encountering distributional pressure over the past 50 days. The recent low ($21.49 on 5/23/13) defines important near-term chart support where a violation would raise more serious concerns.
>>> The latest Featured Stock Update with an annotated graph appeared on 6/11/2013. Click here.
View all notes |
Alert me of new notes |
CANSLIM.net Company Profile |
SEC |
Zacks Reports |
StockTalk |
News |
Chart |
Request a new note
C
A N
S L
I M
|
NSM
-
NYSE
Nationstar Mtg Hldgs Inc
FINANCIAL SERVICES - Credit Services
|
$42.54
|
-0.58
-1.35% |
$44.35
|
1,432,708
121.94% of 50 DAV
50 DAV is 1,174,900
|
$46.91
-9.32%
|
5/7/2013
|
$39.71
|
PP = $42.34
|
|
MB = $44.46
|
Most Recent Note - 6/19/2013 8:38:15 PM
Y - Volume was above average today as it erased an early gain for a "negative reversal". Still consolidating near prior highs and above its 50 DMA line. Disciplined investors always limit losses if any stock falls more than -7% from their purchase price.
>>> The latest Featured Stock Update with an annotated graph appeared on 6/13/2013. Click here.
View all notes |
Alert me of new notes |
CANSLIM.net Company Profile |
SEC |
Zacks Reports |
StockTalk |
News |
Chart |
Request a new note
C
A N
S L
I M
|
PRAA
-
NASDAQ
Portfolio Recovery Assoc
DIVERSIFIED SERVICES - Business/Management Services
|
$160.06
|
-0.17
-0.11% |
$161.57
|
64,277
85.14% of 50 DAV
50 DAV is 75,500
|
$163.87
-2.33%
|
5/1/2013
|
$130.77
|
PP = $127.88
|
|
MB = $134.27
|
Most Recent Note - 6/18/2013 1:00:49 PM
G - On track for a 5th consecutive gain and perched at its all-time high today extended from any sound base. It has rallied with no resistance due to overhead supply, and its 50 DMA line ($139.85 now) defines important chart support.
>>> The latest Featured Stock Update with an annotated graph appeared on 6/10/2013. Click here.
View all notes |
Alert me of new notes |
CANSLIM.net Company Profile |
SEC |
Zacks Reports |
StockTalk |
News |
Chart |
Request a new note
C
A N
S L
I M
|
PRLB
-
NYSE
Proto Labs Inc
MANUFACTURING - Small Tools and Accessories
|
$63.87
|
+1.34
2.14% |
$65.12
|
744,718
137.81% of 50 DAV
50 DAV is 540,400
|
$63.50
0.58%
|
6/17/2013
|
$59.37
|
PP = $59.94
|
|
MB = $62.94
|
Most Recent Note - 6/19/2013 12:42:22 PM
G- Color code is changed to green as today's 5th consecutive gain has lifted it above the "max buy" level for yet another new 52-week high. Rallied above its pivot point with +130% above average volume on the prior session triggering a new (or add-on) technical buy signal.
>>> The latest Featured Stock Update with an annotated graph appeared on 6/12/2013. Click here.
View all notes |
Alert me of new notes |
CANSLIM.net Company Profile |
SEC |
Zacks Reports |
StockTalk |
News |
Chart |
Request a new note
C
A N
S L
I M
|
RRTS
-
NYSE
Roadrunner Trans Systems
TRANSPORTATION - Air Delivery and Freight Service
|
$27.45
|
-0.55
-1.96% |
$27.94
|
110,352
51.91% of 50 DAV
50 DAV is 212,600
|
$29.52
-7.01%
|
4/3/2013
|
$22.77
|
PP = $23.75
|
|
MB = $24.94
|
Most Recent Note - 6/18/2013 6:10:41 PM
G - Following a "negative reversal" at its 52-week high on the prior session it pulled back today, meanwhile while the market had a positive bias. Fundamental concerns were raised by its sub par earnings increase in the Mar '13 quarter, below the +25% minimum guideline (C criteria).
>>> The latest Featured Stock Update with an annotated graph appeared on 6/4/2013. Click here.
View all notes |
Alert me of new notes |
CANSLIM.net Company Profile |
SEC |
Zacks Reports |
StockTalk |
News |
Chart |
Request a new note
C
A N
S L
I M
|
Symbol/Exchange
Company Name
Industry Group |
PRICE |
CHANGE
(%Change) |
Day High |
Volume
(% DAV)
(% 50 day avg vol) |
52 Wk Hi
% From Hi |
Featured
Date |
Price
Featured |
Pivot Featured |
|
Max Buy |
VRX
-
NYSE
Valeant Pharmaceuticals
DRUGS - Drug Manufacturers - Other
|
$86.41
|
+0.55
0.64% |
$87.55
|
8,347,277
487.01% of 50 DAV
50 DAV is 1,714,000
|
$96.25
-10.22%
|
4/30/2013
|
$60.24
|
PP = $76.66
|
|
MB = $80.49
|
Most Recent Note - 6/14/2013 6:27:45 PM
G- Concerns were raised by its sub par Mar '13 earnings report, however mostly bullish action has followed.Volume totals have been cooling while consolidating above prior highs. Support to watch is at prior highs coinciding with its 50 DMA near $76.
>>> The latest Featured Stock Update with an annotated graph appeared on 6/7/2013. Click here.
View all notes |
Alert me of new notes |
CANSLIM.net Company Profile |
SEC |
Zacks Reports |
StockTalk |
News |
Chart |
Request a new note
C
A N
S L
I M
|
|
|
|
THESE ARE NOT BUY RECOMMENDATIONS!
Comments contained in the body of this report are technical
opinions only. The material herein has been obtained
from sources believed to be reliable and accurate, however,
its accuracy and completeness cannot be guaranteed.
This site is not an investment advisor, hence it does
not endorse or recommend any securities or other investments.
Any recommendation contained in this report may not
be suitable for all investors and it is not to be deemed
an offer or solicitation on our part with respect to
the purchase or sale of any securities. All trademarks,
service marks and trade names appearing in this report
are the property of their respective owners, and are
likewise used for identification purposes only.
This report is a service available
only to active Paid Premium Members.
You may opt-out of receiving report notifications
at any time. Questions or comments may be submitted
by writing to Premium Membership Services 665 S.E. 10 Street, Suite 201 Deerfield Beach, FL 33441-5634 or by calling 1-800-965-8307
or 954-785-1121.
|
|
|

