You are not logged in.
This means you
CAN ONLY VIEW reports that were published prior to Monday, April 14, 2025.
You
MUST UPGRADE YOUR MEMBERSHIP if you want to see any current reports.
AFTER MARKET UPDATE - FRIDAY, JUNE 19TH, 2009
Previous After Market Report Next After Market Report >>>
|
|
|
|
DOW |
-15.87 |
8,539.73 |
-0.19% |
|
Volume |
2,126,845,430 |
+96% |
|
Volume |
3,165,111,350 |
+47% |
|
NASDAQ |
+19.75 |
1,827.47 |
+1.09% |
|
Advancers |
1,866 |
60% |
|
Advancers |
1,597 |
56% |
|
S&P 500 |
+2.86 |
921.23 |
+0.31% |
|
Decliners |
1,119 |
36% |
|
Decliners |
1,108 |
39% |
|
Russell 2000 |
+3.24 |
512.72 |
+0.64% |
|
52 Wk Highs |
18 |
|
|
52 Wk Highs |
30 |
|
|
S&P 600 |
+1.76 |
269.70 |
+0.66% |
|
52 Wk Lows |
2 |
|
|
52 Wk Lows |
6 |
|
|
 |
Major Averages End Lower For First Week Since May
Adam Sarhan, Contributing Writer,
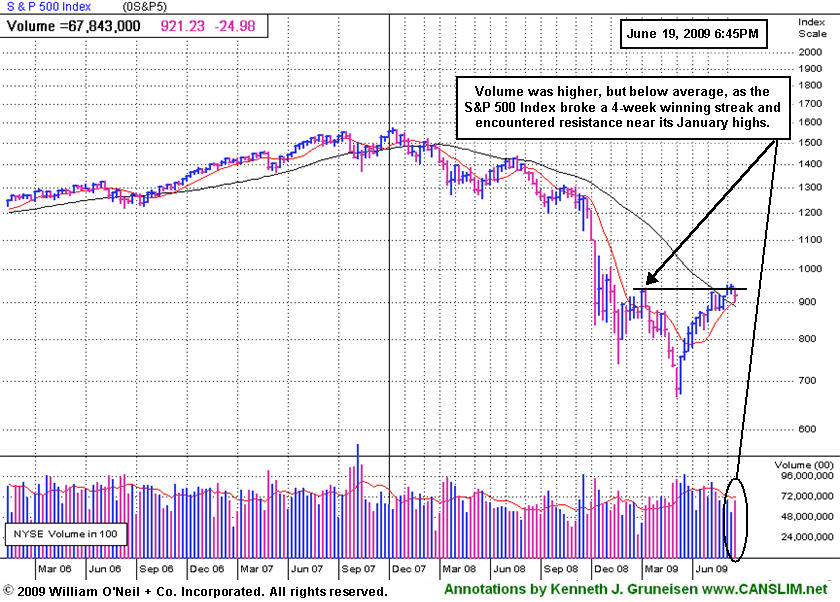
The major averages ended mixed on Friday, but they were collectively lower for the week. This was the first weekly decline since May as investors cashed in positions before the approaching second quarter end. Volume totals were reported considerably higher on both major US exchanges due to Friday's quadruple witching options expirations. Advancers led decliners by almost a 2-to-1 ratio on the NYSE and by approximately a 3-to-2 ratio on the Nasdaq exchange. There were 12 high-ranked companies from the CANSLIM.net Leaders List that made a new 52-week high and appeared on the CANSLIM.net BreakOuts Page, higher than the 8 issues that appeared on the prior session. A further expansion in the new highs list would offer encouraging news for growth oriented investors.
On Monday, the major averages sliced below near term support levels which was a serious warning sign for this 15-week rally. Tepid data from New York’s manufacturing sector coupled with a positive outlook from the International Monetary Fund (IMF) weighed on stocks. The Federal Reserve Bank of New York released its general economic index on Monday. The index, which measures manufacturing activity in the New York region, fell to -9.4. Readings below zero signal a contraction. In addition, the report fell short of the Street's -4.6 estimate which bodes poorly for the health of the overall economy. The US dollar rallied after the International Monetary Fund (IMF) raised its outlook for the US economy. The Russian Finance Minister Alexei Kudrin also made the case for a stronger dollar after he said the greenback is in “good shape.” Even though the news sent the US dollar higher, it adversely affected US equities and sent a slew of commodity prices lower. Over the weekend, the Group of Eight (G8) finance ministers met in Italy to discuss the global economy. The group focused on cutting soaring budget deficits and reducing bank bailouts.
On Tuesday, stocks ended lower after mixed news from the economic front was released. Housing starts in May showed surprising strength while producer prices eased. Housing starts jumped +17.2% in May which followed a -12.9% drop in April. Elsewhere, producer prices fell in May and were below expectations. The inflation component of the report (core prices) also fell. Overall producer prices eased to a +0.2% gain after rising +0.3% in April. May's reading was far short of the +0.7% increase the Street had expected. Core prices fell -0.1% in May which helped ease inflationary concerns.
On Wednesday, stocks ended mixed after FedEx (FDX -0.98%) released a disappointing earnings forecast and said the economy is "extremely difficult." Elsewhere, the rating giant, Standard & Poor's downgraded the credit ratings of 18 banks as Congress prepared legislation to address the financial industry. Several of the country's largest banks began repaying TARP funds, yet this was a foregone conclusion and investors largely yawned at the news. In other economic news, the Labor Department released the consumer prices index (CPI) which showed that the cost of living in the US rose at a slower-than-expected pace in May. This helped allay inflation concerns and was the largest 12-month drop in prices in almost 60 years! The consumer price index rose +0.1% after no change a month earlier. From May 2008- May 2009, the consumer price index fell -1.3% which was the largest decline since 1950. Remember that prices last year were way out of whack with historical norms, so a pullback of some sort is not necessarily a bad thing. At this point, how many people do you know who are really upset at paying lower bills each month?
On Thursday, the major averages ended mixed after healthy economic data helped raise hopes the recession has bottomed. The Labor Department said continuing jobless claims slid by 148,000 to 6.69 million, which was the first decline since January. The report also showed that weekly initial claims increased 3,000 to 608,000. After the open, the Conference Board released its index of leading economic indicators which rose +1.2%. The Philly Fed Survey, a separate report, showed that manufacturing shrank at the slowest rate in nine months in the Philadelphia area. Treasury Secretary Timothy Geithner defended the administration’s plan to extend powers to the Federal Reserve.
On Friday, stocks ended mixed as a slew of options expired. Friday marked the simultaneous expiration of monthly and quarterly options, an event which is known as quadruple witching. Looking at the market, the 15-week rally remains intact, but under pressure. Leadership remains scant, which continues to be the bane for this current rally. It is of the utmost importance for a fresh batch of leadership to emerge in order for any sustained move higher. Objectively, this rally appears to be losing steam as it is aging, and investors must remain cautious and extremely selective until a fresh round of accumulation occurs. Furthermore, if the major averages continue to fall, this rally could quickly end, and raising cash would be prudent.
Money Management Services - WE FOLLOW THE RULES! DOES YOUR BROKER?
Managing money can be difficult at times. Are you looking for a money manager who follows a proven set of rules? If you are frustrated because your broker/money manager does not follow all the rules of this powerful investment system contact us. We have veterans who have been in business for over 20 years who pride themselves on their ability to closely follow all the rules of the investment system in both bull and bear markets. You may inquire about having your account professionally managed using this fact-based investment system by clicking HERE. *Accounts over $250,000 please. ** Serious inquiries only.
PICTURED: The S&P 500 Index pulled back after encountering resistance this week.
|
|
|
 |
Energy Group Lagged Amid Broader Gains
Kenneth J. Gruneisen - Passed the CAN SLIM® Master's Exam
Defensive positioning helped the Healthcare Index ($HMO +2.94%) and Gold & Silver Index ($XAU +2.98%) produce standout gains on Friday. The tech sector's gains helped the Nasdaq Composite outperform its peers as the Semiconductor ($SOX +1.22%) and Networking ($NWX +1.50%) indexes outpaced the Internet ($IIX +0.47%) and Biotechnology ($BTK +0.70%) indexes. The energy group lagged as the Oil Services ($OSX -0.74%) and Integrated Oil ($XOI -0.15%) indexes edged lower, meanwhile most other groups were on the rise. The Bank ($BKX +2.05%) and Broker/Dealer ($XBD +0.75%) indexes traded with a positive bias, as did the Retail Index ($RLX +1.16%).
Charts courtesy www.stockcharts.com
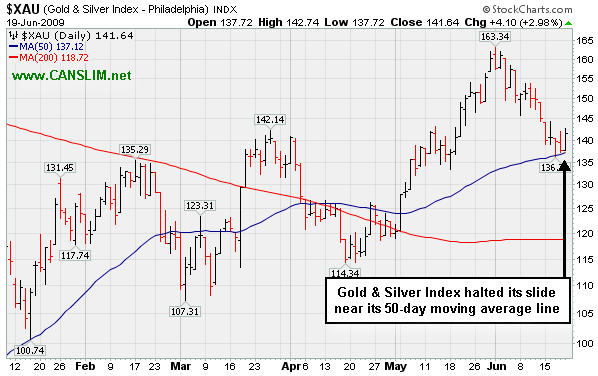
PICTURED: The Gold & Silver Index ($XAU +2.98%) halted its slide near its 50-day moving average line.
| Oil Services |
$OSX |
165.78 |
-1.24 |
-0.74% |
+36.57% |
| Healthcare |
$HMO |
1,132.15 |
+32.36 |
+2.94% |
+17.91% |
| Integrated Oil |
$XOI |
929.65 |
-1.35 |
-0.15% |
-5.11% |
| Semiconductor |
$SOX |
264.47 |
+3.20 |
+1.22% |
+24.65% |
| Networking |
$NWX |
187.14 |
+2.76 |
+1.50% |
+30.06% |
| Internet |
$IIX |
187.24 |
+0.87 |
+0.47% |
+39.97% |
| Broker/Dealer |
$XBD |
98.26 |
+0.73 |
+0.75% |
+26.84% |
| Retail |
$RLX |
320.07 |
+3.66 |
+1.16% |
+14.61% |
| Gold & Silver |
$XAU |
141.64 |
+4.10 |
+2.98% |
+14.36% |
| Bank |
$BKX |
37.32 |
+0.75 |
+2.05% |
-15.79% |
| Biotech |
$BTK |
679.07 |
+4.74 |
+0.70% |
+4.93% |
|
|
|
 |
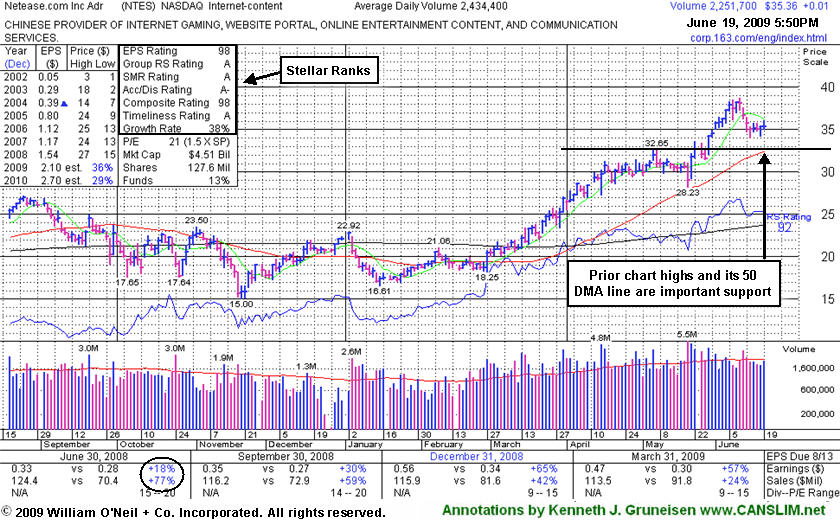
Prior Highs and 50 DMA Line Are Important Support To Watch
Kenneth J. Gruneisen - Passed the CAN SLIM® Master's Exam
Netease.com Inc (NTES +$0.01 or +0.03% to $35.36) is a high-ranked leader that is consolidating and still a bit too extended from its second-stage base. Prior chart highs and its 50-day moving average (DMA) line (both near $32) are an important support level to watch on pullbacks. Subsequent violations might prompt investors with a profitable interest in NTES to lock in profits. Deterioration back into its prior base would obviously raise concerns and trigger technical sell signals.
The number of top-rated funds owning an interest in its shares increased from 18 in June '08 to 68 in March '09, which is very reassuring news in respect to the I criteria. NTES was first featured at $26.75 in the 3/31/09 CANSLIM.net Mid-Day Breakouts Report (read here). A considerable gain with above average volume on 5/21/09 was noted as an indication of prompt institutional support, and its color code was then changed to yellow with a new pivot point of $32.75 based upon its 5/07/09 high plus .10. It found support at its 50-day moving average (DMA) line on 5/20/09 after consolidating in a tight range for several weeks following a previous steady advance into new all-time high territory. This high-ranked Chinese Internet - Content firm was also summarized in greater detail including an annotated graph in the April 2009 issue of CANSLIM.net News (read here).
|
|
|
Color Codes Explained :
Y - Better candidates highlighted by our
staff of experts.
G - Previously featured
in past reports as yellow but may no longer be buyable under the
guidelines.
***Last / Change / Volume quote data in this table corresponds with the timestamp on the note***
Symbol/Exchange
Company Name
Industry Group |
Last |
Chg. |
Vol
% DAV |
Date Featured |
Price Featured |
Latest Pivot Point
Featured |
Status |
| Latest Max Buy Price |
GMCR
- NASDAQ
Green Mtn Coffee Roastrs
FOOD & BEVERAGE - Processed & Packaged Goods
|
$56.53
|
N/A
|
N/A
N/A
|
1/1/2008
(Date
Featured) |
$27.13
(Price
Featured) |
PP = $28.66 |
G |
| MB = $30.09 |
Most Recent Note - 6/19/2009 5:58:18 PM
G - Small gain today on average volume ended a 5 session losing streak. Consolidating well above its 50 DMA line -important support to watch. 3:2 stock split effective 6/09/09. GMCR has traded up more than +144% since appearing with an annotated graph under the headline "It May Soon Be Time To Go Green" when featured in the January 2009 CANSLIM.net News (read here).
>>> The latest Featured Stock Update with an annotated graph appeared on 6/8/2009. click here.
|
|
C
A
S
I |
News |
Chart |
SEC
View all notes Alert
me of new notes
Company
Profile
|
HMSY
- NASDAQ
H M S Holdings Corp
COMPUTER SOFTWARE & SERVICES - Healthcare Information Service
|
$40.06
|
N/A
|
N/A
N/A
|
2/20/2009
(Date
Featured) |
$34.08
(Price
Featured) |
PP = $38.38 |
Y |
| MB = $40.30 |
Most Recent Note - 6/19/2009 6:00:30 PM
Y - Gapped up and posted a 5th consecutive gain today with above average volume, trading near its max buy level. Gap up gain on 6/16/09 with heavy volume triggered a technical buy signal. No overhead supply is left to hinder the progress for this Commercial Services - Healthcare firm.
>>> The latest Featured Stock Update with an annotated graph appeared on 6/16/2009. click here.
|
|
C
A
S
I |
News |
Chart |
SEC
View all notes Alert
me of new notes
Company
Profile
|
LFT
-
|
$26.37
|
N/A
|
N/A
N/A
|
4/2/2009
(Date
Featured) |
$22.19
(Price
Featured) |
PP = $21.81 |
G |
| MB = $22.90 |
Most Recent Note - 6/19/2009 6:02:23 PM
G - Held its ground this week after a 6/17/09 positive reversal was an encouraging sign of institiutional support near its 50 DMA line. Previously noted on 6/05/09 as it rose from a choppy (improper) base pattern. Its progress could be hindered by future share offerings. Prompt repair of its recent 50 DMA line violation, and its gap up, were noted as signs of solid institutional (the I criteria) support and buying demand. This Chinese Computer Software firm recently filed a registration of approximately 16 million shares for resale, and it also revealed a planned acquisition of another Chinese service provider.
>>> The latest Featured Stock Update with an annotated graph appeared on 6/18/2009. click here.
|
|
C
A
S
I |
News |
Chart |
SEC
View all notes Alert
me of new notes
Company
Profile
|
NTES
- NASDAQ
Netease Inc Adr
INTERNET - Internet Information Providers
|
$35.36
|
N/A
|
N/A
N/A
|
5/21/2009
(Date
Featured) |
$31.19
(Price
Featured) |
PP = $32.75 |
G |
| MB = $34.39 |
Most Recent Note - 6/19/2009 6:03:59 PM
G - This strong leader is quietly consolidating and still a bit too extended from its second-stage base, while prior chart highs and its 50 DMA line (both near $32) are an important support level to watch on pullbacks. Its 5/28/09 gap up and considerable gain with +79% above average volume confirmed a technical buy signal as it rose above its pivot point. Indications of institutional (the I criteria) buying demand have been noted after earnings news on 5/20/09 a shakeout tested support near its 50 DMA line. First featured at $26.75 in the 3/31/09 CANSLIM.net Mid-Day Breakouts Report (read here). This high-ranked Chinese Internet - Content firm was also summarized in greater detail including an annotated graph in the April 2009 issue of CANSLIM.net News (read here).
>>> The latest Featured Stock Update with an annotated graph appeared on 6/19/2009. click here.
|
|
C
A
S
I |
News |
Chart |
SEC
View all notes Alert
me of new notes
Company
Profile
|
NVEC
- NASDAQ
N V E Corp
ELECTRONICS - Semiconductor - Specialized
|
$47.55
|
N/A
|
N/A
N/A
|
3/13/2009
(Date
Featured) |
$33.85
(Price
Featured) |
PP = $45.50 |
Y |
| MB = $47.78 |
Most Recent Note - 6/19/2009 6:24:42 PM
Y - Considerable gain and strong finish today with volume more than 2 times average helped it rise from an "ascending base" type pattern to a new 52-week high and multi-year high, triggering a technical buy signal. Color code was changed to yellow with new pivot point and max buy prices noted in today's mid-day report (read here). Found support above its 50 DMA line in May which was an encouraging sign. Sales increases in recent comparisons have been under the +25% guideline and still rather minuscule, leaving concerns, especially in the event of any hiccups. This is a reason to be especially disciplined about proper entries and exits.
>>> The latest Featured Stock Update with an annotated graph appeared on 6/9/2009. click here.
|
|
C
A
S
I |
News |
Chart |
SEC
View all notes Alert
me of new notes
Company
Profile
|
SNDA
-
|
$55.08
|
N/A
|
N/A
N/A
|
5/31/2009
(Date
Featured) |
$57.62
(Price
Featured) |
PP = $53.95 |
Y |
| MB = $56.65 |
Most Recent Note - 6/19/2009 6:28:38 PM
Y - This week it halted a worrisome 5-session losing streak after distributional pressure drove it down near its previously cited pivot point and its 50 DMA line. Subsequent violations could trigger technical sell signals. Its color code was changed to yellow. Detailed analysis was included when recently featured in the June 2009 issue of CANSLIM.net News. Be sure to review the "What to Look Out For" section and entire detailed summary - read here).
>>> The latest Featured Stock Update with an annotated graph appeared on 6/17/2009. click here.
|
|
C
A
S
I |
News |
Chart |
SEC
View all notes Alert
me of new notes
Company
Profile
|
SYNA
- NASDAQ
Synaptics Inc
COMPUTER SOFTWARE & SERVICES - Information Technology Service
|
$38.92
|
N/A
|
N/A
N/A
|
5/18/2009
(Date
Featured) |
$32.58
(Price
Featured) |
PP = $34.52 |
G |
| MB = $36.25 |
Most Recent Note - 6/19/2009 6:29:25 PM
G - Quietly held its ground this week while consolidating above its August 2008 chart highs ($36), its 50 DMA line, and recent chart highs that define an important support level. First featured in yellow in the May 18, 2009 mid-day report (read here). The number of top-rated funds owning its shares rose from 123 in June '08 to 194 in March '09, which is good news concerning the I criteria. Its annual earnings (the A criteria) history showed a dowturn in 2006, leaving concerns, but it followed that up with strong growth the next 2 years. Its small supply of shares (the S criteria) outstanding could contribute to especially great volatility in the event of institutional accumulation or distribution.
>>> The latest Featured Stock Update with an annotated graph appeared on 6/15/2009. click here.
|
|
C
A
S
I |
News |
Chart |
SEC
View all notes Alert
me of new notes
Company
Profile
|
TNDM
- NASDAQ
Tandem Diabetes Care Inc
TELECOMMUNICATIONS - Wireless Communications
|
$29.20
|
N/A
|
N/A
N/A
|
3/2/2009
(Date
Featured) |
$18.89
(Price
Featured) |
PP = $29.85 |
G |
| MB = $31.34 |
Most Recent Note - 6/19/2009 6:33:15 PM
G - Gapped up on Friday and posted a 4th consecutive gain on higher volume, rising further above its 50 DMA line. It triggered a technical sell signal when it violated its 50 DMA line in the prior week with big losses on heavy volume which were indicative of worrisome distributional pressure. A sound base needs to form before new buying efforts might be justified under the investment system's guidelines. It traded up as much as +72.42% since first featured at $18.89 in the 3/02/09 Mid-Day BreakOuts Report (read here).
>>> The latest Featured Stock Update with an annotated graph appeared on 6/10/2009. click here.
|
|
C
A
S
I |
News |
Chart |
SEC
View all notes Alert
me of new notes
Company
Profile
|
|
|
|
THESE ARE NOT BUY RECOMMENDATIONS!
Comments contained in the body of this report are technical
opinions only. The material herein has been obtained
from sources believed to be reliable and accurate, however,
its accuracy and completeness cannot be guaranteed.
This site is not an investment advisor, hence it does
not endorse or recommend any securities or other investments.
Any recommendation contained in this report may not
be suitable for all investors and it is not to be deemed
an offer or solicitation on our part with respect to
the purchase or sale of any securities. All trademarks,
service marks and trade names appearing in this report
are the property of their respective owners, and are
likewise used for identification purposes only.
This report is a service available
only to active Paid Premium Members.
You may opt-out of receiving report notifications
at any time. Questions or comments may be submitted
by writing to Premium Membership Services 665 S.E. 10 Street, Suite 201 Deerfield Beach, FL 33441-5634 or by calling 1-800-965-8307
or 954-785-1121.
|
|
|


