You are not logged in.
This means you
CAN ONLY VIEW reports that were published prior to Monday, April 28, 2025.
You
MUST UPGRADE YOUR MEMBERSHIP if you want to see any current reports.
AFTER MARKET UPDATE - THURSDAY, JUNE 18TH, 2009
Previous After Market Report Next After Market Report >>>
|
|
|
|
DOW |
+58.42 |
8,555.60 |
+0.69% |
|
Volume |
1,087,834,740 |
-17% |
|
Volume |
2,156,514,060 |
-16% |
|
NASDAQ |
-0.34 |
1,807.72 |
-0.02% |
|
Advancers |
1,745 |
56% |
|
Advancers |
1,425 |
50% |
|
S&P 500 |
+7.66 |
918.37 |
+0.84% |
|
Decliners |
1,261 |
41% |
|
Decliners |
1,263 |
45% |
|
Russell 2000 |
+2.45 |
509.48 |
+0.48% |
|
52 Wk Highs |
8 |
|
|
52 Wk Highs |
20 |
|
|
S&P 600 |
+1.69 |
267.94 |
+0.63% |
|
52 Wk Lows |
1 |
|
|
52 Wk Lows |
5 |
|
|
 |
Volume Recedes As Indices Consolidate
Adam Sarhan, Contributing Writer,
The major averages ended mixed on Thursday after healthy economic data helped raise hopes the recession has bottomed. Volume totals were reported exceptionally lower on both major US exchanges. Advancers led decliners by a little less than a 3-to-2 ratio on the NYSE, but the mix was closer to even on the Nasdaq exchange. There were 8 high-ranked companies from the CANSLIM.net Leaders List that made a new 52-week high and appeared on the CANSLIM.net BreakOuts Page, higher than the 5 issues that appeared on the prior session. A further expansion in the new highs list would offer encouraging news for growth oriented investors.
The market opened higher as the Labor Department said continuing jobless claims slid by 148,000 to 6.69 million, which was the first decline since January. The report also showed that weekly initial claims increased 3,000 to 608,000. After the open, the Conference Board released its index of leading economic indicators which rose +1.2%. The Philly Fed Survey, a separate report, showed that manufacturing shrank at the slowest rate in nine months in the Philadelphia area.
Treasury Secretary Timothy Geithner defended the administration’s plan to extend powers to the Federal Reserve. The plan will increase the Fed's power, but lawmakers were skeptical whether the plan will give the Fed too much power. The administration's plan calls for the Fed to review consumer financial products such as hedge funds and private equity firms. Congress continues to prepare legislation to overhaul the financial services industry.
The 15-week rally remains intact, but under pressure. Leadership remains scant, which continues to be the bane for this current rally. It is of the utmost importance for a fresh batch of leadership to emerge in order for any sustained move higher. This rally appears to be losing steam as it is aging, and investors must remains cautious and extremely selective until a fresh round of accumulation occurs. Furthermore, if the major averages continue to fall, this rally could quickly end, and raising cash would be a wise strategy.
PICTURED: The Nasdaq Composite Index closed above prior chart highs and near an upward trendline (not shown) which are important technical support levels well above its 50-day moving average line.
|
|
|
 |
HMO Index Blasted Above 50-Day Average From Support Near 200-Day Line
Kenneth J. Gruneisen - Passed the CAN SLIM® Master's Exam
The major averages put up mixed results, with the Nasdaq Composite closing just barely in the red due to losses from the Semiconductor Index ($SOX -1.84%) and smaller losses from the Internet ($IIX -0.54%) and Networking ($NWX -0.45%) indexes. Weakness in the Retail Index ($RLX -1.33%) and the Gold & Silver Index ($XAU -1.60%) created a drag on the market, and the Oil Services ($OSX -0.41%) and Integrated Oil ($XOI -0.07%) indexes also edged lower. Meanwhile, financial and medical related shares were Thursday's standout gainers. The Bank ($BKX +2.96%) and Broker/Dealer ($XBD +0.64%) indexes posted gains. The Biotechnology Index ($BTK +2.05%) and many medical industry shares rose while traders considered the possibility that healthcare reform is going to be costlier and less expansive than expected.
Charts courtesy www.stockcharts.com
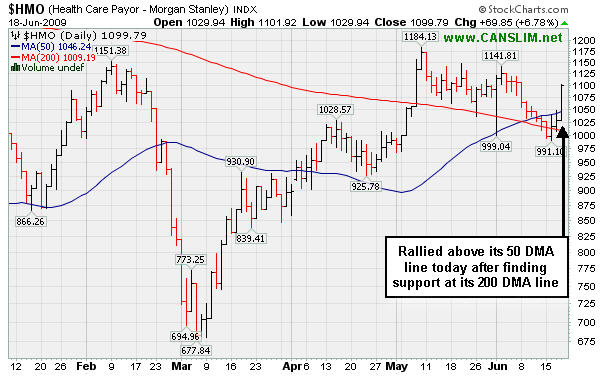
PICTURED: The Healthcare Index ($HMO +6.78%) recently found support near its 200-day moving average (DMA) line, and a big gain on Thursday helped it rally back above its 50 DMA line.
| Oil Services |
$OSX |
167.02 |
-0.69 |
-0.41% |
+37.59% |
| Healthcare |
$HMO |
1,099.79 |
+69.85 |
+6.78% |
+14.54% |
| Integrated Oil |
$XOI |
931.00 |
-0.61 |
-0.07% |
-4.97% |
| Semiconductor |
$SOX |
261.27 |
-4.89 |
-1.84% |
+23.14% |
| Networking |
$NWX |
184.35 |
-0.84 |
-0.45% |
+28.12% |
| Internet |
$IIX |
186.35 |
-1.02 |
-0.54% |
+39.31% |
| Broker/Dealer |
$XBD |
97.53 |
+0.62 |
+0.64% |
+25.89% |
| Retail |
$RLX |
316.41 |
-4.25 |
-1.33% |
+13.30% |
| Gold & Silver |
$XAU |
137.54 |
-2.23 |
-1.60% |
+11.05% |
| Bank |
$BKX |
36.57 |
+1.05 |
+2.96% |
-17.49% |
| Biotech |
$BTK |
674.33 |
+13.53 |
+2.05% |
+4.20% |
|
|
|
 |
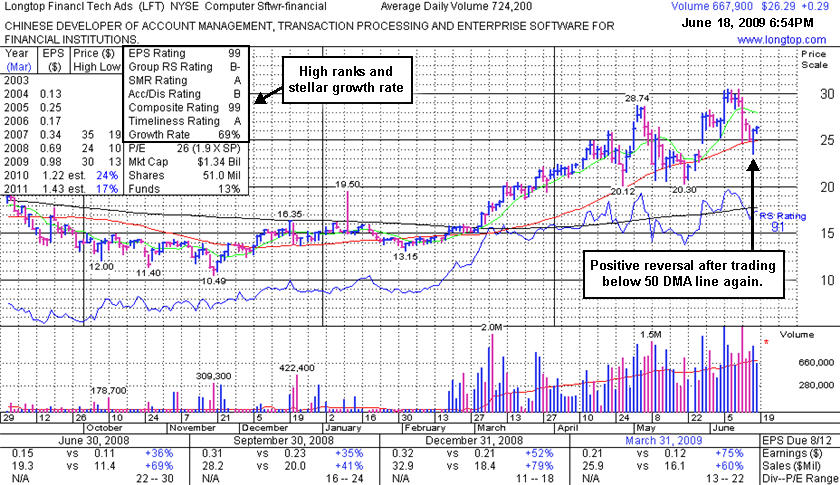
Important Support Tested Near 50-Day Moving Average
Kenneth J. Gruneisen - Passed the CAN SLIM® Master's Exam
Longtop Financl Tech Ads (LFT +$0.29 or +1.12% to $26.29) held its ground today with a small gain on lighter volume. That followed a "positive reversal" which was another encouraging sign of institutional support after a brief violation of its 50-day moving average (DMA) line. However, it recently has encountered another dose of worrisome distributional pressure, and it needs more time to form a sound new base pattern -as noted under the headline "More Time Needed For Another Sound Base To Form" in its prior FSU appearance (read here).
Any subsequent losses leading to deterioration below its short-term average would raise additional concerns and trigger a more worrisome technical sell signal. Keep in mind that its progress could be hindered by future share offerings. This Chinese Computer Software firm recently filed a registration of approximately 16 million shares for resale, and it also revealed a planned acquisition of another Chinese service provider.
|
|
|
Color Codes Explained :
Y - Better candidates highlighted by our
staff of experts.
G - Previously featured
in past reports as yellow but may no longer be buyable under the
guidelines.
***Last / Change / Volume quote data in this table corresponds with the timestamp on the note***
Symbol/Exchange
Company Name
Industry Group |
Last |
Chg. |
Vol
% DAV |
Date Featured |
Price Featured |
Latest Pivot Point
Featured |
Status |
| Latest Max Buy Price |
GMCR
- NASDAQ
Green Mtn Coffee Roastrs
FOOD & BEVERAGE - Processed & Packaged Goods
|
$56.00
|
N/A
|
N/A
N/A
|
1/1/2008
(Date
Featured) |
$27.13
(Price
Featured) |
PP = $28.66 |
G |
| MB = $30.09 |
Most Recent Note - 6/18/2009
G - Small loss today on lighter volume was its 5th consecutive down session while consolidating well above its 50 DMA line -important support to watch. 3:2 stock split effective 6/09/09. GMCR has traded up more than +144% since appearing with an annotated graph under the headline "It May Soon Be Time To Go Green" when featured in the January 2009 CANSLIM.net News (read here).
>>> The latest Featured Stock Update with an annotated graph appeared on 6/8/2009. click here.
|
|
C
A
S
I |
News |
Chart |
SEC
View all notes Alert
me of new notes
Company
Profile
|
HMSY
- NASDAQ
H M S Holdings Corp
COMPUTER SOFTWARE & SERVICES - Healthcare Information Service
|
$39.16
|
N/A
|
N/A
N/A
|
2/20/2009
(Date
Featured) |
$34.08
(Price
Featured) |
PP = $38.38 |
Y |
| MB = $40.30 |
Most Recent Note - 6/18/2009 6:25:14 PM
Y - Small gain today on lighter volume for a third consecutive new high close. Gap up gain on 6/16/09 with heavy volume triggered a technical buy signal. No overhead supply is left to hinder the progress for this Commercial Services - Healthcare firm.
>>> The latest Featured Stock Update with an annotated graph appeared on 6/16/2009. click here.
|
|
C
A
S
I |
News |
Chart |
SEC
View all notes Alert
me of new notes
Company
Profile
|
LFT
-
|
$26.29
|
N/A
|
N/A
N/A
|
4/2/2009
(Date
Featured) |
$22.19
(Price
Featured) |
PP = $21.81 |
G |
| MB = $22.90 |
Most Recent Note - 6/18/2009 6:29:47 PM
G - Small gain on lighter volume today followed a positive reversal which was a very encouraging sign of institiutional support after an intra-day violation of its 50 DMA line. Previously noted on 6/05/09 as it rose from a choppy (improper) base pattern. Its progress could be hindered by future share offerings. Prompt repair of its recent 50 DMA line violation, and its gap up, were noted as signs of solid institutional (the I criteria) support and buying demand. This Chinese Computer Software firm recently filed a registration of approximately 16 million shares for resale, and it also revealed a planned acquisition of another Chinese service provider.
>>> The latest Featured Stock Update with an annotated graph appeared on 6/18/2009. click here.
|
|
C
A
S
I |
News |
Chart |
SEC
View all notes Alert
me of new notes
Company
Profile
|
NTES
- NASDAQ
Netease Inc Adr
INTERNET - Internet Information Providers
|
$35.35
|
N/A
|
N/A
N/A
|
5/21/2009
(Date
Featured) |
$31.19
(Price
Featured) |
PP = $32.75 |
G |
| MB = $34.39 |
Most Recent Note - 6/18/2009 6:34:14 PM
G - Small gain on light volume today (there appears to be a data glitch showing a false low for the session). This strong leader is quietly consolidating and still a bit too extended from its second-stage base, while prior chart highs and its 50 DMA line (both near $32) are an important support level to watch on pullbacks. Its 5/28/09 gap up and considerable gain with +79% above average volume confirmed a technical buy signal as it rose above its pivot point. Indications of institutional (the I criteria) buying demand have been noted after earnings news on 5/20/09 a shakeout tested support near its 50 DMA line. First featured at $26.75 in the 3/31/09 CANSLIM.net Mid-Day Breakouts Report (read here). This high-ranked Chinese Internet - Content firm was also summarized in greater detail including an annotated graph in the April 2009 issue of CANSLIM.net News (read here).
>>> The latest Featured Stock Update with an annotated graph appeared on 6/5/2009. click here.
|
|
C
A
S
I |
News |
Chart |
SEC
View all notes Alert
me of new notes
Company
Profile
|
NVEC
- NASDAQ
N V E Corp
ELECTRONICS - Semiconductor - Specialized
|
$44.11
|
N/A
|
N/A
N/A
|
3/13/2009
(Date
Featured) |
$33.85
(Price
Featured) |
PP = $39.01 |
G |
| MB = $40.96 |
Most Recent Note - 6/18/2009 6:35:33 PM
G - Small loss today on light volume leaves it still perched near its 52-week high. Found support above its 50 DMA line in May which was an encouraging sign. Earnings per share rose +38% over the year ago period, yet sales were up just +14% and still rather minuscule.
>>> The latest Featured Stock Update with an annotated graph appeared on 6/9/2009. click here.
|
|
C
A
S
I |
News |
Chart |
SEC
View all notes Alert
me of new notes
Company
Profile
|
SNDA
-
|
$54.66
|
N/A
|
N/A
N/A
|
5/31/2009
(Date
Featured) |
$57.62
(Price
Featured) |
PP = $53.95 |
Y |
| MB = $56.65 |
Most Recent Note - 6/18/2009 6:38:27 PM
Y - Two tiny gains on light volume have helped halt a worrisome 5-session losing streak near its previously cited pivot point and its 50 DMA line, where violations could trigger technical sell signals. Its color code was changed to yellow. Detailed analysis was included when recently featured in the June 2009 issue of CANSLIM.net News. Be sure to review the "What to Look Out For" section and entire detailed summary - read here).
>>> The latest Featured Stock Update with an annotated graph appeared on 6/17/2009. click here.
|
|
C
A
S
I |
News |
Chart |
SEC
View all notes Alert
me of new notes
Company
Profile
|
SYNA
- NASDAQ
Synaptics Inc
COMPUTER SOFTWARE & SERVICES - Information Technology Service
|
$38.24
|
N/A
|
N/A
N/A
|
5/18/2009
(Date
Featured) |
$32.58
(Price
Featured) |
PP = $34.52 |
G |
| MB = $36.25 |
Most Recent Note - 6/18/2009 6:39:43 PM
G - Quietly held its ground today while consolidating above its August 2008 chart highs ($36), its 50 DMA line, and recent chart highs that define an important support level. First featured in yellow in the May 18, 2009 mid-day report (read here). The number of top-rated funds owning its shares rose from 123 in June '08 to 194 in March '09, which is good news concerning the I criteria. Its annual earnings (the A criteria) history showed a dowturn in 2006, leaving concerns, but it followed that up with strong growth the next 2 years. Its small supply of shares (the S criteria) outstanding could contribute to especially great volatility in the event of institutional accumulation or distribution.
>>> The latest Featured Stock Update with an annotated graph appeared on 6/15/2009. click here.
|
|
C
A
S
I |
News |
Chart |
SEC
View all notes Alert
me of new notes
Company
Profile
|
TNDM
- NASDAQ
Tandem Diabetes Care Inc
TELECOMMUNICATIONS - Wireless Communications
|
$27.63
|
N/A
|
N/A
N/A
|
3/2/2009
(Date
Featured) |
$18.89
(Price
Featured) |
PP = $29.85 |
G |
| MB = $31.34 |
Most Recent Note - 6/18/2009 6:43:00 PM
G - Gain on lighter volume today helped it close back above its 50 DMA line. It triggered a technical sell signal when it violated its 50 DMA line last week with big losses on heavy volume which were indicative of worrisome distributional pressure. A sound base needs to form before new buying efforts might be justified under the investment system's guidelines. It traded up as much as +72.42% since first featured at $18.89 in the 3/02/09 Mid-Day BreakOuts Report (read here).
>>> The latest Featured Stock Update with an annotated graph appeared on 6/10/2009. click here.
|
|
C
A
S
I |
News |
Chart |
SEC
View all notes Alert
me of new notes
Company
Profile
|
|
|
|
THESE ARE NOT BUY RECOMMENDATIONS!
Comments contained in the body of this report are technical
opinions only. The material herein has been obtained
from sources believed to be reliable and accurate, however,
its accuracy and completeness cannot be guaranteed.
This site is not an investment advisor, hence it does
not endorse or recommend any securities or other investments.
Any recommendation contained in this report may not
be suitable for all investors and it is not to be deemed
an offer or solicitation on our part with respect to
the purchase or sale of any securities. All trademarks,
service marks and trade names appearing in this report
are the property of their respective owners, and are
likewise used for identification purposes only.
This report is a service available
only to active Paid Premium Members.
You may opt-out of receiving report notifications
at any time. Questions or comments may be submitted
by writing to Premium Membership Services 665 S.E. 10 Street, Suite 201 Deerfield Beach, FL 33441-5634 or by calling 1-800-965-8307
or 954-785-1121.
|
|
|


